Enveloping & Stacking Machine Market Analysis - Size, Share, and Forecast Outlook 2025 to 2035

The enveloping and stacking machine market is set to grow from USD 380.5 million in 2025 to USD 1,664.3 million by 2035, reflecting a CAGR of 15.9%. A rolling CAGR analysis highlights the contributions of different periods within the decade. From 2025 to 2027, growth accelerates as manufacturers in packaging, printing, and industrial sectors adopt automated and integrated systems to improve throughput, reduce labor, and enhance operational efficiency. This early phase demonstrates strong uptake driven by productivity and precision improvements.
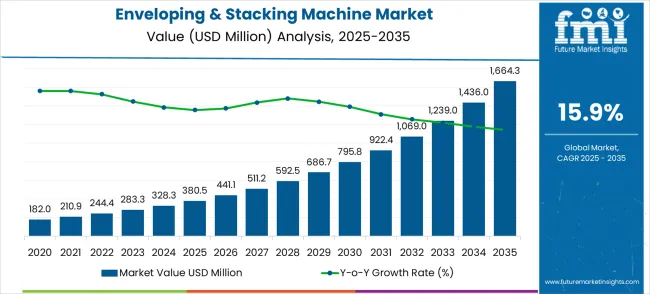
Quick Stats for Enveloping & Stacking Machine Market

  • Enveloping & Stacking Machine Market Value (2025): USD 380.5 million
  • Enveloping & Stacking Machine Market Forecast Value (2035): USD 1,664.3 million
  • Enveloping & Stacking Machine Market Forecast CAGR: 15.9%
  • Leading Automation Level: Semi-automatic
  • Key Growth Regions: Asia-Pacific, North America, and Europe
  • Top Key Players: Manz AG, Hitachi High-Tech, CKD Corporation, Lead Intelligent Equipment, Shenzhen Yinghe Technology, Wuxi Lead Intelligent Equipment, PNT (PNT Precision), Nagano Automation, KUKA (via customized integration), Hirano Tecseed, Better Technology Group

Enveloping & Stacking Machine Market Market Value Analysis

Between 2027 and 2030, growth steadies as initial adoption stabilizes and additional demand comes from system upgrades and expansion in mid-sized production facilities. The rolling CAGR during this period reflects balanced growth across mature and emerging markets. In the later half, 2030 to 2035, growth strengthens again as advanced machines with higher speed, energy-efficient designs, and improved connectivity reach wider industrial applications. Replacement cycles and adoption in new regions contribute further to market expansion. The rolling CAGR pattern illustrates periods of acceleration followed by steadier growth, providing insights for manufacturers to plan production, align technological development, and target regional deployment effectively throughout the decade.

Enveloping & Stacking Machine Market Key Takeaways

Metric Value
Estimated Value in (2025E) USD 380.5 million
Forecast Value in (2035F) USD 1,664.3 million
Forecast CAGR (2025 to 2035) 15.9%

The global demand for enveloping and stacking machines is largely driven by postal and courier operations, which account for approximately 36% of usage due to the need for high-speed mail processing. Printing and packaging industries follow at 28%, leveraging these machines to automate inserts, envelopes, and product literature. Banking and financial institutions represent around 18%, focusing on efficient handling of bulk statements and notices. The pharmaceutical and healthcare sector contributes 10%, using machines to manage leaflets, prescriptions, and informational brochures. Specialty commercial operations account for the remaining 8%, supporting promotional campaigns and customized mailing solutions.

Recent developments include the adoption of intelligent feeding and sorting mechanisms, modular designs, and energy-efficient operations. Manufacturers are enhancing flexibility with adjustable stacking heights, rapid envelope changeovers, and automation-ready systems. Expansion in e-commerce fulfillment centers, corporate mailrooms, and high-volume document processing is accelerating growth. Collaborations between equipment providers and end-users focus on tailored solutions for reliability, precision, and throughput efficiency, sustaining steady global adoption.

Opportunity Pathways - Enveloping & Stacking Machine Market

The enveloping & stacking machine market represents a high-growth manufacturing automation opportunity directly tied to the electric vehicle revolution, with the market projected to expand from USD 380.5 million in 2025 to USD 1,664.3 million by 2035 at a strong 15.9% CAGR, a 4.4X growth driven by the critical role these machines play in lithium-ion battery cell assembly. This specialized equipment enables the precise layering of battery electrodes, separators, and electrolytes, which is essential for consistent battery performance and safety in electric vehicles and energy storage systems.

The market benefits from the convergence of electric vehicle production scaling, energy storage system deployment, and the need for manufacturing precision that only automated systems can deliver at commercial volumes. Semi-automatic systems currently dominate due to their balance of cost-effectiveness and flexibility, while automotive applications lead demand given the massive battery requirements for electric vehicle production. Geographic opportunities are strongest in China (21.5% CAGR) and India (19.9% CAGR), where electric vehicle manufacturing expansion and government support create ideal growth conditions.

Pathway A - Automotive Battery Manufacturing Leadership. Electric vehicle battery production requires high-precision assembly equipment capable of handling different cell formats and ensuring consistent quality at scale. Companies developing automotive-grade systems with proven reliability and integration capabilities will capture the dominant application segment driving market growth. Expected revenue pool: USD 600-900 million.

Pathway B - Semi-Automatic System Optimization. The leading automation segment offers the optimal balance of cost-effectiveness and operational flexibility for manufacturers scaling battery production. Providers developing advanced semi-automatic systems with enhanced precision, throughput, and user-friendly operation will maintain market leadership while enabling cost-effective production scaling. Opportunity: USD 500-750 million.

Pathway C - Industry 4.0 Integration and Smart Manufacturing. Next-generation machines incorporating IoT connectivity, real-time quality monitoring, predictive maintenance, and data analytics enable smart factory integration. Systems offering comprehensive production visibility and optimization capabilities command premium pricing and create ongoing service revenue streams. Revenue uplift: USD 400-600 million.

Pathway D - Geographic Expansion in High-Growth Markets. China and India's massive electric vehicle production scaling creates unprecedented demand for battery assembly equipment. Local manufacturing partnerships, technical support capabilities, and compliance with regional standards enable market penetration in these high-growth regions. Pool: USD 700-1,000 million.

Pathway E - Energy Storage System Applications. Grid-scale energy storage and residential battery systems require specialized assembly equipment optimized for different battery formats and production volumes. Developing flexible systems that can handle diverse energy storage applications expands the addressable market beyond automotive applications. Expected upside: USD 300-500 million.

Pathway F - Fully Automatic System Development. High-volume manufacturers require fully automated production lines with minimal human intervention. Companies developing comprehensive automation solutions with robotic integration, advanced quality control, and continuous operation capabilities will capture premium market segments focused on maximum efficiency. USD 400-650 million.

Pathway G - Consumer Electronics and Specialty Applications. Smartphones, laptops, and other consumer devices require compact, high-performance batteries with specialized assembly requirements. Machines optimized for smaller formats, higher precision, and flexible production runs serve this established but evolving market segment. Pool: USD 250-400 million.

Pathway H - Advanced Battery Technology Support. Emerging battery chemistries like solid-state batteries require specialized handling and assembly techniques. Early investment in next-generation machine capabilities for advanced battery technologies creates competitive advantages as these technologies commercialize. Expected revenue: USD 200-350 million.

Why is the Enveloping & Stacking Machine Market Growing?

Market expansion is being supported by the exponential growth of electric vehicle production and the corresponding demand for high-precision battery assembly equipment that can support large-scale lithium-ion battery manufacturing, energy storage system production, and consumer electronics applications. Modern battery manufacturers are increasingly focused on automated assembly solutions that provide consistent quality, high throughput, and process reliability while enabling cost-effective battery cell production. Enveloping & stacking machines' proven ability to deliver precision assembly, quality consistency, and production efficiency makes them essential manufacturing equipment for battery production scaling and electric mobility infrastructure development.

The growing emphasis on energy storage systems and renewable energy integration is driving demand for battery assembly equipment that can support grid-scale energy storage manufacturing and residential energy storage system production. Manufacturer preference for assembly solutions that combine precision handling with automated quality control and process optimization is creating opportunities for innovative enveloping and stacking machine implementations. The rising influence of Industry 4.0 technologies and smart manufacturing approaches is also contributing to increased adoption of machines that can provide data analytics, predictive maintenance, and integrated production monitoring capabilities.

Analyzing Enveloping and Stacking Machine Market by Leading Segments

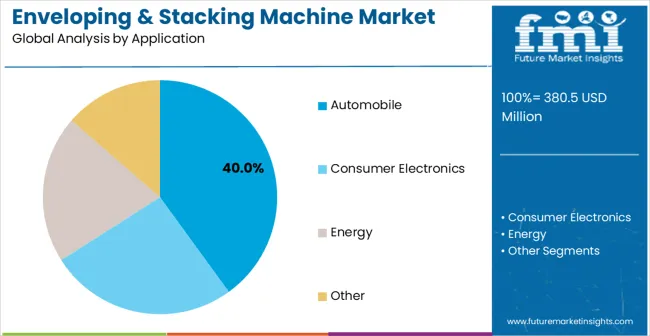
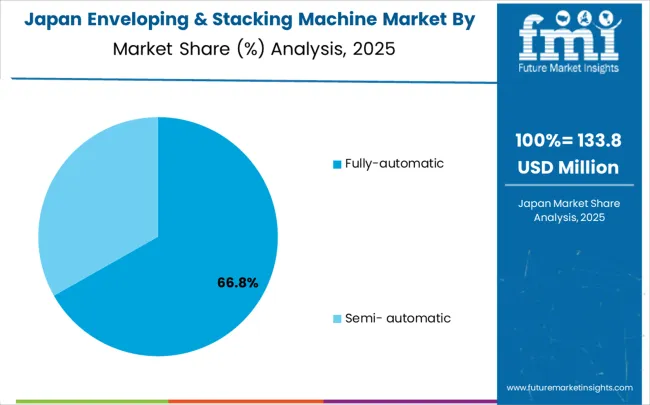
The enveloping and stacking machine market is expanding as manufacturing industries seek faster and more reliable packaging and assembly solutions. Fully automatic machines dominate the automation level segment with approximately 65% of the market share, offering cycle times of 30–60 units per minute and operational uptime above 95%. In terms of application, the automobile sector leads with around 40% of the market, driven by the need for precise component stacking, packaging, and assembly line integration. Growth is supported by rising automotive production volumes, increasing demand for automation, and the need for error-free, high-speed material handling in industrial environments.
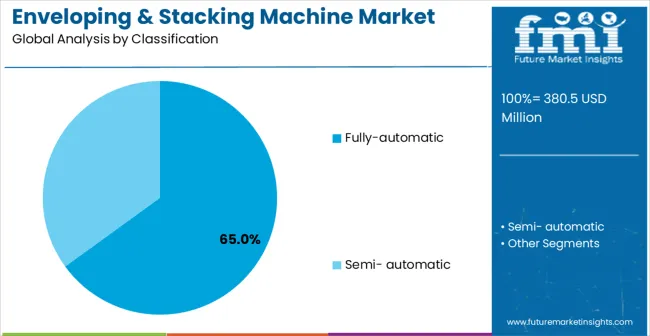
Fully Automatic Machines Lead Demand in 2025

Enveloping & Stacking Machine Market Analysis By Classification

Fully automatic enveloping and stacking machines hold roughly 65% of the automation level segment, making them the dominant choice for industrial applications. These machines typically achieve 30–60 cycles per minute with uptime exceeding 95%, and include features like integrated sensors, robotic arms, and PLC-controlled operations. Leading manufacturers include Bosch Packaging, IMA Group, Marchesini Group, and Omori Machinery. Fully automatic systems are preferred for their efficiency, reduced labor costs, and ability to handle high-volume production lines while maintaining precision and minimizing downtime.
  • Cycle times of 30–60 units per minute with operational uptime >95%
  • Equipped with PLC control, robotic arms, and integrated sensors
  • Reduces labor costs while improving throughput and process reliability

Automobile Applications Likely to Dominate Enveloping and Stacking Machine Market in 2025

Enveloping & Stacking Machine Market Analysis By Application

Automobile applications account for approximately 40% of the market, representing the largest usage segment. Machines are used for component packaging, stacking of engine parts, and assembly line integration to maintain precision and efficiency. Key suppliers such as Bosch Packaging, IMA Group, Marchesini Group, and Omori Machinery provide solutions optimized for high-speed production and heavy-duty components. Segment growth is driven by increasing global vehicle production, rising demand for automation in assembly lines, and the need for error-free handling of critical automotive components.

  • Used for component packaging, stacking, and assembly line integration
  • Optimized for high-speed production of heavy-duty automotive parts
  • Growth driven by rising vehicle production and automation adoption

What are the Drivers, Restraints, and Key Trends of the Enveloping & Stacking Machine Market?

The enveloping & stacking machine market is advancing rapidly due to accelerating electric vehicle production and increasing demand for precision battery assembly equipment that supports scalable lithium-ion battery manufacturing and energy storage system production. The market faces challenges, including high equipment development costs, technical complexities associated with precision handling and quality control systems, and specialized technical expertise requirements for machine operation and maintenance. Innovation in automation technology and quality control systems continues to influence market development and adoption patterns.

Acceleration of Electric Vehicle Production and Battery Manufacturing Scaling

The expanding electric vehicle production and advancing battery manufacturing scaling initiatives are enabling enveloping & stacking machines to support high-volume battery assembly applications where traditional manual assembly methods cannot provide the precision, consistency, and throughput required for commercial battery production. Electric vehicle growth provides enhanced market opportunities while allowing automated assembly solutions across various battery formats and production requirements. Manufacturing organizations are increasingly recognizing the competitive advantages of precision assembly equipment for battery production efficiency and electric mobility market competitiveness.

Integration of Industry 4.0 Technology and Smart Manufacturing Systems

Modern enveloping & stacking machine providers are incorporating Industry 4.0 technologies and smart manufacturing capabilities to enhance equipment appeal and address manufacturer concerns about production monitoring, quality control, and operational efficiency. These technological enhancements improve machine value while enabling new market segments, including connected manufacturing systems and predictive maintenance applications requiring real-time production data and intelligent process optimization. Advanced technology integration also allows enveloping & stacking machines to differentiate from conventional assembly equipment while supporting smart factory development and manufacturing digitalization initiatives.
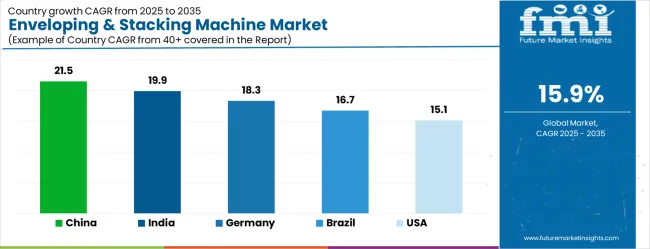
Analysis of the Enveloping & Stacking Machine Market by Key Country

Enveloping & Stacking Machine Market Cagr Analysis By Country

Country CAGR (2025-2035)
China 21.5%
India 19.9%
Germany 18.3%
Brazil 16.7%
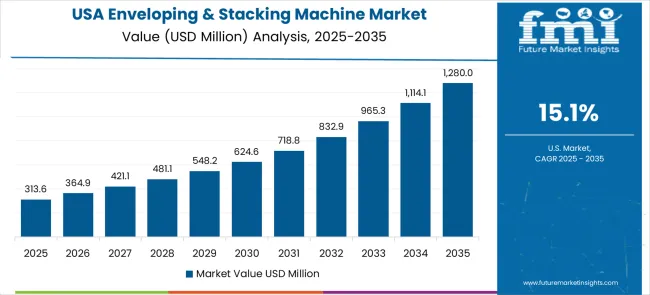
USA 15.1%
UK 13.5%
Japan 11.9%

The enveloping & stacking machine market is experiencing exceptional growth globally, with China leading at a 21.5% CAGR through 2035, driven by massive electric vehicle production expansion, comprehensive battery manufacturing infrastructure development, and extensive government support for electric mobility and energy storage technologies. India follows closely at 19.9%, supported by rapidly expanding electric vehicle adoption, increasing battery manufacturing investments, and growing focus on energy storage system development. Germany shows exceptional growth at 18.3%, prioritizing advanced manufacturing technology development and comprehensive electric mobility infrastructure programs. Brazil records 16.7%, focusing on electric vehicle market development and energy storage technology adoption. The United States shows 15.1% growth, prioritizing electric vehicle manufacturing leadership and battery production scaling. The United Kingdom demonstrates 13.5% growth, supported by electric mobility initiatives and energy storage development programs. Japan shows 11.9% growth, focus on precision manufacturing technology and battery production innovation.

Demand Forecast for Enveloping & Stacking Machine Market in China

The market for enveloping and stacking machines in China is expanding at a CAGR of 21.5%, well above the global CAGR of 15.9. Growth is driven by the rising demand for packaging automation in food, pharmaceutical, and electronics industries. Industrial zones are increasingly integrating high-speed stacking and enveloping machines to improve throughput and reduce labor dependency. Domestic manufacturers focus on precision, energy efficiency, and scalability to meet both local and export demands. Pilot installations in manufacturing clusters demonstrate reduced production downtime and improved material handling. Collaborative efforts with R&D centers further enhance operational efficiency, while suppliers invest in advanced control systems and predictive maintenance technologies.

  • Food packaging units adopt high-speed stacking machines to increase output.
  • Electronics assembly lines implement automated enveloping systems for precision.
  • Industrial clusters benefit from reduced labor dependency through automation.

Market Forecast of Enveloping & Stacking Machine Market in India

India is projected to grow at a CAGR of 19.9%, above the global CAGR of 15.9. Growth is supported by expanding pharmaceutical, food processing, and e-commerce packaging sectors. Manufacturers focus on automated enveloping and stacking solutions to reduce manual labor and improve accuracy. Industrial parks integrate advanced machines for bulk packaging and distribution. Pilot projects demonstrate faster line speeds and minimized material wastage. Suppliers emphasize reliability, scalability, and cost-effective solutions to support high-volume production. Government initiatives promoting industrial automation accelerate adoption. Collaborative efforts with local industrial hubs help refine machine design for regional production needs and environmental conditions.

  • Pharmaceutical packaging benefits from high-precision stacking machines.
  • Pilot projects improve line speed and reduce material wastage.
  • Industrial parks integrate automation to enhance overall production efficiency.

Deployment Trends of Enveloping & Stacking Machine Market in Germany

Germany grows at a CAGR of 18.3%, above the global CAGR of 15.9. Growth is fueled by high-end packaging and manufacturing sectors requiring precision and reliability. Automated enveloping and stacking machines are deployed in pharmaceutical, food, and electronics assembly lines. Suppliers focus on energy efficiency, long-term durability, and advanced control systems. Industrial collaborations drive innovation in high-speed machine design, reducing downtime and improving operational accuracy. Regulatory standards ensure quality and safety across production facilities. Adoption emphasizes integration with production planning software and multi-line packaging systems.

  • Pharmaceutical and electronics sectors implement automated stacking machines.
  • Multi-line systems improve throughput and accuracy in production.
  • Energy-efficient machines reduce operational costs over time.

Future Outlook of Enveloping & Stacking Machine Market in Brazil

The Brazilian market grows at a CAGR of 16.7%, slightly above the global CAGR of 15.9. Adoption is driven by food, beverage, and pharmaceutical industries seeking automated solutions for high-volume packaging. Industrial parks and manufacturing clusters integrate machines for consistent throughput and improved operational reliability. Suppliers provide durable, climate-adapted machines suitable for tropical conditions. Pilot installations demonstrate reduced downtime and increased material handling efficiency. Local distributors support maintenance and training services to optimize machine utilization. Collaborative efforts with industrial hubs focus on customizing machines for regional production requirements.
  • Food and beverage plants implement machines for bulk packaging efficiency.
  • Pilot installations enhance material handling and throughput.
  • Durable machines are adapted for tropical environmental conditions.

Growth Forecast of Enveloping & Stacking Machine Market in the United States

Enveloping & Stacking Machine Market Country Value Analysis

The United States grows at a CAGR of 15.1%, slightly below the global CAGR of 15.9. Slower growth is influenced by mature packaging infrastructure and extensive existing machine installations. Automated enveloping and stacking machines are used in food, pharmaceutical, and electronics production. Suppliers focus on reliability, consistency, and energy efficiency. R&D initiatives improve machine control systems and predictive maintenance. Industrial hubs adopt machines for improved workflow, reduced labor dependency, and higher line efficiency. Pilot programs demonstrate enhanced packaging precision and faster material handling in high-volume operations.

  • High-volume food production lines rely on automated stacking systems.
  • Predictive maintenance improves uptime and reduces operational costs.
  • Pilot programs validate workflow efficiency in industrial hubs.

Enveloping & Stacking Machine Market Outlook in the United Kingdom

The UK market grows at a CAGR of 13.5%, below the global CAGR of 15.9. Slower growth results from limited expansion of manufacturing facilities and reliance on imported machines. Machines are deployed in pharmaceutical, food, and electronics packaging facilities. Suppliers emphasize precision, reliability, and ease of maintenance. Pilot projects showcase improved throughput and reduced material waste in packaging operations. Industrial clusters prioritize machine integration with production scheduling systems for optimized performance. Adoption is gradually increasing in medium-sized manufacturing units and R&D centers.
  • Pharmaceutical packaging improves efficiency through automated machines.
  • Pilot installations reduce material waste and improve line throughput.
  • Medium-sized industrial clusters prioritize production optimization.

Regional Analysis of Enveloping & Stacking Machine Market in Japan

Enveloping & Stacking Machine Market Japan Market Share Analysis By Classification

Japan grows at a CAGR of 11.9%, below the global CAGR of 15.9. Slower growth is due to a mature industrial sector and high reliance on precision imports. Machines are deployed in electronics, pharmaceutical, and food packaging facilities for high-speed operations. Suppliers focus on precise, durable machines suitable for small-scale and high-value production. Pilot programs demonstrate reduced downtime, improved accuracy, and better material handling. Industrial clusters integrate machines into existing lines for enhanced workflow. R&D initiatives optimize design, energy efficiency, and multi-line integration for urban and semi-urban production facilities.
  • Electronics assembly uses machines for precision packaging.
  • Pilot programs reduce downtime and improve operational accuracy.
  • Multi-line integration enhances workflow in urban production units.

Europe Market Split by Country

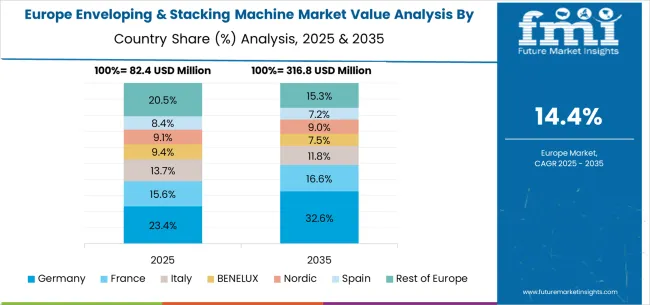
Enveloping & Stacking Machine Market Europe Country Market Share Analysis, 2025 & 2035

The enveloping & stacking machine market in Europe is projected to grow from USD 97.2 million in 2025 to USD 438.7 million by 2035, registering a CAGR of 16.2% over the forecast period. Germany is expected to maintain its leadership position with a 34.8% market share in 2025, projected to reach 36.2% by 2035, supported by its advanced automotive manufacturing capabilities and comprehensive electric vehicle production programs, including major battery manufacturing facilities in Brandenburg, Bavaria, and other automotive centers.

The United Kingdom follows with a 22.4% share in 2025, projected to reach 23.1% by 2035, driven by comprehensive electric vehicle development programs and advanced battery manufacturing initiatives in major automotive and energy storage sectors. France holds a 17.9% share in 2025, expected to reach 18.3% by 2035 due to expanding electric vehicle production and battery manufacturing technology development. Italy commands a 13.2% share, while Spain accounts for 8.1% in 2025. The Rest of Europe region is anticipated to gain momentum, expanding its collective share from 3.6% to 4.1% by 2035, attributed to increasing assembly automation adoption in Nordic countries and emerging Eastern European electric vehicle markets implementing advanced manufacturing technologies.
Competitive Landscape of the Enveloping & Stacking Machine Market

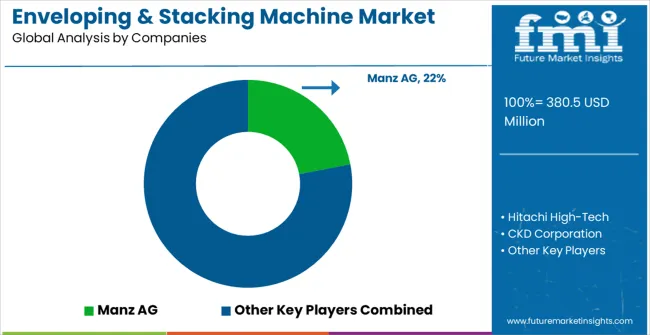
Enveloping & Stacking Machine Market Analysis By Company

The enveloping & stacking machine market is characterized by competition among established manufacturing equipment companies, specialized automation technology providers, and emerging battery production equipment developers. Companies are investing in precision handling technology development, quality control system integration, automation level enhancement, and comprehensive battery manufacturing solutions to deliver accurate, efficient, and reliable assembly systems. Innovation in handling mechanisms, process control algorithms, and integration with battery management systems is central to strengthening market position and manufacturer adoption.

Manz AG leads the market with comprehensive battery production solutions, offering advanced enveloping & stacking systems with a focus on precision assembly and manufacturing efficiency optimization. Hitachi High-Tech provides specialized automation equipment with emphasis on quality control and process reliability for battery manufacturing applications. CKD Corporation delivers innovative automation solutions with a focus on precision handling and system integration capabilities. Lead Intelligent Equipment focuses on battery manufacturing automation with emphasis on production scaling and operational efficiency.

Shenzhen Yinghe Technology specializes in battery assembly equipment with a focus on cost-effective automation solutions. Wuxi Lead Intelligent Equipment provides comprehensive battery production systems with automation technology expertise. PNT (PNT Precision) focuses on precision assembly equipment with emphasis on quality and reliability. Nagano Automation delivers specialized automation solutions with a focus on manufacturing efficiency. KUKA (via customized integration) provides industrial automation expertise with battery manufacturing applications. Hirano Tecseed and Better Technology Group contribute specialized manufacturing capabilities and technology development across various battery assembly applications.

Key Players in the Enveloping & Stacking Machine Market

  • Manz AG
  • Hitachi High-Tech
  • CKD Corporation
  • Lead Intelligent Equipment
  • Shenzhen Yinghe Technology
  • Wuxi Lead Intelligent Equipment
  • PNT (PNT Precision)
  • Nagano Automation
  • KUKA (via customized integration)
  • Hirano Tecseed
  • Better Technology Group

Scope of the Report

Items Values
Quantitative Units (2025) USD 380.5 million
Automation Level Semi-automatic, Fully automatic
Application Automobile, Consumer Electronics, Energy, Others
Regions Covered North America, Latin America, Western Europe, Eastern Europe, East Asia, South Asia & Pacific, Middle East & Africa
Countries Covered United States, Canada, United Kingdom, Germany, France, China, Japan, South Korea, Brazil, Australia and 40+ countries
Key Companies Profiled Manz AG, Hitachi High-Tech, CKD Corporation, Lead Intelligent Equipment, Shenzhen Yinghe Technology, Wuxi Lead Intelligent Equipment, PNT (PNT Precision), Nagano Automation, KUKA (via customized integration), Hirano Tecseed, Better Technology Group
Additional Attributes Dollar sales by automation level and application, regional demand trends, competitive landscape, manufacturer preferences for semi-automatic versus fully automatic systems, integration with battery production lines and quality control systems, innovations in precision handling technology and process optimization for diverse battery manufacturing applications

Enveloping & Stacking Machine Market by Segments

Automation Level:

  • Semi-automatic
  • Fully automatic

Application:

  • Automobile
  • Consumer Electronics
  • Energy
  • Others

Region:

  • North America
    • United States
    • Canada
    • Mexico
  • Europe
    • Germany
    • United Kingdom
    • France
    • Italy
    • Spain
    • Nordic
    • BENELUX
    • Rest of Europe
  • East Asia
    • China
    • Japan
    • South Korea
  • South Asia & Pacific
    • India
    • ASEAN
    • Australia & New Zealand
    • Rest of South Asia & Pacific
  • Latin America
    • Brazil
    • Chile
    • Rest of Latin America
  • Middle East & Africa
    • Kingdom of Saudi Arabia
    • Other GCC Countries
    • Turkiye
    • South Africa
    • Other African Union
    • Rest of Middle East & Africa

Table of Content

  1. Executive Summary
    • Global Market Outlook
    • Demand to side Trends
    • Supply to side Trends
    • Technology Roadmap Analysis
    • Analysis and Recommendations
  2. Market Overview
    • Market Coverage / Taxonomy
    • Market Definition / Scope / Limitations
  3. Market Background
    • Market Dynamics
      • Drivers
      • Restraints
      • Opportunity
      • Trends
    • Scenario Forecast
      • Demand in Optimistic Scenario
      • Demand in Likely Scenario
      • Demand in Conservative Scenario
    • Opportunity Map Analysis
    • Product Life Cycle Analysis
    • Supply Chain Analysis
    • Investment Feasibility Matrix
    • Value Chain Analysis
    • PESTLE and Porter’s Analysis
    • Regulatory Landscape
    • Regional Parent Market Outlook
    • Production and Consumption Statistics
    • Import and Export Statistics
  4. Global Market Analysis 2020 to 2024 and Forecast, 2025 to 2035
    • Historical Market Size Value (USD Million) Analysis, 2020 to 2024
    • Current and Future Market Size Value (USD Million) Projections, 2025 to 2035
      • Y to o to Y Growth Trend Analysis
      • Absolute $ Opportunity Analysis
  5. Global Market Pricing Analysis 2020 to 2024 and Forecast 2025 to 2035
  6. Global Market Analysis 2020 to 2024 and Forecast 2025 to 2035, By Classification
    • Introduction / Key Findings
    • Historical Market Size Value (USD Million) Analysis By Classification , 2020 to 2024
    • Current and Future Market Size Value (USD Million) Analysis and Forecast By Classification , 2025 to 2035
      • Fully-automatic
      • Semi- automatic
    • Y to o to Y Growth Trend Analysis By Classification , 2020 to 2024
    • Absolute $ Opportunity Analysis By Classification , 2025 to 2035
  7. Global Market Analysis 2020 to 2024 and Forecast 2025 to 2035, By Application
    • Introduction / Key Findings
    • Historical Market Size Value (USD Million) Analysis By Application, 2020 to 2024
    • Current and Future Market Size Value (USD Million) Analysis and Forecast By Application, 2025 to 2035
      • Automobile
      • Consumer Electronics
      • Energy
      • Other
    • Y to o to Y Growth Trend Analysis By Application, 2020 to 2024
    • Absolute $ Opportunity Analysis By Application, 2025 to 2035
  8. Global Market Analysis 2020 to 2024 and Forecast 2025 to 2035, By Region
    • Introduction
    • Historical Market Size Value (USD Million) Analysis By Region, 2020 to 2024
    • Current Market Size Value (USD Million) Analysis and Forecast By Region, 2025 to 2035
      • North America
      • Latin America
      • Western Europe
      • Eastern Europe
      • East Asia
      • South Asia and Pacific
      • Middle East & Africa
    • Market Attractiveness Analysis By Region
  9. North America Market Analysis 2020 to 2024 and Forecast 2025 to 2035, By Country
    • Historical Market Size Value (USD Million) Trend Analysis By Market Taxonomy, 2020 to 2024
    • Market Size Value (USD Million) Forecast By Market Taxonomy, 2025 to 2035
      • By Country
        • USA
        • Canada
        • Mexico
      • By Classification
      • By Application
    • Market Attractiveness Analysis
      • By Country
      • By Classification
      • By Application
    • Key Takeaways
  10. Latin America Market Analysis 2020 to 2024 and Forecast 2025 to 2035, By Country
    • Historical Market Size Value (USD Million) Trend Analysis By Market Taxonomy, 2020 to 2024
    • Market Size Value (USD Million) Forecast By Market Taxonomy, 2025 to 2035
      • By Country
        • Brazil
        • Chile
        • Rest of Latin America
      • By Classification
      • By Application
    • Market Attractiveness Analysis
      • By Country
      • By Classification
      • By Application
    • Key Takeaways
  11. Western Europe Market Analysis 2020 to 2024 and Forecast 2025 to 2035, By Country
    • Historical Market Size Value (USD Million) Trend Analysis By Market Taxonomy, 2020 to 2024
    • Market Size Value (USD Million) Forecast By Market Taxonomy, 2025 to 2035
      • By Country
        • Germany
        • UK
        • Italy
        • Spain
        • France
        • Nordic
        • BENELUX
        • Rest of Western Europe
      • By Classification
      • By Application
    • Market Attractiveness Analysis
      • By Country
      • By Classification
      • By Application
    • Key Takeaways
  12. Eastern Europe Market Analysis 2020 to 2024 and Forecast 2025 to 2035, By Country
    • Historical Market Size Value (USD Million) Trend Analysis By Market Taxonomy, 2020 to 2024
    • Market Size Value (USD Million) Forecast By Market Taxonomy, 2025 to 2035
      • By Country
        • Russia
        • Poland
        • Hungary
        • Balkan & Baltic
        • Rest of Eastern Europe
      • By Classification
      • By Application
    • Market Attractiveness Analysis
      • By Country
      • By Classification
      • By Application
    • Key Takeaways
  13. East Asia Market Analysis 2020 to 2024 and Forecast 2025 to 2035, By Country
    • Historical Market Size Value (USD Million) Trend Analysis By Market Taxonomy, 2020 to 2024
    • Market Size Value (USD Million) Forecast By Market Taxonomy, 2025 to 2035
      • By Country
        • China
        • Japan
        • South Korea
      • By Classification
      • By Application
    • Market Attractiveness Analysis
      • By Country
      • By Classification
      • By Application
    • Key Takeaways
  14. South Asia and Pacific Market Analysis 2020 to 2024 and Forecast 2025 to 2035, By Country
    • Historical Market Size Value (USD Million) Trend Analysis By Market Taxonomy, 2020 to 2024
    • Market Size Value (USD Million) Forecast By Market Taxonomy, 2025 to 2035
      • By Country
        • India
        • ASEAN
        • Australia & New Zealand
        • Rest of South Asia and Pacific
      • By Classification
      • By Application
    • Market Attractiveness Analysis
      • By Country
      • By Classification
      • By Application
    • Key Takeaways
  15. Middle East & Africa Market Analysis 2020 to 2024 and Forecast 2025 to 2035, By Country
    • Historical Market Size Value (USD Million) Trend Analysis By Market Taxonomy, 2020 to 2024
    • Market Size Value (USD Million) Forecast By Market Taxonomy, 2025 to 2035
      • By Country
        • Kingdom of Saudi Arabia
        • Other GCC Countries
        • Turkiye
        • South Africa
        • Other African Union
        • Rest of Middle East & Africa
      • By Classification
      • By Application
    • Market Attractiveness Analysis
      • By Country
      • By Classification
      • By Application
    • Key Takeaways
  16. Key Countries Market Analysis
    • USA
      • Pricing Analysis
      • Market Share Analysis, 2024
        • By Classification
        • By Application
    • Canada
      • Pricing Analysis
      • Market Share Analysis, 2024
        • By Classification
        • By Application
    • Mexico
      • Pricing Analysis
      • Market Share Analysis, 2024
        • By Classification
        • By Application
    • Brazil
      • Pricing Analysis
      • Market Share Analysis, 2024
        • By Classification
        • By Application
    • Chile
      • Pricing Analysis
      • Market Share Analysis, 2024
        • By Classification
        • By Application
    • Germany
      • Pricing Analysis
      • Market Share Analysis, 2024
        • By Classification
        • By Application
    • UK
      • Pricing Analysis
      • Market Share Analysis, 2024
        • By Classification
        • By Application
    • Italy
      • Pricing Analysis
      • Market Share Analysis, 2024
        • By Classification
        • By Application
    • Spain
      • Pricing Analysis
      • Market Share Analysis, 2024
        • By Classification
        • By Application
    • France
      • Pricing Analysis
      • Market Share Analysis, 2024
        • By Classification
        • By Application
    • India
      • Pricing Analysis
      • Market Share Analysis, 2024
        • By Classification
        • By Application
    • ASEAN
      • Pricing Analysis
      • Market Share Analysis, 2024
        • By Classification
        • By Application
    • Australia & New Zealand
      • Pricing Analysis
      • Market Share Analysis, 2024
        • By Classification
        • By Application
    • China
      • Pricing Analysis
      • Market Share Analysis, 2024
        • By Classification
        • By Application
    • Japan
      • Pricing Analysis
      • Market Share Analysis, 2024
        • By Classification
        • By Application
    • South Korea
      • Pricing Analysis
      • Market Share Analysis, 2024
        • By Classification
        • By Application
    • Russia
      • Pricing Analysis
      • Market Share Analysis, 2024
        • By Classification
        • By Application
    • Poland
      • Pricing Analysis
      • Market Share Analysis, 2024
        • By Classification
        • By Application
    • Hungary
      • Pricing Analysis
      • Market Share Analysis, 2024
        • By Classification
        • By Application
    • Kingdom of Saudi Arabia
      • Pricing Analysis
      • Market Share Analysis, 2024
        • By Classification
        • By Application
    • Turkiye
      • Pricing Analysis
      • Market Share Analysis, 2024
        • By Classification
        • By Application
    • South Africa
      • Pricing Analysis
      • Market Share Analysis, 2024
        • By Classification
        • By Application
  17. Market Structure Analysis
    • Competition Dashboard
    • Competition Benchmarking
    • Market Share Analysis of Top Players
      • By Regional
      • By Classification
      • By Application
  18. Competition Analysis
    • Competition Deep Dive
      • Manz AG
        • Overview
        • Product Portfolio
        • Profitability by Market Segments (Product/Age /Sales Channel/Region)
        • Sales Footprint
        • Strategy Overview
          • Marketing Strategy
          • Product Strategy
          • Channel Strategy
      • Hitachi High-Tech
      • CKD Corporation
      • Lead Intelligent Equipment
      • Shenzhen Yinghe Technology
      • Wuxi Lead Intelligent Equipment
      • PNT (PNT Precision)
      • Nagano Automation
      • KUKA (via customized integration)
      • Hirano Tecseed
      • Better Technology Group
  19. Assumptions & Acronyms Used
  20. Research Methodology

List of Tables

  • Table 1: Global Market Value (USD Million) Forecast by Region, 2020 to 2035
  • Table 2: Global Market Value (USD Million) Forecast by Classification , 2020 to 2035
  • Table 3: Global Market Value (USD Million) Forecast by Application, 2020 to 2035
  • Table 4: North America Market Value (USD Million) Forecast by Country, 2020 to 2035
  • Table 5: North America Market Value (USD Million) Forecast by Classification , 2020 to 2035
  • Table 6: North America Market Value (USD Million) Forecast by Application, 2020 to 2035
  • Table 7: Latin America Market Value (USD Million) Forecast by Country, 2020 to 2035
  • Table 8: Latin America Market Value (USD Million) Forecast by Classification , 2020 to 2035
  • Table 9: Latin America Market Value (USD Million) Forecast by Application, 2020 to 2035
  • Table 10: Western Europe Market Value (USD Million) Forecast by Country, 2020 to 2035
  • Table 11: Western Europe Market Value (USD Million) Forecast by Classification , 2020 to 2035
  • Table 12: Western Europe Market Value (USD Million) Forecast by Application, 2020 to 2035
  • Table 13: Eastern Europe Market Value (USD Million) Forecast by Country, 2020 to 2035
  • Table 14: Eastern Europe Market Value (USD Million) Forecast by Classification , 2020 to 2035
  • Table 15: Eastern Europe Market Value (USD Million) Forecast by Application, 2020 to 2035
  • Table 16: East Asia Market Value (USD Million) Forecast by Country, 2020 to 2035
  • Table 17: East Asia Market Value (USD Million) Forecast by Classification , 2020 to 2035
  • Table 18: East Asia Market Value (USD Million) Forecast by Application, 2020 to 2035
  • Table 19: South Asia and Pacific Market Value (USD Million) Forecast by Country, 2020 to 2035
  • Table 20: South Asia and Pacific Market Value (USD Million) Forecast by Classification , 2020 to 2035
  • Table 21: South Asia and Pacific Market Value (USD Million) Forecast by Application, 2020 to 2035
  • Table 22: Middle East & Africa Market Value (USD Million) Forecast by Country, 2020 to 2035
  • Table 23: Middle East & Africa Market Value (USD Million) Forecast by Classification , 2020 to 2035
  • Table 24: Middle East & Africa Market Value (USD Million) Forecast by Application, 2020 to 2035

List of Figures

  • Figure 1: Global Market Pricing Analysis
  • Figure 2: Global Market Value (USD Million) Forecast 2020-2035
  • Figure 3: Global Market Value Share and BPS Analysis by Classification , 2025 and 2035
  • Figure 4: Global Market Y to o to Y Growth Comparison by Classification , 2025-2035
  • Figure 5: Global Market Attractiveness Analysis by Classification
  • Figure 6: Global Market Value Share and BPS Analysis by Application, 2025 and 2035
  • Figure 7: Global Market Y to o to Y Growth Comparison by Application, 2025-2035
  • Figure 8: Global Market Attractiveness Analysis by Application
  • Figure 9: Global Market Value (USD Million) Share and BPS Analysis by Region, 2025 and 2035
  • Figure 10: Global Market Y to o to Y Growth Comparison by Region, 2025-2035
  • Figure 11: Global Market Attractiveness Analysis by Region
  • Figure 12: North America Market Incremental Dollar Opportunity, 2025-2035
  • Figure 13: Latin America Market Incremental Dollar Opportunity, 2025-2035
  • Figure 14: Western Europe Market Incremental Dollar Opportunity, 2025-2035
  • Figure 15: Eastern Europe Market Incremental Dollar Opportunity, 2025-2035
  • Figure 16: East Asia Market Incremental Dollar Opportunity, 2025-2035
  • Figure 17: South Asia and Pacific Market Incremental Dollar Opportunity, 2025-2035
  • Figure 18: Middle East & Africa Market Incremental Dollar Opportunity, 2025-2035
  • Figure 19: North America Market Value Share and BPS Analysis by Country, 2025 and 2035
  • Figure 20: North America Market Value Share and BPS Analysis by Classification , 2025 and 2035
  • Figure 21: North America Market Y to o to Y Growth Comparison by Classification , 2025-2035
  • Figure 22: North America Market Attractiveness Analysis by Classification
  • Figure 23: North America Market Value Share and BPS Analysis by Application, 2025 and 2035
  • Figure 24: North America Market Y to o to Y Growth Comparison by Application, 2025-2035
  • Figure 25: North America Market Attractiveness Analysis by Application
  • Figure 26: Latin America Market Value Share and BPS Analysis by Country, 2025 and 2035
  • Figure 27: Latin America Market Value Share and BPS Analysis by Classification , 2025 and 2035
  • Figure 28: Latin America Market Y to o to Y Growth Comparison by Classification , 2025-2035
  • Figure 29: Latin America Market Attractiveness Analysis by Classification
  • Figure 30: Latin America Market Value Share and BPS Analysis by Application, 2025 and 2035
  • Figure 31: Latin America Market Y to o to Y Growth Comparison by Application, 2025-2035
  • Figure 32: Latin America Market Attractiveness Analysis by Application
  • Figure 33: Western Europe Market Value Share and BPS Analysis by Country, 2025 and 2035
  • Figure 34: Western Europe Market Value Share and BPS Analysis by Classification , 2025 and 2035
  • Figure 35: Western Europe Market Y to o to Y Growth Comparison by Classification , 2025-2035
  • Figure 36: Western Europe Market Attractiveness Analysis by Classification
  • Figure 37: Western Europe Market Value Share and BPS Analysis by Application, 2025 and 2035
  • Figure 38: Western Europe Market Y to o to Y Growth Comparison by Application, 2025-2035
  • Figure 39: Western Europe Market Attractiveness Analysis by Application
  • Figure 40: Eastern Europe Market Value Share and BPS Analysis by Country, 2025 and 2035
  • Figure 41: Eastern Europe Market Value Share and BPS Analysis by Classification , 2025 and 2035
  • Figure 42: Eastern Europe Market Y to o to Y Growth Comparison by Classification , 2025-2035
  • Figure 43: Eastern Europe Market Attractiveness Analysis by Classification
  • Figure 44: Eastern Europe Market Value Share and BPS Analysis by Application, 2025 and 2035
  • Figure 45: Eastern Europe Market Y to o to Y Growth Comparison by Application, 2025-2035
  • Figure 46: Eastern Europe Market Attractiveness Analysis by Application
  • Figure 47: East Asia Market Value Share and BPS Analysis by Country, 2025 and 2035
  • Figure 48: East Asia Market Value Share and BPS Analysis by Classification , 2025 and 2035
  • Figure 49: East Asia Market Y to o to Y Growth Comparison by Classification , 2025-2035
  • Figure 50: East Asia Market Attractiveness Analysis by Classification
  • Figure 51: East Asia Market Value Share and BPS Analysis by Application, 2025 and 2035
  • Figure 52: East Asia Market Y to o to Y Growth Comparison by Application, 2025-2035
  • Figure 53: East Asia Market Attractiveness Analysis by Application
  • Figure 54: South Asia and Pacific Market Value Share and BPS Analysis by Country, 2025 and 2035
  • Figure 55: South Asia and Pacific Market Value Share and BPS Analysis by Classification , 2025 and 2035
  • Figure 56: South Asia and Pacific Market Y to o to Y Growth Comparison by Classification , 2025-2035
  • Figure 57: South Asia and Pacific Market Attractiveness Analysis by Classification
  • Figure 58: South Asia and Pacific Market Value Share and BPS Analysis by Application, 2025 and 2035
  • Figure 59: South Asia and Pacific Market Y to o to Y Growth Comparison by Application, 2025-2035
  • Figure 60: South Asia and Pacific Market Attractiveness Analysis by Application
  • Figure 61: Middle East & Africa Market Value Share and BPS Analysis by Country, 2025 and 2035
  • Figure 62: Middle East & Africa Market Value Share and BPS Analysis by Classification , 2025 and 2035
  • Figure 63: Middle East & Africa Market Y to o to Y Growth Comparison by Classification , 2025-2035
  • Figure 64: Middle East & Africa Market Attractiveness Analysis by Classification
  • Figure 65: Middle East & Africa Market Value Share and BPS Analysis by Application, 2025 and 2035
  • Figure 66: Middle East & Africa Market Y to o to Y Growth Comparison by Application, 2025-2035
  • Figure 67: Middle East & Africa Market Attractiveness Analysis by Application
  • Figure 68: Global Market - Tier Structure Analysis
  • Figure 69: Global Market - Company Share Analysis

Frequently Asked Questions

How big is the enveloping & stacking machine market in 2025?

The global enveloping & stacking machine market is estimated to be valued at USD 380.5 million in 2025.

What will be the size of enveloping & stacking machine market in 2035?

The market size for the enveloping & stacking machine market is projected to reach USD 1,664.3 million by 2035.

How much will be the enveloping & stacking machine market growth between 2025 and 2035?

The enveloping & stacking machine market is expected to grow at a 15.9% CAGR between 2025 and 2035.

What are the key product types in the enveloping & stacking machine market?

The key product types in enveloping & stacking machine market are fully-automatic and semi- automatic.

Which application segment to contribute significant share in the enveloping & stacking machine market in 2025?

In terms of application, automobile segment to command 40.0% share in the enveloping & stacking machine market in 2025.

Explore Similar Insights

Future Market Insights

Enveloping & Stacking Machine Market

Chat With MaRIA

Chat With

MaRIA

Hi There, I am MaRIA, Your Market Research Intelligence Assistant. How may I help you?