

- Market Size (2026)
- USD 4.0 Bn
- Forecast (2036)
- USD 25.0 Bn
- CAGR (2026 to 2036)
- 20.1%
How big is the Explainable AI Market in 2026?
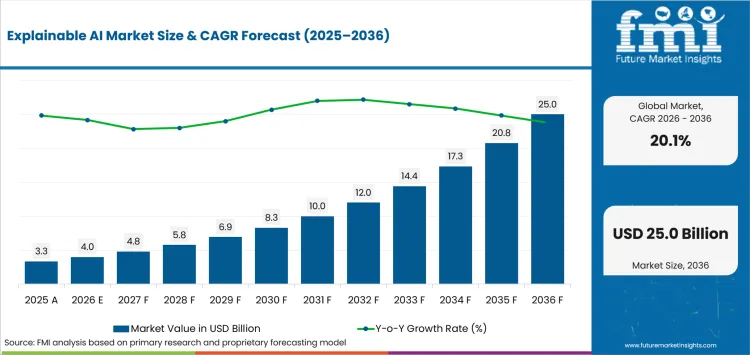
USD 4.0 billion in 2026 and USD 25.0 billion by 2036 at a 20.1% CAGR.
Demand for explainable AI is valued at USD 4.0 billion in 2026 and is projected to climb to USD 25.0 billion by 2036, expanding at a CAGR of 20.1% through the forecast period. Growth is driven by the sheer scale of AI now embedded in everyday business decisions, with Stanford HAI's April 2025 findings showing that 78% of surveyed organizations used AI during 2024, a rapid widening of the production base that is pushing explanation requirements from a compliance afterthought into a standard operating expectation. Enterprises deploying AI in lending, hiring, healthcare, and safety critical operations now need reviewable records that justify individual decisions, not just aggregate model performance metrics. Regulatory pressure compounds this shift, as frameworks in multiple regions increasingly require documented reasoning for automated decisions that affect consumers.
Restraints include the computational overhead of generating explanations for complex deep learning models and the difficulty of producing explanations that are both technically accurate and understandable to non expert reviewers. Opportunity lies in explanation as a service platforms and model agnostic tools that can be layered onto existing AI systems without retraining. Segment level activity spans software tools, professional services, and industry specific applications, with adoption pace shaped by how tightly each sector is regulated. Regionally, North America leads on regulatory maturity, while Europe follows closely behind on data protection driven demand.
Key Takeaways of Explainable AI Market
- Regulated and customer-facing decisions require reproducible explanation evidence across approval, challenge and production monitoring workflows.
- Software is projected to lead the market representing 72.0% in 2026 because integrated tools connect model outputs with governance records.
- Cloud deployment is estimated to hold 64.0% in 2026 owing to centralized logs and managed evaluation infrastructure.
- Model interpretability is forecast to capture 31.0% share in 2026 as teams examine influential inputs and recurring behavior.
- Method changes and platform transitions increase validation work as explanation outputs shift across otherwise comparable production models.
- IBM Corporation, Microsoft Corporation, Google LLC, DataRobot, Inc., FICO, SAS Institute Inc., Dataiku and Salesforce, Inc. address distinct governance requirements.
Analyst Perspective
"Review teams should first test whether an explanation can be reproduced from the exact model and data version used. Commercial value then depends on preserving that evidence chain across platform migrations and agent updates."
- Sudip Saha, Principal Consultant for Technology, Future Market Insights
How is the Explainable AI Market segmented?
The explainable AI industry is segmented by component, deployment, application, enterprise size, end use and region.
The explainable AI market covers software, services and managed services across cloud, on-premise and hybrid deployments. Applications include model interpretability, AI governance and compliance, bias detection and fairness plus fraud detection and risk analytics. Enterprise size and end use complete the taxonomy across large organizations, smaller businesses, BFSI, healthcare, technology and government or manufacturing users.
What supports software demand within the component category?
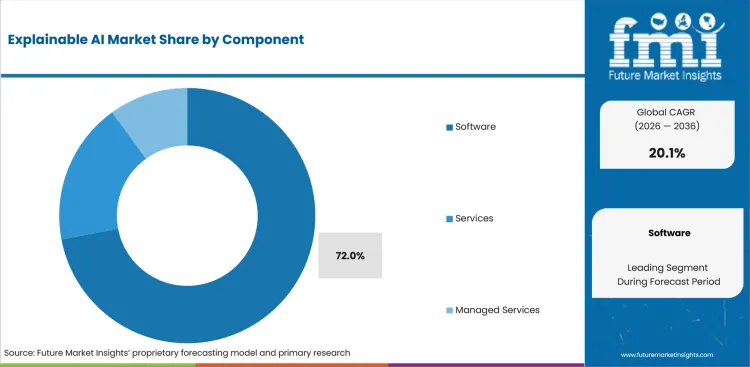
Software converts model behavior into explanation records that reviewers can reproduce across development and production. Integrated records connect feature evidence with model versions and documented approvals across large inventories. Dataiku launched 575 Lab in February 2026 to create open-source tools for agent explainability and privacy-preserving governance.
- Software is projected to hold 72.0% share in 2026 owing to integrated interpretation and governance workflows across enterprise model portfolios.
- Shared controls reduce repeated evidence work across data science platforms, although services remain necessary for teams lacking specialist validation skills and established review procedures.
How does cloud deployment influence explainable AI operations?
Cloud deployment centralizes model telemetry and governance records for distributed review teams. Managed infrastructure connects no-code AI tools with shared logs and scalable evaluation services across production environments.
- The deployment category is forecast to be led by cloud at 64.0% in 2026 owing to lower integration effort across distributed operations.
- Google added built-in performance monitoring for Vertex AI Model Garden in March 2025, allowing teams to track model quality inside the deployment environment. Data-residency rules preserve on-premise and hybrid demand for sensitive workloads that cannot use shared public infrastructure.
Why does model interpretability lead the application category?
Model interpretability identifies influential inputs and recurring behavior across trained systems during technical review and production monitoring. Google described LLM Comparator in March 2025 as an explainable tool that summarizes evaluation rationales for model comparisons. Review teams use those summaries to test explanation stability across production releases and deep learning systems.
- In 2026, model interpretability is expected to lead application with 31.0% share owing to demand for local and global explanations.
- Local methods examine individual outputs, whereas global analysis helps automated machine learning teams distinguish recurring behavior from data drift or quality problems.
What makes BFSI central to end-use demand?
Banks and insurers apply predictive models to credit and fraud decisions that affect customers or balance-sheet exposure. Reviewable outputs support refund fraud detection and investigations requiring traceable evidence across operating and control teams. Formal validation assigns ownership and challenge routes across regulated portfolios with different risk thresholds and approval procedures.
- Based on end use, BFSI is projected to account for 24.0% in 2026 due to review requirements across customer and risk decisions.
- Model owners must separate influential variables from unstable data, yet legacy systems complicate integration and preservation of earlier audit histories.
What are the drivers, restraints and opportunities in the Explainable AI Market?
Accountability duties increase demand, method variability raises validation costs and unified records support migration services.
- Driver: Transparency duties and internal model controls require reproducible evidence across regulated or customer-facing AI decisions.
- Restraint: Method and model-version differences increase validation effort during platform transitions and production release changes.
- Opportunity: Unified governance records connect explanations with fairness reviews, approvals and production outcomes for each model version.
Demand for explainable AI solutions is increasing as healthcare organizations strengthen compliance and model governance capabilities. Supporting this trend, the European Commission published Article 50 guidance in July 2026 outlining transparency obligations effective from 2 August 2026. The requirements encourage clinical AI governance teams to maintain version-controlled records that trace outputs to accountable stakeholders and support regulatory oversight.
Different explanation methods can assign conflicting importance to identical inputs even if the underlying prediction remains unchanged. Teams assessing deepfake detection tools must preserve model and data versions during replacement to control revalidation costs.
Versioned data governance records connect explanations with fairness tests, approvals and production outcomes across one review history. Providers can sell migration support and ongoing control maintenance across mixed cloud and on-premise environments.
Which country CAGRs are profiled in the Explainable AI Market?
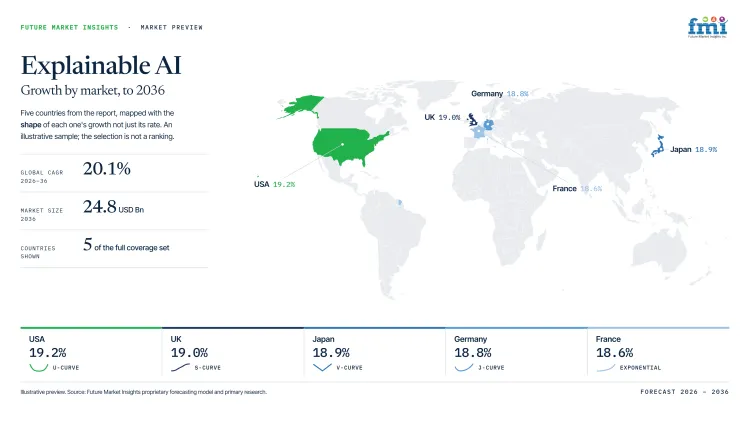
| Country | CAGR |
|---|---|
| United States | 19.2% |
| United Kingdom | 19.0% |
| Japan | 18.9% |
| Germany | 18.8% |
| France | 18.6% |
How do country-level CAGRs compare in the Explainable AI Market?
The five profiled CAGRs span 0.6 percentage points across different regulatory systems and enterprise adoption levels. CAGR measures forecast pace and does not automatically represent current market size or installed software use.
- The United States combines broad cloud access with regulated model portfolios requiring formal internal review and documentation.
- The United Kingdom pairs public-sector transparency practices with accessible enterprise cloud services and specialist consulting routes.
- Japan reflects domestic systems integration with localized explanation demand across manufacturing and financial applications.
- Germany links industrial software expertise with European compliance duties across multilingual operating environments and distributed sites.
- France combines active data-protection oversight with consulting support for customer-facing and administrative AI systems.
Comparable CAGRs can produce different market entry conditions. The full report provides country-level CAGR analysis across North America, Latin America, Europe, East Asia, South Asia and Pacific, and the Middle East and Africa.
Country-wise Analysis
- United States enterprises obtain explainability platforms from major cloud regions and systems integrators serving finance, healthcare and public agencies under established security reviews with contract support for complex regulated model portfolios across metropolitan and regional networks nationwide. The Census Bureau reported in May 2026 that 37% of firms with at least 250 employees used AI, broadening the number of large organizations that must document decisions across regulated operations. The United States is estimated to post 19.2% CAGR over the forecast period as mature validation programs support orders, although legacy inventories increase integration costs and prolong documentation work across nationwide deployments.
- United Kingdom organizations obtain explanation software from global cloud platforms and domestic consultancies serving financial institutions, government departments and technology businesses under established assurance procedures with nationwide support for customer-facing and public-sector model portfolios. The Office for National Statistics reported in July 2026 that 49% of businesses with at least 250 employees used AI, expanding the addressable base for structured transparency records across regulated decisions. The United Kingdom's explainable AI outlook is anticipated to advance at 19.0% CAGR over the assessment period as subscription access supports orders, yet scarce specialists increase implementation costs outside established digital hubs and major public bodies.
- Japanese enterprises combine domestic systems integrators with global cloud providers for manufacturing, finance and customer operations that require localized documentation across major commercial centers and regional service networks supporting complex enterprise model portfolios and acquisition reviews nationwide. An IPA survey published in June 2026 covered 2,000 respondents across company sizes and industries, documenting national expectations for explanations during technology planning and acquisition reviews. Explainable AI demand in Japan is forecast to rise at 18.9% CAGR over the forecast period as governance programs support orders. Specialist shortages and older systems restrict implementation beyond metropolitan networks and established technology clusters nationwide.
- Explainable AI sales in Germany are forecast to expand at 18.8% CAGR by 2036 as engineering expertise supports orders. German enterprises use industrial software specialists and regional integrators across manufacturing, finance and public services that operate multilingual model inventories at distributed sites under established security procedures and European compliance requirements across complex multinational operations nationwide. Bundesnetzagentur reported in July 2025 that nearly 30% of surveyed companies used AI and another 19% planned adoption, expanding demand for reviewable controls across industrial and customer-facing applications.
- French organizations obtain explainability tools from national consultancies and major cloud regions serving finance, public administration and customer operations under active data-protection oversight with implementation support across metropolitan and regional service networks. Insee reported in July 2026 that 58% of businesses with at least 250 employees used AI and 54% of nonusers cited insufficient expertise, increasing reliance on external specialists for regulated implementation and audits. The French explainable AI sector is projected to record 18.6% CAGR during the assessment period as large-company adoption supports orders, although higher implementation costs constrain smaller organizations and public bodies outside major metropolitan centers nationwide.
Who are the notable companies in the Explainable AI Market?
IBM Corporation, Microsoft Corporation, Google LLC, DataRobot, Inc., FICO, SAS Institute Inc., Dataiku and Salesforce, Inc. are the notable companies serving this market.
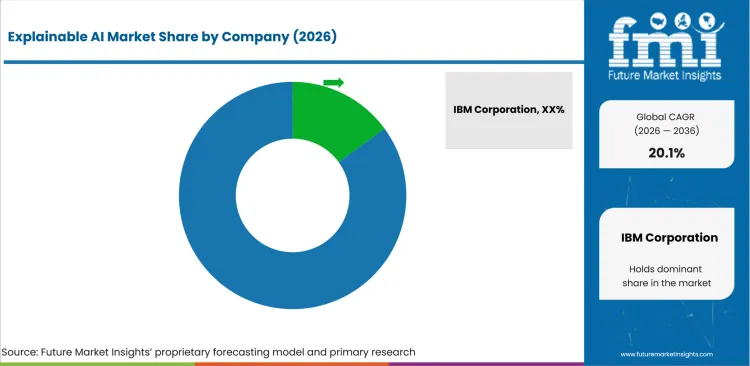
The field is moderately concentrated around enterprise AI suites, although specialists compete on governance depth and deployment flexibility. Entry requires integration with model registries, audit workflows and connected AI systems instead of a standalone visualization feature.
- IBM Corporation, Microsoft Corporation and Google LLC combine evaluation or governance functions with broader enterprise cloud environments.
- DataRobot, Inc., FICO, SAS Institute Inc. and Dataiku compete on decision governance, model monitoring and fairness controls for regulated workflows.
- Salesforce, Inc. embeds explainability and governance controls within customer-facing applications and agent workflows using governed enterprise data.
Competitive Benchmarking: Explainable AI Market
| Company | Explanation Coverage | Lifecycle Controls | Production Monitoring | Geographic Reach |
|---|---|---|---|---|
| IBM Corporation | Medium | High | High | Global hybrid cloud |
| Microsoft Corporation | Medium | Medium | Medium | Global enterprise programs |
| Google LLC | Medium | Medium | High | Hybrid and multi-cloud |
| DataRobot, Inc. | Medium | High | High | Cloud to air-gapped |
| FICO | High | Medium | Medium | Global decision platform |
| SAS Institute Inc. | Medium | High | High | Global enterprise platform |
| Dataiku | Medium | High | High | Global enterprise customers |
| Salesforce, Inc. | Medium | High | High | Global Salesforce cloud |
Key Developments in the Explainable AI Market
- In July 2025, DataRobot launched its Agent Workforce Platform, co-engineered with NVIDIA, enabling organizations to build, operate and govern AI agents across cloud, on-premise, hybrid and air-gapped environments.
- In March 2026, Dataiku launched Kiji Inspector to explain enterprise AI agent tool choices using traceable model signals.
- In June 2025, IBM introduced software unifying agentic AI governance and security with shared controls and automated compliance workflows.
Key Players in the Explainable AI Market
Enterprise AI and Cloud Platforms
- IBM Corporation
- Microsoft Corporation
- Google LLC
- Salesforce, Inc.
Decision Governance Specialists
- DataRobot, Inc.
- FICO
Analytics and Model Management Platforms
- SAS Institute Inc.
- Dataiku
Explainable AI Market - Report Scope
| Coverage field | Report scope |
|---|---|
| Market breakdown | By component, deployment, application, enterprise size, end use and region. |
| Quantitative Units | Revenue in USD billion and CAGR in %. |
| Market Definition | Software, services and managed services supporting model interpretation, fairness assessment, governance evidence and production monitoring. |
| Regions Covered | North America, Latin America, Europe, East Asia, South Asia and Pacific, and Middle East and Africa. |
| Countries Covered | United States, United Kingdom, Japan, Germany, France, and 20+ countries included in the full report. |
| Key Companies Profiled | IBM Corporation, Microsoft Corporation, Google LLC, DataRobot, Inc., FICO, SAS Institute Inc., Dataiku and Salesforce, Inc. |
| Forecast Period | 2026 to 2036. |
| Approach | Primary and secondary research with market triangulation. |
Explainable AI Market - Research Methodology
| Method | Approach |
|---|---|
| Primary Research | FMI analysts gathered input from manufacturers, service providers, technology developers, distributors, end users, procurement teams, and subject-matter experts. Interviews examined purchasing decisions, product or service evaluation, adoption barriers, approval requirements, pricing considerations, and expectations for technical or commercial support. Respondents were also asked what evidence is required before a trial, pilot, or initial order develops into regular purchasing. |
| Desk Research | Desk research covered government statistics, regulatory publications, trade data, industry associations, technical literature, standards, company filings, product information, and official corporate announcements. Sources were reviewed for relevance, publication date, geographic coverage, and consistency with the defined market scope. Claims relating to performance, applications, approvals, capacity, investment, and commercial activity were retained only when supported by credible public evidence. |
| Market Sizing and Forecasting | The market model combined the baseline value with historical performance, segment structure, pricing and volume indicators, adoption levels, company participation, and country-level demand conditions. Forecast assumptions considered economic activity, investment trends, regulatory developments, technology adoption, purchasing cycles, supply availability, and barriers to wider market use. Segment and regional estimates were reconciled before the final market total was calculated. |
| Data Validation | Estimates were checked against multiple independent indicators, including public data, company activity, trade patterns, industry developments, and findings from primary interviews. Validation also tested whether products, services, applications, and company revenues fell within the defined market boundaries. Adjacent categories, unsupported claims, overlapping revenues, and activities without direct market relevance were excluded to reduce double counting and maintain consistency across segments and countries. |
Explainable AI Market by Segments
Explainable AI Market segmented by Component:
- Software
- Model Interpretation Platforms
- AI Governance Software
- Bias Detection & Monitoring Tools
- Services
- Consulting Services
- Implementation & Integration
- Training & Support
- Managed Services
- AI Model Monitoring
- Compliance Management
- Model Lifecycle Management
Explainable AI Market segmented by Deployment:
- Cloud
- Public Cloud
- Private Cloud
- Hybrid Cloud
- On-premise
- Enterprise Data Centers
- Private Infrastructure
- Edge AI Deployment
- Hybrid Deployment
- Multi-cloud
- Containerized AI
- Distributed AI Platforms
Explainable AI Market segmented by Application:
- Model Interpretability
- Feature Importance Analysis
- Local Explanation Models
- Global Explanation Models
- AI Governance & Compliance
- Regulatory Compliance
- Model Auditing
- Risk Management
- Bias Detection & Fairness
- Algorithmic Fairness
- Bias Monitoring
- Ethical AI Validation
- Fraud Detection & Risk Analytics
- Financial Fraud Detection
- Cybersecurity Analytics
- Insurance Risk Assessment
Explainable AI Market segmented by Enterprise Size:
- Large Enterprises
- Multinational Enterprises
- Public Sector Organizations
- Fortune 1000 Companies
- Small & Medium Enterprises
- Mid-sized Businesses
- Small Businesses
- AI Startups
Explainable AI Market segmented by End Use:
- BFSI
- Banking
- Insurance
- Capital Markets
- Healthcare
- Clinical Decision Support
- Medical Imaging AI
- Drug Discovery
- IT & Telecommunications
- Cloud Service Providers
- Software Companies
- Telecommunication Operators
- Government & Manufacturing
- Public Administration
- Defense
- Industrial Automation
Explainable AI Market by Region:
- North America
- United States
- Canada
- Mexico
- Latin America
- Brazil
- Chile
- Rest of Latin America
- Western Europe
- Germany
- United Kingdom
- Italy
- Spain
- France
- Nordics
- Benelux
- Rest of Western Europe
- Eastern Europe
- Russia
- Poland
- Hungary
- Balkan and Baltic States
- Rest of Eastern Europe
- East Asia
- China
- Japan
- South Korea
- South Asia and Pacific
- India
- ASEAN
- Australia and New Zealand
- Rest of South Asia and Pacific
- Middle East and Africa
- Kingdom of Saudi Arabia
- Other GCC Countries
- Türkiye
- South Africa
- Other African Union Countries
- Rest of Middle East and Africa
Research Sources and Bibliography
- Stanford Institute for Human-Centered Artificial Intelligence. (2025, April 7). AI Index 2025: State of AI in 10 Charts.
- Eurostat. (2025, December 11). 20% of EU enterprises use AI technologies.
- Dataiku. (2026, February 18). Dataiku Launches 575 Lab, Its New Open Source Initiative for Responsible AI.
- Brea, K., & Barkley, W. (2025, March 7). Introducing built-in performance monitoring for Vertex AI Model Garden. Google Cloud.
- Kim, J., & Woo, W. (2025, March 1). Evaluate gen AI models with Vertex AI evaluation service and LLM comparator. Google Cloud.
- European Commission. (2026, July 20). Guidelines on transparency obligations for providers and deployers of AI systems.
- Grundy, A., Breaux, C., & Khatiwoda, D. (2026, May 26). Large Firms with at Least 20 Employees Biggest AI Users. USA Census Bureau.
- Office for National Statistics. (2026, July 2). Business insights and impact on the UK economy: 2 July 2026.
- Information-technology Promotion Agency, Japan. (2026, June 1). IPA Technical Watch: Survey on explaining AI behavior, analysis and use.
- Bundesnetzagentur. (2025, July 16). KI in Unternehmen: Einsatz, Ressourcen und Herausforderungen.
- Lefebvre, C. (2026, July 21). Information and communication technologies in businesses in 2025. Insee.
- IBM. (2025, January 22). e& Collaborates with IBM to Launch an End-to-End AI Governance Platform.
- Arenas, Y. (2025, August 27). Agent Factory: Top 5 agent observability best practices for reliable AI. Microsoft Azure.
- DataRobot. (2025, July 31). DataRobot Announces Agent Workforce Platform Built with NVIDIA..
- FICO. (2025, March 4). FICO Announces 12 New Patents Advancing Responsible AI and Machine Learning.
- SAS Institute Inc. (2025, May 7). SAS Unveils AI Agents with Customizable Human-AI Interaction for Transparent Decisioning.
- Salesforce. (2025, October 2). Salesforce Unveils the Foundation for Building Trusted AI.
- Dataiku. (2026, March 16). Dataiku Launches Kiji Inspector.
- IBM. (2025, June 18). IBM Introduces Industry-First Software to Unify Agentic Governance and Security.
- Dataiku. (2026, March 9). Dataiku Launches the Platform for AI Success.
This bibliography is provided for reader reference and is not exhaustive. The full report contains the complete reference list and detailed citations.
This Report Answers
- How large is the explainable AI market in 2026 and 2036?
- Which operating conditions support accountable explainable AI workflows?
- Why does software hold the largest component share?
- How does cloud deployment shape explanation operations?
- Why does model interpretability remain central to enterprise review?
- How do the profiled country growth rates compare?
- Which companies provide explainability and decision-governance capabilities?
- Which restraints slow adoption across changing model environments?
Frequently Asked Questions
How big is the Explainable AI Market in 2026?
The explainable AI market is valued at USD 4.0 billion in 2026 and is expected to reach USD 25.0 billion by 2036. Growth is driven by increasing demand for transparent, auditable, and compliant AI systems across regulated industries.
What is the CAGR of the Explainable AI Market from 2026 to 2036?
The explainable AI market is projected to grow at a CAGR of 20.1% between 2026 and 2036. Organizations are increasingly adopting explainable AI tools to improve model transparency, governance, and decision-making accountability.
Which component is projected to account for 72.0% of the Explainable AI Market?
The software segment is expected to account for 72.0% share in 2026. Its dominance is supported by the growing use of platforms that provide model interpretation and governance capabilities.
Which deployment segment is projected to account for 64.0% of the Explainable AI Market?
The cloud deployment segment is projected to hold a 64.0% share of the Explainable AI Market in 2026. Cloud-based solutions are preferred for their scalability, centralized management, and ability to support enterprise-wide AI governance initiatives.
Which companies are profiled in the Explainable AI Market?
Companies in the Explainable AI Market includes IBM Corporation, Microsoft Corporation, Google LLC, DataRobot, Inc., FICO, SAS Institute Inc., Dataiku and Salesforce, Inc.
Preview the report firsthand - request a free sample
Get SampleGet the brochure for pricing and purchase details.
Get PDFTable of Content
- Key Takeaways
- Market Size and CAGR
- Top Growth Driver
- Fastest Growing Segment
- Leading Region
- Key Companies
- Emerging Opportunities
- Executive Summary
- Global Market Outlook
- Demand-side Trends
- Supply-side Trends
- Technology Roadmap Analysis
- Analysis and Recommendations
- Analyst Perspective (What is happening? Why now? What should investors know?)
- Key Questions Answered
- How large is the market?
- What is the CAGR?
- What are key trends?
- Which region dominates?
- Who are the leaders?
- Market Overview
- Market Coverage / Taxonomy
- Market Definition / Scope / Limitations
- Research Methodology
- Chapter Orientation
- Analytical Lens and Working Hypotheses
- Market Structure, Signals, and Trend Drivers
- Benchmarking and Cross-market Comparability
- Market Sizing, Forecasting, and Opportunity Mapping
- Research Design and Evidence Framework
- Desk Research Programme (Secondary Evidence)
- Expert Input and Fieldwork (Primary Evidence)
- Tooling, Models, and Reference Databases
- Data Engineering and Model Build
- Quality Assurance and Audit Trail
- Market Background
- Market Dynamics (Drivers, Restraints, Opportunity, Trends)
- Scenario Forecast (Optimistic, Likely, Conservative)
- Impact Analysis
- AI Impact
- Sustainability Impact
- Regulatory Impact
- Technology Impact
- Consumer / Buyer Analysis
- Purchase Drivers
- Adoption Barriers
- Buyer Journey
- Opportunity Map Analysis
- Product Life Cycle Analysis
- Supply Chain Analysis
- Investment Feasibility Matrix
- Value Chain Analysis
- PESTLE and Porter's Analysis
- Regulatory Landscape
- Regional Parent Market Outlook
- Production and Consumption Statistics
- Import and Export Statistics
- Global Market Analysis and Forecast, 2021 to 2036
- Historical Market Size Value (USD Billion) Analysis, 2021 to 2025
- Current and Future Market Size Value (USD Billion) Projections, 2026 to 2036
- Y-o-Y Growth Trend Analysis
- Absolute $ Opportunity Analysis
- Global Market Pricing Analysis, 2021 to 2036
- Global Market Analysis and Forecast, By Component, 2021 to 2036
- Introduction / Key Findings
- Historical Market Size Value (USD Billion) Analysis By Component, 2021 to 2025
- Current and Future Market Size Value (USD Billion) Analysis and Forecast By Component, 2026 to 2036
- Software
- Model Interpretation Platforms
- AI Governance Software
- Bias Detection & Monitoring Tools
- Services
- Consulting Services
- Implementation & Integration
- Training & Support
- Managed Services
- AI Model Monitoring
- Compliance Management
- Model Lifecycle Management
- Software
- Y-o-Y Growth Trend Analysis By Component, 2021 to 2025
- Absolute $ Opportunity Analysis By Component, 2026 to 2036
- Global Market Analysis and Forecast, By Deployment, 2021 to 2036
- Introduction / Key Findings
- Historical Market Size Value (USD Billion) Analysis By Deployment, 2021 to 2025
- Current and Future Market Size Value (USD Billion) Analysis and Forecast By Deployment, 2026 to 2036
- Cloud
- Public Cloud
- Private Cloud
- Hybrid Cloud
- On-premise
- Enterprise Data Centers
- Private Infrastructure
- Edge AI Deployment
- Hybrid Deployment
- Multi-cloud
- Containerized AI
- Distributed AI Platforms
- Cloud
- Y-o-Y Growth Trend Analysis By Deployment, 2021 to 2025
- Absolute $ Opportunity Analysis By Deployment, 2026 to 2036
- Global Market Analysis and Forecast, By Application, 2021 to 2036
- Introduction / Key Findings
- Historical Market Size Value (USD Billion) Analysis By Application, 2021 to 2025
- Current and Future Market Size Value (USD Billion) Analysis and Forecast By Application, 2026 to 2036
- Model Interpretability
- Feature Importance Analysis
- Local Explanation Models
- Global Explanation Models
- AI Governance & Compliance
- Regulatory Compliance
- Model Auditing
- Risk Management
- Bias Detection & Fairness
- Algorithmic Fairness
- Bias Monitoring
- Ethical AI Validation
- Fraud Detection & Risk Analytics
- Financial Fraud Detection
- Cybersecurity Analytics
- Insurance Risk Assessment
- Model Interpretability
- Y-o-Y Growth Trend Analysis By Application, 2021 to 2025
- Absolute $ Opportunity Analysis By Application, 2026 to 2036
- Global Market Analysis and Forecast, By Enterprise Size, 2021 to 2036
- Introduction / Key Findings
- Historical Market Size Value (USD Billion) Analysis By Enterprise Size, 2021 to 2025
- Current and Future Market Size Value (USD Billion) Analysis and Forecast By Enterprise Size, 2026 to 2036
- Large Enterprises
- Multinational Enterprises
- Public Sector Organizations
- Fortune 1000 Companies
- Small & Medium Enterprises
- Mid-sized Businesses
- Small Businesses
- AI Startups
- Large Enterprises
- Y-o-Y Growth Trend Analysis By Enterprise Size, 2021 to 2025
- Absolute $ Opportunity Analysis By Enterprise Size, 2026 to 2036
- Global Market Analysis and Forecast, By End Use, 2021 to 2036
- Introduction / Key Findings
- Historical Market Size Value (USD Billion) Analysis By End Use, 2021 to 2025
- Current and Future Market Size Value (USD Billion) Analysis and Forecast By End Use, 2026 to 2036
- BFSI
- Banking
- Insurance
- Capital Markets
- Healthcare
- Clinical Decision Support
- Medical Imaging AI
- Drug Discovery
- IT & Telecommunications
- Cloud Service Providers
- Software Companies
- Telecommunication Operators
- Government & Manufacturing
- Public Administration
- Defense
- Industrial Automation
- BFSI
- Y-o-Y Growth Trend Analysis By End Use, 2021 to 2025
- Absolute $ Opportunity Analysis By End Use, 2026 to 2036
- Global Market Analysis and Forecast, By Region, 2021 to 2036
- Introduction
- Historical Market Size Value (USD Billion) Analysis By Region, 2021 to 2025
- Current Market Size Value (USD Billion) Analysis and Forecast By Region, 2026 to 2036
- North America
- Latin America
- Western Europe
- Eastern Europe
- East Asia
- South Asia and Pacific
- Middle East & Africa
- Market Attractiveness Analysis By Region
- North America Market Analysis and Forecast, By Country, 2021 to 2036
- Historical Market Size Value (USD Billion) Trend Analysis By Market Taxonomy, 2021 to 2025
- Market Size Value (USD Billion) Forecast By Market Taxonomy, 2026 to 2036
- By Country
- USA
- Canada
- By Component
- By Deployment
- By Application
- By Enterprise Size
- By End Use
- By Country
- Market Attractiveness Analysis
- By Country
- By Component
- By Deployment
- By Application
- By Enterprise Size
- By End Use
- Key Takeaways
- Latin America Market Analysis and Forecast, By Country
- Historical Market Size Value (USD Billion) Trend Analysis By Market Taxonomy, 2021 to 2025
- Market Size Value (USD Billion) Forecast By Market Taxonomy, 2026 to 2036
- By Country
- Brazil
- Mexico
- Chile
- Rest of Latin America
- By Component
- By Deployment
- By Application
- By Enterprise Size
- By End Use
- By Country
- Market Attractiveness Analysis
- By Country
- By Component
- By Deployment
- By Application
- By Enterprise Size
- By End Use
- Key Takeaways
- Western Europe Market Analysis and Forecast, By Country
- Historical Market Size Value (USD Billion) Trend Analysis By Market Taxonomy, 2021 to 2025
- Market Size Value (USD Billion) Forecast By Market Taxonomy, 2026 to 2036
- By Country
- Germany
- UK
- Italy
- Spain
- France
- Nordic
- BENELUX
- Rest of Western Europe
- By Component
- By Deployment
- By Application
- By Enterprise Size
- By End Use
- By Country
- Market Attractiveness Analysis
- By Country
- By Component
- By Deployment
- By Application
- By Enterprise Size
- By End Use
- Key Takeaways
- Eastern Europe Market Analysis and Forecast, By Country
- Historical Market Size Value (USD Billion) Trend Analysis By Market Taxonomy, 2021 to 2025
- Market Size Value (USD Billion) Forecast By Market Taxonomy, 2026 to 2036
- By Country
- Russia
- Poland
- Hungary
- Balkan & Baltic
- Rest of Eastern Europe
- By Component
- By Deployment
- By Application
- By Enterprise Size
- By End Use
- By Country
- Market Attractiveness Analysis
- By Country
- By Component
- By Deployment
- By Application
- By Enterprise Size
- By End Use
- Key Takeaways
- East Asia Market Analysis and Forecast, By Country
- Historical Market Size Value (USD Billion) Trend Analysis By Market Taxonomy, 2021 to 2025
- Market Size Value (USD Billion) Forecast By Market Taxonomy, 2026 to 2036
- By Country
- China
- Japan
- South Korea
- By Component
- By Deployment
- By Application
- By Enterprise Size
- By End Use
- By Country
- Market Attractiveness Analysis
- By Country
- By Component
- By Deployment
- By Application
- By Enterprise Size
- By End Use
- Key Takeaways
- South Asia and Pacific Market Analysis and Forecast, By Country
- Historical Market Size Value (USD Billion) Trend Analysis By Market Taxonomy, 2021 to 2025
- Market Size Value (USD Billion) Forecast By Market Taxonomy, 2026 to 2036
- By Country
- India
- ASEAN
- Australia & New Zealand
- Rest of South Asia and Pacific
- By Component
- By Deployment
- By Application
- By Enterprise Size
- By End Use
- By Country
- Market Attractiveness Analysis
- By Country
- By Component
- By Deployment
- By Application
- By Enterprise Size
- By End Use
- Key Takeaways
- Middle East & Africa Market Analysis and Forecast, By Country
- Historical Market Size Value (USD Billion) Trend Analysis By Market Taxonomy, 2021 to 2025
- Market Size Value (USD Billion) Forecast By Market Taxonomy, 2026 to 2036
- By Country
- Kingdom of Saudi Arabia
- Other GCC Countries
- Türkiye
- South Africa
- Other African Union
- Rest of Middle East & Africa
- By Component
- By Deployment
- By Application
- By Enterprise Size
- By End Use
- By Country
- Market Attractiveness Analysis
- By Country
- By Component
- By Deployment
- By Application
- By Enterprise Size
- By End Use
- Key Takeaways
- Key Countries Market Analysis
- USA
- Pricing Analysis
- Market Share Analysis, 2025
- By Component
- By Deployment
- By Application
- By Enterprise Size
- By End Use
- Canada
- Pricing Analysis
- Market Share Analysis, 2025
- By Component
- By Deployment
- By Application
- By Enterprise Size
- By End Use
- Mexico
- Pricing Analysis
- Market Share Analysis, 2025
- By Component
- By Deployment
- By Application
- By Enterprise Size
- By End Use
- Brazil
- Pricing Analysis
- Market Share Analysis, 2025
- By Component
- By Deployment
- By Application
- By Enterprise Size
- By End Use
- Chile
- Pricing Analysis
- Market Share Analysis, 2025
- By Component
- By Deployment
- By Application
- By Enterprise Size
- By End Use
- Germany
- Pricing Analysis
- Market Share Analysis, 2025
- By Component
- By Deployment
- By Application
- By Enterprise Size
- By End Use
- UK
- Pricing Analysis
- Market Share Analysis, 2025
- By Component
- By Deployment
- By Application
- By Enterprise Size
- By End Use
- Italy
- Pricing Analysis
- Market Share Analysis, 2025
- By Component
- By Deployment
- By Application
- By Enterprise Size
- By End Use
- Spain
- Pricing Analysis
- Market Share Analysis, 2025
- By Component
- By Deployment
- By Application
- By Enterprise Size
- By End Use
- France
- Pricing Analysis
- Market Share Analysis, 2025
- By Component
- By Deployment
- By Application
- By Enterprise Size
- By End Use
- India
- Pricing Analysis
- Market Share Analysis, 2025
- By Component
- By Deployment
- By Application
- By Enterprise Size
- By End Use
- ASEAN
- Pricing Analysis
- Market Share Analysis, 2025
- By Component
- By Deployment
- By Application
- By Enterprise Size
- By End Use
- Australia & New Zealand
- Pricing Analysis
- Market Share Analysis, 2025
- By Component
- By Deployment
- By Application
- By Enterprise Size
- By End Use
- China
- Pricing Analysis
- Market Share Analysis, 2025
- By Component
- By Deployment
- By Application
- By Enterprise Size
- By End Use
- Japan
- Pricing Analysis
- Market Share Analysis, 2025
- By Component
- By Deployment
- By Application
- By Enterprise Size
- By End Use
- South Korea
- Pricing Analysis
- Market Share Analysis, 2025
- By Component
- By Deployment
- By Application
- By Enterprise Size
- By End Use
- Russia
- Pricing Analysis
- Market Share Analysis, 2025
- By Component
- By Deployment
- By Application
- By Enterprise Size
- By End Use
- Poland
- Pricing Analysis
- Market Share Analysis, 2025
- By Component
- By Deployment
- By Application
- By Enterprise Size
- By End Use
- Hungary
- Pricing Analysis
- Market Share Analysis, 2025
- By Component
- By Deployment
- By Application
- By Enterprise Size
- By End Use
- Kingdom of Saudi Arabia
- Pricing Analysis
- Market Share Analysis, 2025
- By Component
- By Deployment
- By Application
- By Enterprise Size
- By End Use
- Türkiye
- Pricing Analysis
- Market Share Analysis, 2025
- By Component
- By Deployment
- By Application
- By Enterprise Size
- By End Use
- South Africa
- Pricing Analysis
- Market Share Analysis, 2025
- By Component
- By Deployment
- By Application
- By Enterprise Size
- By End Use
- USA
- Market Structure Analysis
- Competition Dashboard
- Competition Benchmarking
- Market Share Analysis of Top Players
- By Regional
- By Component
- By Deployment
- By Application
- By Enterprise Size
- By End Use
- Emerging Startups
- Innovation Benchmarking
- Competition Analysis
- Competition Deep Dive
- IBM Corporation
- Overview
- Product Portfolio
- Profitability by Market Segments
- Sales Footprint
- Strategy Overview
- Marketing Strategy
- Product Strategy
- Channel Strategy
- Microsoft Corporation
- Google LLC
- Amazon Web Services, Inc.
- DataRobot, Inc.
- FICO
- H2O.ai
- SAS Institute Inc.
- Dataiku
- Salesforce, Inc.
- IBM Corporation
- Case Studies
- Success Stories
- Recent Developments
- Competition Deep Dive
- Assumptions & Acronyms Used


