Face Paper Market Size and Share Forecast Outlook 2025 to 2035

Between 2025 and 2035, the face paper market is forecast to witness growth from USD 1.7 billion to USD 2.7 billion, achieving a 4.7% CAGR. Growth is being led by rising demand for pressure-sensitive labels used in retail, logistics, healthcare, and personal care packaging.
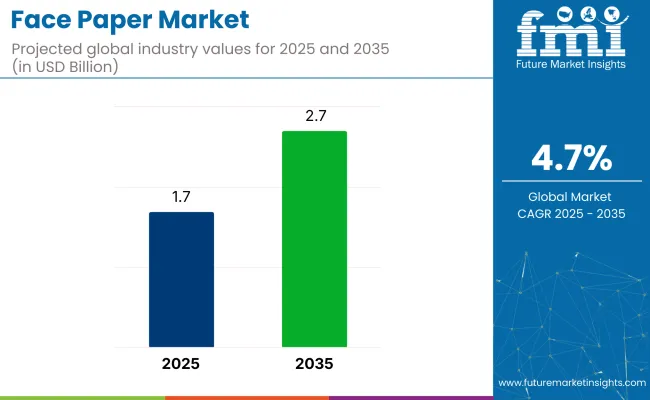
Quick Stats of Face Paper Market

  • Market Value (2025): USD 1.7 billion
  • Forecast Value (2035): USD 2.7 billion
  • Forecast CAGR: 4.7% (2025 to 2035)
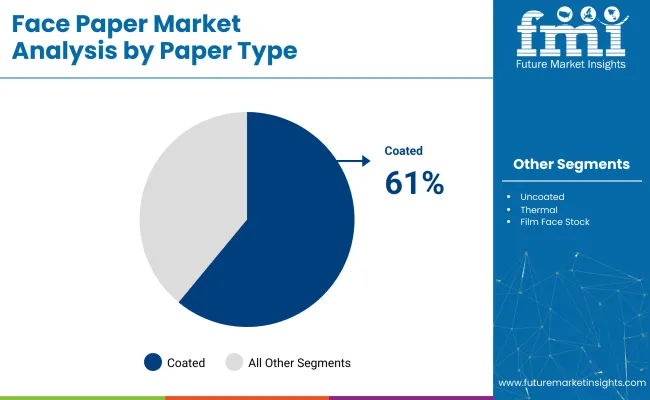
  • Product Leader in 2025: Coated Paper (61% market share)
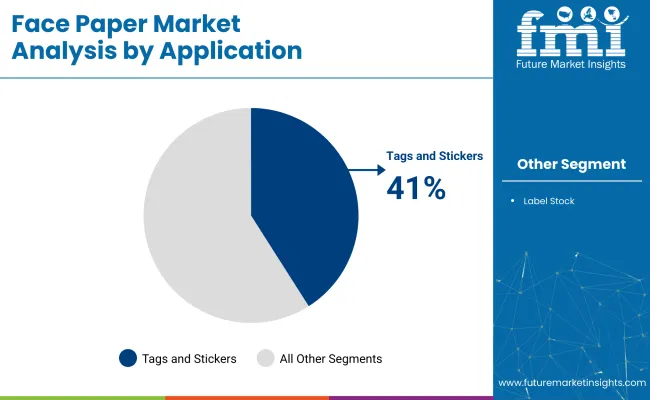
  • Top Distribution Channel: Tags and Stickers (41% share)
  • Key Growth Region: Germany and China (5.7% CAGR each)
  • Leading Player: UPM Adhesive Materials (18% industry share)

Face Paper Market

Attribute Detail
Market Size (2025) USD 1.7 billion
Market Size (2035) USD 2.7 billion
CAGR (2025 to 2035) 4.7%

Face paper plays a key role in delivering sharp print quality, durability, and label functionality. Increasing adoption of digital and flexographic printing has heightened the need for surfaces that support fast, high-resolution output.

The facial paper market, including tissues, wipes, and napkins, holds distinct shares across its parent markets. In the pulp industry, facial papers account for 8-10% of global pulp demand, relying on premium softwood fibers for quality. The packaging industry sees a minimal share (below 2%) since facial papers are consumer goods rather than packaging materials.

Within the tissue and hygiene sector, facial papers make up 30-35% of demand, driven by household and commercial usage. The recycling industry supplies 15-20% of fiber for facial papers, as brands increasingly adopt recycled content. The printing and publishing sector has almost no overlap, with facial papers holding less than 1% relevance. Growth in this market depends on consumer preferences, eco-friendly trends, and raw material availability.

Kimberly-Clark CEO Mike Hsu discusses the changing landscape of the facial tissue market, noting that innovation now addresses more than just softness. Consumers increasingly prioritize green usage, such as the company's plant-based packaging, as well as wellness-focused features.

This trend is fueling premiumization in developed markets, while affordability remains crucial for growth in emerging economies. Hsu's remarks underscore the dual challenge of meeting higher-value demands in mature markets while maintaining accessibility in price-sensitive regions. The company's strategy reflects an industry-wide shift toward balancing functionality and cost across diverse consumer markets.

In North America and Europe, demand for premium labels is increasing due to advanced branding, serialization, and compliance needs. As packaging becomes a key tool for product differentiation, the global face paper market is gaining momentum, driven by digital printing and green material preferences.

Analyzing Face Paper Market by Top Investment Segments

The global face paper market is experiencing strong demand across coated paper, tags & stickers, permanent adhesives, and glossy finishes. These four segments collectively account for over 70% of the total market share in 2025, driven by high label turnover and product visibility requirements in logistics, packaging, and retail.

Coated Grades Take the Lead in Label Material Preference

Coated paper dominates the product type segment, holding a 61% market share in 2025. Known for its clarity, smoothness, and ink retention, it is a standard material for pressure-sensitive label production.

Companies like UPM Raflatac, Avery Dennison, and Mondi Group are expanding their coated paper portfolios to serve high-volume converters across electronics, logistics, and retail. Its resistance to wear and ability to support complex graphics make it the preferred substrate across industries that prioritize label longevity and clarity under varying conditions.
  • Offers moisture resistance and sharp printability for shipping and branded labels.
  • Performs well in automated high-speed printing and die-cutting systems.
  • Backed by established suppliers ensuring quality consistency at industrial scale.

Face Paper Market Analysis By Paper Type

Tags and Stickers Shape Everyday Labeling Functions

The tags and stickers segment leads the application category, accounting for 41% of demand in 2025. As essential tools in retail labelling, inventory tracking, and promotional displays, they are widely used in e-commerce, fashion, and FMCG packaging.

Companies such as LINTEC Corporation, Flexcon, and Herma GmbH continue to innovate fast-drying and high-tack face paper grades for efficient performance in high-speed application systems. This segment is crucial to brands seeking both functionality and aesthetics in a compact format.
  • Preferred in batch labeling, SKU identification, and price tagging.
  • Maintains adhesion across temperature shifts in cold-chain logistics.
  • Integral to product-level marketing and tamper-evident labelling in apparel.

Face Paper Market Analysis By Application

Permanent Bonding Solutions Anchor Industrial Labeling

Permanent adhesives command a 54% share of the adhesive compatibility segment in 2025, driven by their essential role in industrial and regulatory labeling. Used extensively across chemicals, logistics, and consumer goods, these adhesives support labels that must remain intact through transportation and usage. Major players like 3M, Henkel, and Avery Dennison focus on peel-resistant and multi-surface adhesion formulations designed for demanding storage and transit conditions.

  • Ideal for compliance labels on drums, cartons, and long-shelf-life goods.
  • Prevents loss of key information across supply chains and handling cycles.
  • Frequently chosen for industrial, retail, and warehousing applications.

Glossy Paper Enhances Shelf Visibility and Branding

Glossy finishes account for 47% of the finish type segment in 2025, primarily used for their visual appeal and print vibrancy. Brands operating in cosmetics, luxury retail, and specialty packaging rely on glossy paper for high-end shelf impact and premium unboxing experiences. Key manufacturers like Sappi, Arconvert, and Fedrigoni are optimizing gloss substrates for compatibility with various ink types and digital presses.

  • Elevates color depth and contrast for logo-centric or image-heavy designs.
  • Protects surface integrity in high-touch retail environments.
  • Widely applied in decorative and specialty labelling for premium goods.

Packaging Sector Sets the Benchmark for Face Paper Usage

Packaging emerges as the leading end-use category, holding 33% of the market in 2025. From primary product labels to secondary packaging identification, face paper is integral to consumer communication and regulatory compliance. Companies such as Wausau Coated, UPM, and Nippon Paper are focusing on durable, scannable, and tamper-indicative solutions for FMCG and export sectors. The packaging boom from D2C models and e-commerce fulfillment centers further amplifies demand.

  • Applied across cans, cartons, pouches, and rigid formats for identity and tracking.
  • Supports critical functions like use-by dates, safety warnings, and traceability.
  • Reinforced by rising packaging standards across food, pharma, and retail exports.

Top Face Paper Market Dynamics

The face paper industry is advancing on the back of evolving labeling needs across FMCG, pharma, and logistics. Digital commerce expansion and stricter regulations on product traceability have amplified demand for premium, compliant labeling materials. To maintain competitiveness, major producers are accelerating investments in recyclable substrates, FSC-certified grades, and low-VOC adhesive technologies.

Strategic Innovation & Steady Expansion

Between 2024 and mid-2025, global manufacturers increased the volume share of FSC-certified face papers by 18%, led by UPM Raflatac’s expansion across Europe and Asia. Avery Dennison unveiled a new wash-off label series designed for closed-loop PET recycling systems, targeting beverage and personal care brands.

Sappi’s partnership with Xeikon yielded digitally optimized face paper stocks compatible with low-migration inks, streamlining adoption among short-run converters. Meanwhile, Mondi modernized its German facility to scale up uncoated paper output, addressing a 12% YoY increase in demand for plastic-free labeling options.

Application-Specific Product Launches

Lintec Corporation launched oil-resistant face papers engineered for foodservice packaging, catering to elevated hygiene standards in QSR chains and ready-to-eat products. Across Asia-Pacific, matte-finish face papers gained traction in pharmaceuticals and nutraceuticals as local players adapted to serialization mandates.

Premium wine and spirits segments in Europe continued favoring textured and embossed finishes, now capturing 28% of specialty label demand by mid-2025.

Cost Pressures & Material Substitution

Volatility in pulp and paper chemicals resulted in 9-13% fluctuations in base material costs between 2024 and early 2025. This squeezed converter margins, prompting a shift toward thinner substrates and optimized grammage ranges.

Competitive pressures from synthetic alternatives, such as BOPP and PET-based labels, began reshaping purchase criteria in the food and household product sectors. Regulatory uncertainty surrounding adhesives with high migration potential led to delayed product approvals across North America and the EU, creating backlogs in new SKU rollouts.
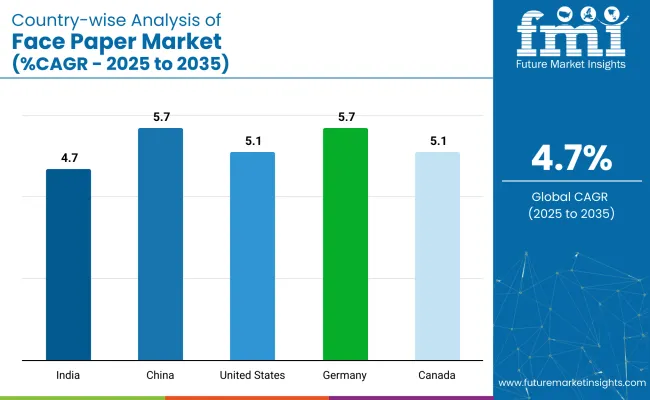
Top Countries Manufacturing, Synthesizing, Distributing, and Generating Demand for Face Paper

Country Wise Analysis Of Face Paper Market

Countries Projected CAGR (2025 to 2035)
India 4.7%
China 5.7%
United States 5.1%
Germany 5.7%
Canada 5.1%

Global demand for Face Paper is projected to grow at a 5.3% CAGR from 2025 to 2035. Among the five profiled markets out of 40 covered, Germany and China lead at 5.7% each, followed by the United States and Canada at 5.1%, and India at 4.7%.

These growth rates translate to a +7.5% premium for Germany and China, -3.8% for the USA and Canada, and a -11.3% discount for India compared to the baseline. Divergence in growth is driven by strong demand for high-performance label stock and retail packaging in Germany and China, consistent application in North American consumer goods, and comparatively slower expansion in India due to infrastructure and value chain limitations.

The report covers a detailed analysis of 40+ countries, with the top five countries shared as a reference.

India’s Face Paper Demand Landscape

Face paper usage in India is growing at a 4.7% CAGR, influenced by vernacular packaging needs, high SKU rotation, and sachet-heavy distribution across personal care and OTC categories. Regional converters in Delhi NCR, Gujarat, and Tamil Nadu have scaled up on matte and semi-gloss coated substrates designed for flexo and digital presses.

More than 150 mid-size print suppliers now focus on low-batch orders with high ink holdout, for Ayurveda, cosmetic, and grooming brands. Direct-to-retail packaging, combined with rural marketing formats, has widened the specification mix for reel and sheet configurations.

  • Matte-coated face paper volumes rose 18% YoY across Tier 2 regions
  • 6 in 10 regional brands now use custom-width reels for unit-dose packs
  • Personal hygiene and OTC labeling accounted for over 22% of 2024’s total volume

China’s Face Paper Conversion Surge

China’s face paper industry is expanding at a 5.7% CAGR, driven by thermal-receptive label consumption in B2C shipping, logistics automation, and regional warehousing. Over 320,000 metric tons of face paper were processed in 2024 by converters across Jiangsu, Zhejiang, and Guangdong.

These zones anchor the country’s role in supplying logistics-grade substrates across BRICS and ASEAN trade routes. Demand for heat-sensitive labels and real-time QR coding surged with e-commerce volumes surpassing 310 million parcels daily, prompting rapid reel reconfiguration in second-tier inland hubs.

  • Thermal-responsive substrate volume rose 23% YoY in 2024
  • Jiangsu and Zhejiang shipped 22% of production to Southeast Asia and Africa
  • Smart label reels dominate in warehouse automation zones near Chengdu and Wuhan

The United States Face Paper Usage Profile

Face paper demand in the USA is advancing at a 5.1% CAGR, supported by medical labeling, prescription compliance, and supply chain visibility protocols. FDA-approved packaging lines in California, New Jersey, and Illinois have standardized acid-free and repositionable face paper across regulated categories.

In 2024, over 230 million prescription containers used scuff-resistant face labels to meet barcode readability under refrigeration. E-commerce and logistics players rely heavily on serialized QR overlays and water-resistant finishes, especially in pharmaceuticals and clinical trial logistics.

  • 67% of pharma-grade packaging used acid-free face paper in 2024
  • Scuff-resistant formats grew 19% YoY across OTC and medical device segments
  • QR-enabled distribution labels now apply to 63% of outbound parcels

Germany’s Industrial Application Demand

Germany’s face paper industry is growing at a 5.7% CAGR, led by requirements from industrial goods exports, automotive parts labeling, and EU directive compliance. Converters in Bavaria and Saxony operated above 90% utilization in 2024, fulfilling orders for double-coated, tear-resistant substrates suited for cross-border freight and hazardous goods.

Labeling protocols tied to REACH and DIN standards have shaped product specifications. Over 215,000 metric tons of face paper were consumed last year, with consistent reorders from logistics providers and heavy equipment assemblers.

  • 72% of German auto suppliers adopted high-strength face paper in 2024
  • Industrial goods labeling rose 21% YoY, especially in mechanical parts exports
  • Waterproof adhesives grew by 28% in freight routes via Hamburg and Duisburg

Canada’s Regulatory and Specialty Label Trends

The industry in Canada is tracking a 5.1% CAGR in face paper usage, shaped by bilingual packaging regulations, cannabis product labeling, and demand from wellness food brands. Ontario and Quebec converters shipped over 87,000tons of press-compatible face paper in 2024, with growth highest in roll-fed, peelable formats.

Cold-chain-ready substrates are being used in institutional foodservice, meal kits, and therapeutic supplements. The push toward hybrid presses and small-batch runs continues to drive demand for flexible-width digital reels that support French-English compliance layouts.

  • Cold-resistant face paper applied to 26% of refrigerated foods sold in 2024
  • Cannabis-specific peel labels reached 31% of unit volume across dispensaries
  • 85% of bilingual SKUs in FMCG segments use digital-optimized face paper formats

Leading Face Paper Supplier

Leading Player-UPM Adhesive Materials with 18% industry share.

The face paper industry is dominated by key players like UPM Adhesive Materials, Delfort Group, Emax Label Solution, and Whitlam Group, each employing distinct strategies to maintain competitiveness. UPM focuses on expanding its product portfolio through targeted R&D, recently launching a high-performance face paper for extreme conditions.

Delfort Group emphasizes quality and customization, catering to niche markets like luxury packaging. Emax Label Solution leverages cost-effective production techniques, while Whitlam Group strengthens its distribution network to enhance market reach.

Emerging players are entering the market with specialized offerings, though high entry barriers like stringent regulatory standards and established supply chains limit new competition. The market remains fragmented, with consolidation trends emerging as larger firms acquire smaller innovators to diversify capabilities.

Recent Face Paper Industry News

  • UPM Adhesive Materials acquired a specialty paper manufacturer (Q1 2024), strengthening its portfolio in high-performance adhesive solutions and expanding its market reach in Europe and North America.
  • Delfort Group launched a lightweight face paper (Q2 2023), achieving a 15% reduction in material weight while maintaining durability, targeting the premium packaging and labeling sectors.

Leading Players

  • UPM Adhesive Materials
  • Delfort Group
  • Emax Label Solution
  • Whitlam Group

Report Attributes

Attribute Details
Market Size (2025) USD 1.7 billion
Projected Market Size (2035) USD 2.7 billion
CAGR (2025 to 2035) 4.7%
Base Year for Estimation 2024
Historical Period 2020 to 2024
Forecast Period 2025 to 2035
Quantitative Units USD billion for value
Paper Types Analyzed Coated Paper, Uncoated Paper, Film Face Stock, Thermal Paper
Adhesive Compatibility Permanent, Removable, Freezer-grade
Finish Types Analyzed Glossy, Matte, Semi-gloss
Applications Analyzed Label Stock (Food Labels, Barcode Labels, Industrial Labels), Tags & Stickers (Retail Stickers, Apparel Tags)
End-Use Industries Analyzed Packaging, Retail, Logistics, Healthcare, Industrial
Regions Covered North America, Europe, Asia-Pacific, Latin America, Middle East & Africa
Countries Covered United States, Germany, Brazil, China, India, South Korea, UAE
Key Players UPM Adhesive Materials, Delfort Group, Emax Label Solution, Whitlam Group
Additional Attributes Dollar sales, demand shifts toward recyclable and compostable paper stocks, integration with smart labeling tech (RFID, barcoding), growth in logistics and healthcare end uses, regional regulatory shifts around packaging waste, and evolving consumer preferences for matte and semi-gloss finishes.

Key Segments

By Paper Type:

The segment includes Coated Paper, Uncoated Paper, Film Face Stock, and Thermal Paper.

By Adhesive Compatibility:

This category comprises Permanent, Removable, and Freezer-grade adhesives.

By Finish Type:

Segmented into Glossy, Matte, and Semi-gloss finishes.

By Application:

Segmented into Label Stock(Food Labels, Barcode Labels, Industrial Labels), Tags & Stickers(Retail Stickers, Apparel Tags).

By End-Use Industry:

Segmented into Packaging, Retail, Logistics, Healthcare, and Industrial sectors.

By Region:

Industry performance assessed across North America, Europe, Asia-Pacific, Latin America, and the Middle East & Africa.

Table of Content

  1. Executive Summary
    • Global Market Outlook
    • Demand-side Trends
    • Supply-side Trends
    • Technology Roadmap Analysis
    • Analysis and Recommendations
  2. Market Overview
    • Market Coverage/Taxonomy
    • Market Definition/Scope/Limitations
  3. Market Background
    • Market Dynamics
      • Drivers
      • Restraints
      • Opportunity
      • Trends
    • Scenario Forecast
      • Demand in Optimistic Scenario
      • Demand in Likely Scenario
      • Demand in Conservative Scenario
    • Opportunity Map Analysis
    • Product Life Cycle Analysis
    • Supply Chain Analysis
      • Supply Side Participants and their Roles
        • Producers
        • Mid-Level Participants (Traders/ Agents/ Brokers)
        • Wholesalers and Distributors
      • Value Added and Value Created at Node in the Supply Chain
      • List of Raw Material Suppliers
      • List of Existing and Potential Buyer’s
    • Investment Feasibility Matrix
    • Value Chain Analysis
      • Profit Margin Analysis
      • Wholesalers and Distributors
      • Retailers
    • PESTLE and Porter’s Analysis
    • Regulatory Landscape
      • By Key Regions
      • By Key Countries
    • Regional Parent Market Outlook
    • Production and Consumption Statistics
    • Import and Export Statistics
  4. Global Market Analysis 2020 to 2024 and Forecast, 2025 to 2035
    • Historical Market Size Value (USD Billion) & Volume (MT) Analysis, 2020 to 2024
    • Current and Future Market Size Value (USD Billion) & Volume (MT) Projections, 2025 to 2035
      • Y-o-Y Growth Trend Analysis
      • Absolute $ Opportunity Analysis
  5. Global Market Pricing Analysis 2020 to 2024 and Forecast 2025 to 2035
  6. Global Market Analysis 2020 to 2024 and Forecast 2025 to 2035, By Paper Type
    • Introduction/Key Findings
    • Historical Market Size Value (USD Billion) & Volume (MT) Analysis By Paper Type, 2020 to 2024
    • Current and Future Market Size Value (USD Billion) & Volume (MT) Analysis and Forecast By Paper Type, 2025 to 2035
      • Coated Paper
      • Uncoated Paper
      • Film Face Stock
      • Thermal Paper
    • Y-o-Y Growth Trend Analysis By Paper Type, 2020 to 2024
    • Absolute $ Opportunity Analysis By Paper Type, 2025 to 2035
  7. Global Market Analysis 2020 to 2024 and Forecast 2025 to 2035, By Adhesive Compatibility
    • Introduction/Key Findings
    • Historical Market Size Value (USD Billion) & Volume (MT) Analysis By Adhesive Compatibility, 2020 to 2024
    • Current and Future Market Size Value (USD Billion) & Volume (MT) Analysis and Forecast By Adhesive Compatibility, 2025 to 2035
      • Permanent
      • Removable
      • Freezer-grade adhesives
    • Y-o-Y Growth Trend Analysis By Adhesive Compatibility, 2020 to 2024
    • Absolute $ Opportunity Analysis By Adhesive Compatibility, 2025 to 2035
  8. Global Market Analysis 2020 to 2024 and Forecast 2025 to 2035, By Finish Type
    • Introduction/Key Findings
    • Historical Market Size Value (USD Billion) & Volume (MT) Analysis By Finish Type, 2020 to 2024
    • Current and Future Market Size Value (USD Billion) & Volume (MT) Analysis and Forecast By Finish Type, 2025 to 2035
      • Glossy
      • Matte
      • Semi-gloss
    • Y-o-Y Growth Trend Analysis By Finish Type, 2020 to 2024
    • Absolute $ Opportunity Analysis By Finish Type, 2025 to 2035
  9. Global Market Analysis 2020 to 2024 and Forecast 2025 to 2035, By Application
    • Introduction/Key Findings
    • Historical Market Size Value (USD Billion) & Volume (MT) Analysis By Application, 2020 to 2024
    • Current and Future Market Size Value (USD Billion) & Volume (MT) Analysis and Forecast By Application, 2025 to 2035
      • Label Stock
        • Food Labels
        • Barcode Labels
        • Industrial Labels
      • Tags & Stickers
        • Retail Stickers
        • Apparel Tags
    • Y-o-Y Growth Trend Analysis By Application, 2020 to 2024
    • Absolute $ Opportunity Analysis By Application, 2025 to 2035
  10. Global Market Analysis 2020 to 2024 and Forecast 2025 to 2035, By End-Use Industry
    • Introduction/Key Findings
    • Historical Market Size Value (USD Billion) & Volume (MT) Analysis By End-Use Industry, 2020 to 2024
    • Current and Future Market Size Value (USD Billion) & Volume (MT) Analysis and Forecast By End-Use Industry, 2025 to 2035
      • Packaging
      • Retail
      • Logistics
      • Healthcare
      • Industrial sectors
    • Y-o-Y Growth Trend Analysis By End-Use Industry, 2020 to 2024
    • Absolute $ Opportunity Analysis By End-Use Industry, 2025 to 2035
  11. Global Market Analysis 2020 to 2024 and Forecast 2025 to 2035, By Region
    • Introduction
    • Historical Market Size Value (USD Billion) & Volume (MT) Analysis By Region, 2020 to 2024
    • Current Market Size Value (USD Billion) & Volume (MT) Analysis and Forecast By Region, 2025 to 2035
      • North America
      • Latin America
      • Western Europe
      • Eastern Europe
      • East Asia
      • South Asia & Pacific
      • Middle East and Africa
    • Market Attractiveness Analysis By Region
  12. North America Market Analysis 2020 to 2024 and Forecast 2025 to 2035, By Country
    • Historical Market Size Value (USD Billion) & Volume (MT) Trend Analysis By Market Taxonomy, 2020 to 2024
    • Market Size Value (USD Billion) & Volume (MT) Forecast By Market Taxonomy, 2025 to 2035
      • By Country
        • USA
        • Canada
        • Mexico
      • By Paper Type
      • By Adhesive Compatibility
      • By Finish Type
      • By Application
      • By End-Use Industry
    • Market Attractiveness Analysis
      • By Country
      • By Paper Type
      • By Adhesive Compatibility
      • By Finish Type
      • By Application
      • By End-Use Industry
    • Key Takeaways
  13. Latin America Market Analysis 2020 to 2024 and Forecast 2025 to 2035, By Country
    • Historical Market Size Value (USD Billion) & Volume (MT) Trend Analysis By Market Taxonomy, 2020 to 2024
    • Market Size Value (USD Billion) & Volume (MT) Forecast By Market Taxonomy, 2025 to 2035
      • By Country
        • Brazil
        • Argentina
        • Rest of LATAM
      • By Paper Type
      • By Adhesive Compatibility
      • By Finish Type
      • By Application
      • By End-Use Industry
    • Market Attractiveness Analysis
      • By Country
      • By Paper Type
      • By Adhesive Compatibility
      • By Finish Type
      • By Application
      • By End-Use Industry
    • Key Takeaways
  14. Western Europe Market Analysis 2020 to 2024 and Forecast 2025 to 2035, By Country
    • Historical Market Size Value (USD Billion) & Volume (MT) Trend Analysis By Market Taxonomy, 2020 to 2024
    • Market Size Value (USD Billion) & Volume (MT) Forecast By Market Taxonomy, 2025 to 2035
      • By Country
        • Germany
        • Italy
        • France
        • UK
        • Spain
        • BENELUX
        • Nordic
        • Rest of W.Europe
      • By Paper Type
      • By Adhesive Compatibility
      • By Finish Type
      • By Application
      • By End-Use Industry
    • Market Attractiveness Analysis
      • By Country
      • By Paper Type
      • By Adhesive Compatibility
      • By Finish Type
      • By Application
      • By End-Use Industry
    • Key Takeaways
  15. Eastern Europe Market Analysis 2020 to 2024 and Forecast 2025 to 2035, By Country
    • Historical Market Size Value (USD Billion) & Volume (MT) Trend Analysis By Market Taxonomy, 2020 to 2024
    • Market Size Value (USD Billion) & Volume (MT) Forecast By Market Taxonomy, 2025 to 2035
      • By Country
        • Russia
        • Hungary
        • Poland
        • Balkan & Baltics
        • Rest of E. Europe
      • By Paper Type
      • By Adhesive Compatibility
      • By Finish Type
      • By Application
      • By End-Use Industry
    • Market Attractiveness Analysis
      • By Country
      • By Paper Type
      • By Adhesive Compatibility
      • By Finish Type
      • By Application
      • By End-Use Industry
    • Key Takeaways
  16. East Asia Market Analysis 2020 to 2024 and Forecast 2025 to 2035, By Country
    • Historical Market Size Value (USD Billion) & Volume (MT) Trend Analysis By Market Taxonomy, 2020 to 2024
    • Market Size Value (USD Billion) & Volume (MT) Forecast By Market Taxonomy, 2025 to 2035
      • By Country
        • China
        • Japan
        • South Korea
      • By Paper Type
      • By Adhesive Compatibility
      • By Finish Type
      • By Application
      • By End-Use Industry
    • Market Attractiveness Analysis
      • By Country
      • By Paper Type
      • By Adhesive Compatibility
      • By Finish Type
      • By Application
      • By End-Use Industry
    • Key Takeaways
  17. South Asia & Pacific Market Analysis 2020 to 2024 and Forecast 2025 to 2035, By Country
    • Historical Market Size Value (USD Billion) & Volume (MT) Trend Analysis By Market Taxonomy, 2020 to 2024
    • Market Size Value (USD Billion) & Volume (MT) Forecast By Market Taxonomy, 2025 to 2035
      • By Country
        • India
        • Australia & New Zealand
        • ASEAN
        • Rest of SAP
      • By Paper Type
      • By Adhesive Compatibility
      • By Finish Type
      • By Application
      • By End-Use Industry
    • Market Attractiveness Analysis
      • By Country
      • By Paper Type
      • By Adhesive Compatibility
      • By Finish Type
      • By Application
      • By End-Use Industry
    • Key Takeaways
  18. Middle East and Africa Market Analysis 2020 to 2024 and Forecast 2025 to 2035, By Country
    • Historical Market Size Value (USD Billion) & Volume (MT) Trend Analysis By Market Taxonomy, 2020 to 2024
    • Market Size Value (USD Billion) & Volume (MT) Forecast By Market Taxonomy, 2025 to 2035
      • By Country
        • GCC Countries
        • Northern Africa
        • South Africa
        • Turkiye
        • Rest of MEA
      • By Paper Type
      • By Adhesive Compatibility
      • By Finish Type
      • By Application
      • By End-Use Industry
    • Market Attractiveness Analysis
      • By Country
      • By Paper Type
      • By Adhesive Compatibility
      • By Finish Type
      • By Application
      • By End-Use Industry
    • Key Takeaways
  19. Key Countries Market Analysis
    • USA
      • Pricing Analysis
      • Market Share Analysis, 2024
        • By Paper Type
        • By Adhesive Compatibility
        • By Finish Type
        • By Application
        • By End-Use Industry
    • Canada
      • Pricing Analysis
      • Market Share Analysis, 2024
        • By Paper Type
        • By Adhesive Compatibility
        • By Finish Type
        • By Application
        • By End-Use Industry
    • Brazil
      • Pricing Analysis
      • Market Share Analysis, 2024
        • By Paper Type
        • By Adhesive Compatibility
        • By Finish Type
        • By Application
        • By End-Use Industry
    • Mexico
      • Pricing Analysis
      • Market Share Analysis, 2024
        • By Paper Type
        • By Adhesive Compatibility
        • By Finish Type
        • By Application
        • By End-Use Industry
    • Argentina
      • Pricing Analysis
      • Market Share Analysis, 2024
        • By Paper Type
        • By Adhesive Compatibility
        • By Finish Type
        • By Application
        • By End-Use Industry
  20. Market Structure Analysis
    • Competition Dashboard
    • Competition Benchmarking
    • Market Share Analysis of Top Players
      • By Regional
      • By Paper Type
      • By Adhesive Compatibility
      • By Finish Type
      • By Application
      • By End-Use Industry
  21. Competition Analysis
    • Competition Deep Dive
      • UPM Adhesive Materials
        • Overview
        • Product Portfolio
        • Profitability by Market Segments (Product/Age /Sales Channel/Region)
        • Sales Footprint
        • Strategy Overview
          • Marketing Strategy
          • Product Strategy
          • Channel Strategy
      • Delfort Group
        • Overview
        • Product Portfolio
        • Profitability by Market Segments (Product/Age /Sales Channel/Region)
        • Sales Footprint
        • Strategy Overview
          • Marketing Strategy
          • Product Strategy
          • Channel Strategy
      • Emax Label Solution
        • Overview
        • Product Portfolio
        • Profitability by Market Segments (Product/Age /Sales Channel/Region)
        • Sales Footprint
        • Strategy Overview
          • Marketing Strategy
          • Product Strategy
          • Channel Strategy
      • Whitlam Group
        • Overview
        • Product Portfolio
        • Profitability by Market Segments (Product/Age /Sales Channel/Region)
        • Sales Footprint
        • Strategy Overview
          • Marketing Strategy
          • Product Strategy
          • Channel Strategy
  22. Assumptions & Acronyms Used
  23. Research Methodology

List of Tables

  • Table 1: Global Market Value (USD Billion) Forecast by Region, 2020-2035
  • Table 2: Global Market Volume (MT) Forecast by Region, 2020-2035
  • Table 3: Global Market Value (USD Billion) Forecast by Paper Type, 2020-2035
  • Table 4: Global Market Volume (MT) Forecast by Paper Type, 2020-2035
  • Table 5: Global Market Value (USD Billion) Forecast by Adhesive Compatibility, 2020-2035
  • Table 6: Global Market Volume (MT) Forecast by Adhesive Compatibility, 2020-2035
  • Table 7: Global Market Value (USD Billion) Forecast by Finish Type, 2020-2035
  • Table 8: Global Market Volume (MT) Forecast by Finish Type, 2020-2035
  • Table 9: Global Market Value (USD Billion) Forecast by Application, 2020-2035
  • Table 10: Global Market Volume (MT) Forecast by Application, 2020-2035
  • Table 11: Global Market Value (USD Billion) Forecast by End-Use Industry, 2020-2035
  • Table 12: Global Market Volume (MT) Forecast by End-Use Industry, 2020-2035
  • Table 13: North America Market Value (USD Billion) Forecast by Country, 2020-2035
  • Table 14: North America Market Volume (MT) Forecast by Country, 2020-2035
  • Table 15: North America Market Value (USD Billion) Forecast by Paper Type, 2020-2035
  • Table 16: North America Market Volume (MT) Forecast by Paper Type, 2020-2035
  • Table 17: North America Market Value (USD Billion) Forecast by Adhesive Compatibility, 2020-2035
  • Table 18: North America Market Volume (MT) Forecast by Adhesive Compatibility, 2020-2035
  • Table 19: North America Market Value (USD Billion) Forecast by Finish Type, 2020-2035
  • Table 20: North America Market Volume (MT) Forecast by Finish Type, 2020-2035
  • Table 21: North America Market Value (USD Billion) Forecast by Application, 2020-2035
  • Table 22: North America Market Volume (MT) Forecast by Application, 2020-2035
  • Table 23: North America Market Value (USD Billion) Forecast by End-Use Industry, 2020-2035
  • Table 24: North America Market Volume (MT) Forecast by End-Use Industry, 2020-2035
  • Table 25: Latin America Market Value (USD Billion) Forecast by Country, 2020-2035
  • Table 26: Latin America Market Volume (MT) Forecast by Country, 2020-2035
  • Table 27: Latin America Market Value (USD Billion) Forecast by Paper Type, 2020-2035
  • Table 28: Latin America Market Volume (MT) Forecast by Paper Type, 2020-2035
  • Table 29: Latin America Market Value (USD Billion) Forecast by Adhesive Compatibility, 2020-2035
  • Table 30: Latin America Market Volume (MT) Forecast by Adhesive Compatibility, 2020-2035
  • Table 31: Latin America Market Value (USD Billion) Forecast by Finish Type, 2020-2035
  • Table 32: Latin America Market Volume (MT) Forecast by Finish Type, 2020-2035
  • Table 33: Latin America Market Value (USD Billion) Forecast by Application, 2020-2035
  • Table 34: Latin America Market Volume (MT) Forecast by Application, 2020-2035
  • Table 35: Latin America Market Value (USD Billion) Forecast by End-Use Industry, 2020-2035
  • Table 36: Latin America Market Volume (MT) Forecast by End-Use Industry, 2020-2035
  • Table 37: Western Europe Market Value (USD Billion) Forecast by Country, 2020-2035
  • Table 38: Western Europe Market Volume (MT) Forecast by Country, 2020-2035
  • Table 39: Western Europe Market Value (USD Billion) Forecast by Paper Type, 2020-2035
  • Table 40: Western Europe Market Volume (MT) Forecast by Paper Type, 2020-2035
  • Table 41: Western Europe Market Value (USD Billion) Forecast by Adhesive Compatibility, 2020-2035
  • Table 42: Western Europe Market Volume (MT) Forecast by Adhesive Compatibility, 2020-2035
  • Table 43: Western Europe Market Value (USD Billion) Forecast by Finish Type, 2020-2035
  • Table 44: Western Europe Market Volume (MT) Forecast by Finish Type, 2020-2035
  • Table 45: Western Europe Market Value (USD Billion) Forecast by Application, 2020-2035
  • Table 46: Western Europe Market Volume (MT) Forecast by Application, 2020-2035
  • Table 47: Western Europe Market Value (USD Billion) Forecast by End-Use Industry, 2020-2035
  • Table 48: Western Europe Market Volume (MT) Forecast by End-Use Industry, 2020-2035
  • Table 49: Eastern Europe Market Value (USD Billion) Forecast by Country, 2020-2035
  • Table 50: Eastern Europe Market Volume (MT) Forecast by Country, 2020-2035
  • Table 51: Eastern Europe Market Value (USD Billion) Forecast by Paper Type, 2020-2035
  • Table 52: Eastern Europe Market Volume (MT) Forecast by Paper Type, 2020-2035
  • Table 53: Eastern Europe Market Value (USD Billion) Forecast by Adhesive Compatibility, 2020-2035
  • Table 54: Eastern Europe Market Volume (MT) Forecast by Adhesive Compatibility, 2020-2035
  • Table 55: Eastern Europe Market Value (USD Billion) Forecast by Finish Type, 2020-2035
  • Table 56: Eastern Europe Market Volume (MT) Forecast by Finish Type, 2020-2035
  • Table 57: Eastern Europe Market Value (USD Billion) Forecast by Application, 2020-2035
  • Table 58: Eastern Europe Market Volume (MT) Forecast by Application, 2020-2035
  • Table 59: Eastern Europe Market Value (USD Billion) Forecast by End-Use Industry, 2020-2035
  • Table 60: Eastern Europe Market Volume (MT) Forecast by End-Use Industry, 2020-2035
  • Table 61: East Asia Market Value (USD Billion) Forecast by Country, 2020-2035
  • Table 62: East Asia Market Volume (MT) Forecast by Country, 2020-2035
  • Table 63: East Asia Market Value (USD Billion) Forecast by Paper Type, 2020-2035
  • Table 64: East Asia Market Volume (MT) Forecast by Paper Type, 2020-2035
  • Table 65: East Asia Market Value (USD Billion) Forecast by Adhesive Compatibility, 2020-2035
  • Table 66: East Asia Market Volume (MT) Forecast by Adhesive Compatibility, 2020-2035
  • Table 67: East Asia Market Value (USD Billion) Forecast by Finish Type, 2020-2035
  • Table 68: East Asia Market Volume (MT) Forecast by Finish Type, 2020-2035
  • Table 69: East Asia Market Value (USD Billion) Forecast by Application, 2020-2035
  • Table 70: East Asia Market Volume (MT) Forecast by Application, 2020-2035
  • Table 71: East Asia Market Value (USD Billion) Forecast by End-Use Industry, 2020-2035
  • Table 72: East Asia Market Volume (MT) Forecast by End-Use Industry, 2020-2035
  • Table 73: South Asia & Pacific Market Value (USD Billion) Forecast by Country, 2020-2035
  • Table 74: South Asia & Pacific Market Volume (MT) Forecast by Country, 2020-2035
  • Table 75: South Asia & Pacific Market Value (USD Billion) Forecast by Paper Type, 2020-2035
  • Table 76: South Asia & Pacific Market Volume (MT) Forecast by Paper Type, 2020-2035
  • Table 77: South Asia & Pacific Market Value (USD Billion) Forecast by Adhesive Compatibility, 2020-2035
  • Table 78: South Asia & Pacific Market Volume (MT) Forecast by Adhesive Compatibility, 2020-2035
  • Table 79: South Asia & Pacific Market Value (USD Billion) Forecast by Finish Type, 2020-2035
  • Table 80: South Asia & Pacific Market Volume (MT) Forecast by Finish Type, 2020-2035
  • Table 81: South Asia & Pacific Market Value (USD Billion) Forecast by Application, 2020-2035
  • Table 82: South Asia & Pacific Market Volume (MT) Forecast by Application, 2020-2035
  • Table 83: South Asia & Pacific Market Value (USD Billion) Forecast by End-Use Industry, 2020-2035
  • Table 84: South Asia & Pacific Market Volume (MT) Forecast by End-Use Industry, 2020-2035
  • Table 85: Middle East and Africa Market Value (USD Billion) Forecast by Country, 2020-2035
  • Table 86: Middle East and Africa Market Volume (MT) Forecast by Country, 2020-2035
  • Table 87: Middle East and Africa Market Value (USD Billion) Forecast by Paper Type, 2020-2035
  • Table 88: Middle East and Africa Market Volume (MT) Forecast by Paper Type, 2020-2035
  • Table 89: Middle East and Africa Market Value (USD Billion) Forecast by Adhesive Compatibility, 2020-2035
  • Table 90: Middle East and Africa Market Volume (MT) Forecast by Adhesive Compatibility, 2020-2035
  • Table 91: Middle East and Africa Market Value (USD Billion) Forecast by Finish Type, 2020-2035
  • Table 92: Middle East and Africa Market Volume (MT) Forecast by Finish Type, 2020-2035
  • Table 93: Middle East and Africa Market Value (USD Billion) Forecast by Application, 2020-2035
  • Table 94: Middle East and Africa Market Volume (MT) Forecast by Application, 2020-2035
  • Table 95: Middle East and Africa Market Value (USD Billion) Forecast by End-Use Industry, 2020-2035
  • Table 96: Middle East and Africa Market Volume (MT) Forecast by End-Use Industry, 2020-2035

List of Figures

  • Figure 1: Global Market Volume (MT) Forecast 2020-2035
  • Figure 2: Global Market Pricing Analysis
  • Figure 3: Global Market Value (USD Billion) Forecast 2020-2035
  • Figure 4: Global Market Value Share and BPS Analysis by Paper Type, 2025 and 2035
  • Figure 5: Global Market Y-o-Y Growth Comparison by Paper Type, 2025-2035
  • Figure 6: Global Market Attractiveness Analysis by Paper Type
  • Figure 7: Global Market Value Share and BPS Analysis by Adhesive Compatibility, 2025 and 2035
  • Figure 8: Global Market Y-o-Y Growth Comparison by Adhesive Compatibility, 2025-2035
  • Figure 9: Global Market Attractiveness Analysis by Adhesive Compatibility
  • Figure 10: Global Market Value Share and BPS Analysis by Finish Type, 2025 and 2035
  • Figure 11: Global Market Y-o-Y Growth Comparison by Finish Type, 2025-2035
  • Figure 12: Global Market Attractiveness Analysis by Finish Type
  • Figure 13: Global Market Value Share and BPS Analysis by Application, 2025 and 2035
  • Figure 14: Global Market Y-o-Y Growth Comparison by Application, 2025-2035
  • Figure 15: Global Market Attractiveness Analysis by Application
  • Figure 16: Global Market Value Share and BPS Analysis by End-Use Industry, 2025 and 2035
  • Figure 17: Global Market Y-o-Y Growth Comparison by End-Use Industry, 2025-2035
  • Figure 18: Global Market Attractiveness Analysis by End-Use Industry
  • Figure 19: Global Market Value (USD Billion) Share and BPS Analysis by Region, 2025 and 2035
  • Figure 20: Global Market Y-o-Y Growth Comparison by Region, 2025-2035
  • Figure 21: Global Market Attractiveness Analysis by Region
  • Figure 22: North America Market Incremental $ Opportunity, 2025-2035
  • Figure 23: Latin America Market Incremental $ Opportunity, 2025-2035
  • Figure 24: Western Europe Market Incremental $ Opportunity, 2025-2035
  • Figure 25: Eastern Europe Market Incremental $ Opportunity, 2025-2035
  • Figure 26: East Asia Market Incremental $ Opportunity, 2025-2035
  • Figure 27: South Asia & Pacific Market Incremental $ Opportunity, 2025-2035
  • Figure 28: Middle East and Africa Market Incremental $ Opportunity, 2025-2035
  • Figure 29: North America Market Value Share and BPS Analysis by Country, 2025 and 2035
  • Figure 30: North America Market Value Share and BPS Analysis by Paper Type, 2025 and 2035
  • Figure 31: North America Market Y-o-Y Growth Comparison by Paper Type, 2025-2035
  • Figure 32: North America Market Attractiveness Analysis by Paper Type
  • Figure 33: North America Market Value Share and BPS Analysis by Adhesive Compatibility, 2025 and 2035
  • Figure 34: North America Market Y-o-Y Growth Comparison by Adhesive Compatibility, 2025-2035
  • Figure 35: North America Market Attractiveness Analysis by Adhesive Compatibility
  • Figure 36: North America Market Value Share and BPS Analysis by Finish Type, 2025 and 2035
  • Figure 37: North America Market Y-o-Y Growth Comparison by Finish Type, 2025-2035
  • Figure 38: North America Market Attractiveness Analysis by Finish Type
  • Figure 39: North America Market Value Share and BPS Analysis by Application, 2025 and 2035
  • Figure 40: North America Market Y-o-Y Growth Comparison by Application, 2025-2035
  • Figure 41: North America Market Attractiveness Analysis by Application
  • Figure 42: North America Market Value Share and BPS Analysis by End-Use Industry, 2025 and 2035
  • Figure 43: North America Market Y-o-Y Growth Comparison by End-Use Industry, 2025-2035
  • Figure 44: North America Market Attractiveness Analysis by End-Use Industry
  • Figure 45: Latin America Market Value Share and BPS Analysis by Country, 2025 and 2035
  • Figure 46: Latin America Market Value Share and BPS Analysis by Paper Type, 2025 and 2035
  • Figure 47: Latin America Market Y-o-Y Growth Comparison by Paper Type, 2025-2035
  • Figure 48: Latin America Market Attractiveness Analysis by Paper Type
  • Figure 49: Latin America Market Value Share and BPS Analysis by Adhesive Compatibility, 2025 and 2035
  • Figure 50: Latin America Market Y-o-Y Growth Comparison by Adhesive Compatibility, 2025-2035
  • Figure 51: Latin America Market Attractiveness Analysis by Adhesive Compatibility
  • Figure 52: Latin America Market Value Share and BPS Analysis by Finish Type, 2025 and 2035
  • Figure 53: Latin America Market Y-o-Y Growth Comparison by Finish Type, 2025-2035
  • Figure 54: Latin America Market Attractiveness Analysis by Finish Type
  • Figure 55: Latin America Market Value Share and BPS Analysis by Application, 2025 and 2035
  • Figure 56: Latin America Market Y-o-Y Growth Comparison by Application, 2025-2035
  • Figure 57: Latin America Market Attractiveness Analysis by Application
  • Figure 58: Latin America Market Value Share and BPS Analysis by End-Use Industry, 2025 and 2035
  • Figure 59: Latin America Market Y-o-Y Growth Comparison by End-Use Industry, 2025-2035
  • Figure 60: Latin America Market Attractiveness Analysis by End-Use Industry
  • Figure 61: Western Europe Market Value Share and BPS Analysis by Country, 2025 and 2035
  • Figure 62: Western Europe Market Value Share and BPS Analysis by Paper Type, 2025 and 2035
  • Figure 63: Western Europe Market Y-o-Y Growth Comparison by Paper Type, 2025-2035
  • Figure 64: Western Europe Market Attractiveness Analysis by Paper Type
  • Figure 65: Western Europe Market Value Share and BPS Analysis by Adhesive Compatibility, 2025 and 2035
  • Figure 66: Western Europe Market Y-o-Y Growth Comparison by Adhesive Compatibility, 2025-2035
  • Figure 67: Western Europe Market Attractiveness Analysis by Adhesive Compatibility
  • Figure 68: Western Europe Market Value Share and BPS Analysis by Finish Type, 2025 and 2035
  • Figure 69: Western Europe Market Y-o-Y Growth Comparison by Finish Type, 2025-2035
  • Figure 70: Western Europe Market Attractiveness Analysis by Finish Type
  • Figure 71: Western Europe Market Value Share and BPS Analysis by Application, 2025 and 2035
  • Figure 72: Western Europe Market Y-o-Y Growth Comparison by Application, 2025-2035
  • Figure 73: Western Europe Market Attractiveness Analysis by Application
  • Figure 74: Western Europe Market Value Share and BPS Analysis by End-Use Industry, 2025 and 2035
  • Figure 75: Western Europe Market Y-o-Y Growth Comparison by End-Use Industry, 2025-2035
  • Figure 76: Western Europe Market Attractiveness Analysis by End-Use Industry
  • Figure 77: Eastern Europe Market Value Share and BPS Analysis by Country, 2025 and 2035
  • Figure 78: Eastern Europe Market Value Share and BPS Analysis by Paper Type, 2025 and 2035
  • Figure 79: Eastern Europe Market Y-o-Y Growth Comparison by Paper Type, 2025-2035
  • Figure 80: Eastern Europe Market Attractiveness Analysis by Paper Type
  • Figure 81: Eastern Europe Market Value Share and BPS Analysis by Adhesive Compatibility, 2025 and 2035
  • Figure 82: Eastern Europe Market Y-o-Y Growth Comparison by Adhesive Compatibility, 2025-2035
  • Figure 83: Eastern Europe Market Attractiveness Analysis by Adhesive Compatibility
  • Figure 84: Eastern Europe Market Value Share and BPS Analysis by Finish Type, 2025 and 2035
  • Figure 85: Eastern Europe Market Y-o-Y Growth Comparison by Finish Type, 2025-2035
  • Figure 86: Eastern Europe Market Attractiveness Analysis by Finish Type
  • Figure 87: Eastern Europe Market Value Share and BPS Analysis by Application, 2025 and 2035
  • Figure 88: Eastern Europe Market Y-o-Y Growth Comparison by Application, 2025-2035
  • Figure 89: Eastern Europe Market Attractiveness Analysis by Application
  • Figure 90: Eastern Europe Market Value Share and BPS Analysis by End-Use Industry, 2025 and 2035
  • Figure 91: Eastern Europe Market Y-o-Y Growth Comparison by End-Use Industry, 2025-2035
  • Figure 92: Eastern Europe Market Attractiveness Analysis by End-Use Industry
  • Figure 93: East Asia Market Value Share and BPS Analysis by Country, 2025 and 2035
  • Figure 94: East Asia Market Value Share and BPS Analysis by Paper Type, 2025 and 2035
  • Figure 95: East Asia Market Y-o-Y Growth Comparison by Paper Type, 2025-2035
  • Figure 96: East Asia Market Attractiveness Analysis by Paper Type
  • Figure 97: East Asia Market Value Share and BPS Analysis by Adhesive Compatibility, 2025 and 2035
  • Figure 98: East Asia Market Y-o-Y Growth Comparison by Adhesive Compatibility, 2025-2035
  • Figure 99: East Asia Market Attractiveness Analysis by Adhesive Compatibility
  • Figure 100: East Asia Market Value Share and BPS Analysis by Finish Type, 2025 and 2035
  • Figure 101: East Asia Market Y-o-Y Growth Comparison by Finish Type, 2025-2035
  • Figure 102: East Asia Market Attractiveness Analysis by Finish Type
  • Figure 103: East Asia Market Value Share and BPS Analysis by Application, 2025 and 2035
  • Figure 104: East Asia Market Y-o-Y Growth Comparison by Application, 2025-2035
  • Figure 105: East Asia Market Attractiveness Analysis by Application
  • Figure 106: East Asia Market Value Share and BPS Analysis by End-Use Industry, 2025 and 2035
  • Figure 107: East Asia Market Y-o-Y Growth Comparison by End-Use Industry, 2025-2035
  • Figure 108: East Asia Market Attractiveness Analysis by End-Use Industry
  • Figure 109: South Asia & Pacific Market Value Share and BPS Analysis by Country, 2025 and 2035
  • Figure 110: South Asia & Pacific Market Value Share and BPS Analysis by Paper Type, 2025 and 2035
  • Figure 111: South Asia & Pacific Market Y-o-Y Growth Comparison by Paper Type, 2025-2035
  • Figure 112: South Asia & Pacific Market Attractiveness Analysis by Paper Type
  • Figure 113: South Asia & Pacific Market Value Share and BPS Analysis by Adhesive Compatibility, 2025 and 2035
  • Figure 114: South Asia & Pacific Market Y-o-Y Growth Comparison by Adhesive Compatibility, 2025-2035
  • Figure 115: South Asia & Pacific Market Attractiveness Analysis by Adhesive Compatibility
  • Figure 116: South Asia & Pacific Market Value Share and BPS Analysis by Finish Type, 2025 and 2035
  • Figure 117: South Asia & Pacific Market Y-o-Y Growth Comparison by Finish Type, 2025-2035
  • Figure 118: South Asia & Pacific Market Attractiveness Analysis by Finish Type
  • Figure 119: South Asia & Pacific Market Value Share and BPS Analysis by Application, 2025 and 2035
  • Figure 120: South Asia & Pacific Market Y-o-Y Growth Comparison by Application, 2025-2035
  • Figure 121: South Asia & Pacific Market Attractiveness Analysis by Application
  • Figure 122: South Asia & Pacific Market Value Share and BPS Analysis by End-Use Industry, 2025 and 2035
  • Figure 123: South Asia & Pacific Market Y-o-Y Growth Comparison by End-Use Industry, 2025-2035
  • Figure 124: South Asia & Pacific Market Attractiveness Analysis by End-Use Industry
  • Figure 125: Middle East and Africa Market Value Share and BPS Analysis by Country, 2025 and 2035
  • Figure 126: Middle East and Africa Market Value Share and BPS Analysis by Paper Type, 2025 and 2035
  • Figure 127: Middle East and Africa Market Y-o-Y Growth Comparison by Paper Type, 2025-2035
  • Figure 128: Middle East and Africa Market Attractiveness Analysis by Paper Type
  • Figure 129: Middle East and Africa Market Value Share and BPS Analysis by Adhesive Compatibility, 2025 and 2035
  • Figure 130: Middle East and Africa Market Y-o-Y Growth Comparison by Adhesive Compatibility, 2025-2035
  • Figure 131: Middle East and Africa Market Attractiveness Analysis by Adhesive Compatibility
  • Figure 132: Middle East and Africa Market Value Share and BPS Analysis by Finish Type, 2025 and 2035
  • Figure 133: Middle East and Africa Market Y-o-Y Growth Comparison by Finish Type, 2025-2035
  • Figure 134: Middle East and Africa Market Attractiveness Analysis by Finish Type
  • Figure 135: Middle East and Africa Market Value Share and BPS Analysis by Application, 2025 and 2035
  • Figure 136: Middle East and Africa Market Y-o-Y Growth Comparison by Application, 2025-2035
  • Figure 137: Middle East and Africa Market Attractiveness Analysis by Application
  • Figure 138: Middle East and Africa Market Value Share and BPS Analysis by End-Use Industry, 2025 and 2035
  • Figure 139: Middle East and Africa Market Y-o-Y Growth Comparison by End-Use Industry, 2025-2035
  • Figure 140: Middle East and Africa Market Attractiveness Analysis by End-Use Industry
  • Figure 141: Global Market - Tier Structure Analysis
  • Figure 142: Global Market - Company Share Analysis

Frequently Asked Questions

What is the projected market value of the face paper industry by 2035?

The face paper market is expected to grow from USD 1.7 billion in 2025 to USD 2.7 billion by 2035, at a CAGR of 4.7%.

Which product type dominates the face paper market in 2025?

Coated paper leads the market with a 61% share in 2025 due to its durability and high-quality finish.

What is the most popular distribution channel for face paper products?

Tags and stickers hold the largest share at 41%, driven by demand in retail, labeling, and branding applications.

Which regions are expected to witness the highest growth in the face paper market?

Germany and China are key growth regions, each projected to grow at a 5.7% CAGR due to rising industrial and packaging demands.

Who is the leading player in the face paper industry?

UPM Adhesive Materials dominates the market with an 18% industry share, thanks to its strong product portfolio and global presence.

Explore Similar Insights

Future Market Insights

Face Paper Market