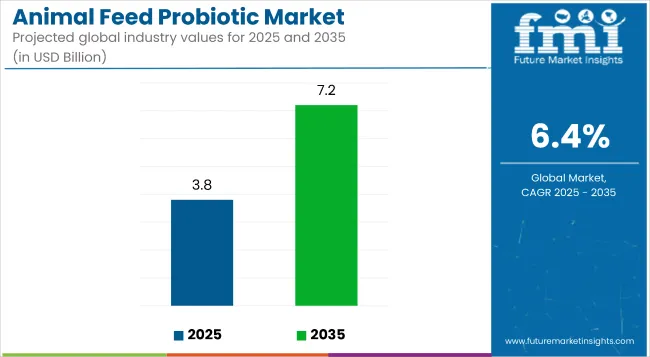
The animal feed probiotic market is projected to be valued at USD 3,645 million in 2024 and is expected to rise to USD 6,798 million by 2034. The global animal feed probiotic industry is expected to grow at a CAGR of 6.4% during the forecast period.
Key Market Drivers:
The animal feed probiotic market generated an estimated CAGR of 6.3% in 2019. In five years, the market grew at a pace of 6.4% CAGR and added a staggering revenue of USD 3,645 million in 2024, predicted to reach USD 6,798 million in the forecast period. Several reasons can be attributed to this growth:
Attributes | Key Statistics |
---|---|
Expected Base Year Value (2024) | USD 3,645 million |
Anticipated Forecast Value (2034) | USD 6,798 million |
Estimated Growth (2024 to 2034) | 6.4% CAGR |
Attributes | Details |
---|---|
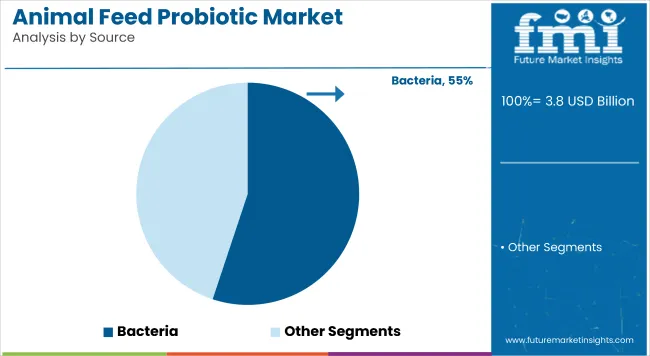
Source | Bacteria |
Market Share | 55.1% |
Based on the source, bacterial source dominates the global market with a market share of 55.1%. This rising popularity is attributed to:
Attributes | Details |
---|---|
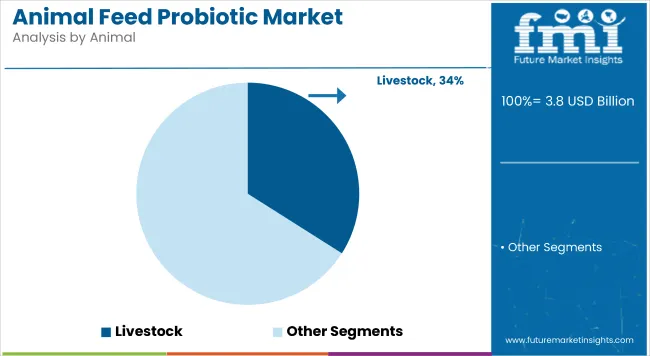
Animal | Livestock |
Market Share | 34% |
On the basis of animals, the livestock section dominates the global market with a market share of 34%. This is primarily due to:
The animal feed probiotics market is subject to the multifaceted impact of pandemics and market fluctuations, which were influenced by various factors such as disruptions in the supply chain, changes in consumer behavior, and broader economic trends. The market dynamics have evolved since January 2022. Supply chain disruptions have adversely affected the sourcing and transporting raw materials used to produce animal feed probiotics. Temporary shortages, increased prices, and challenges maintaining consistent product quality were the challenges faced back.
Some consumers prioritized essential goods, while others continued to seek high-quality and health-enhancing products, including those focused on animal nutrition. The resilience of the animal feed probiotics market depends on its ability to align with evolving consumer preferences and adapt to changing economic conditions.
Market fluctuations and economic uncertainties can impact farmers' purchasing decisions, affecting the livestock farming sector. Farmers may be more cost-conscious during economic downturns, potentially influencing their choice of feed additives.
Attributes | Key Statistics |
---|---|
Estimated Growth (2019 to 2023) | 6.2% CAGR |
Forecast Value (2023) | USD 3,594 million |
The animal feed probiotics market is anticipated to surpass a global valuation of USD 6,798 million by 2034, with a growth rate of 6.4% CAGR. While the market is expected to experience substantial growth, several restraining factors could adversely affect its development:
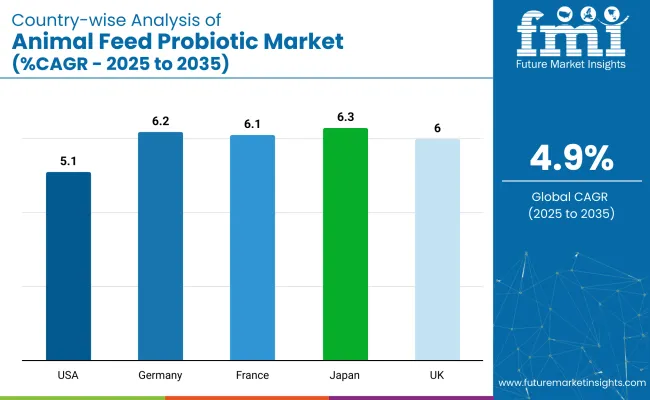
The section analyzes the animal feed probiotics market by country, including China, the United States, India, Japan, and Brazil. The table presents the CAGR for each country, indicating the expected market growth in that country through 2034.
Countries | CAGR |
---|---|
China | 6.5% |
United States | 5.1% |
India | 6.7% |
Japan | 8.0% |
Brazil | 4.5% |
China is one of the Asian countries that leads the animal feed prebiotic market. The market in China is anticipated to retain its dominance by progressing at an annual growth rate of 6.5% till 2034.
Japan is another Asian country leading the global animal feed prebiotic market. The Japanese Animal Feed Probiotic Market is anticipated to register a CAGR of 8.0% through 2034.
The United States dominates the animal feed prebiotic market in the North American region. The United States animal feed prebiotic market is anticipated to exhibit an annual growth rate of 5.1% till 2034.
India is another Asian country leading the global animal feed prebiotic market. The Indian animal feed prebiotic market is anticipated to register a CAGR of 6.7% through 2034.
Brazil is another country surging the animal feed prebiotic market. The Brazilian animal feed prebiotic market is predicted to register a CAGR of 4.5% through the forecast period.
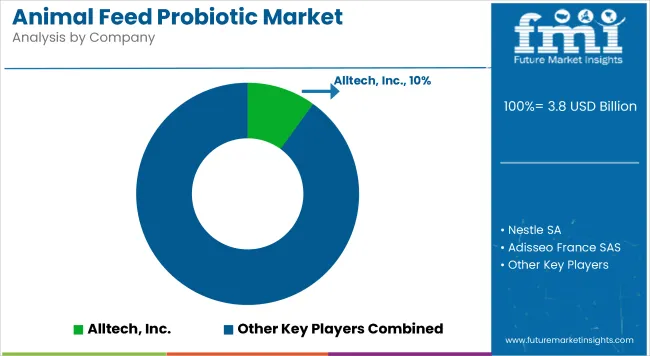
The global animal feed prebiotic market is highly fragmented, with key players such as Koninklijke DSM N.V., Alltech, Inc., Chr. Hansen Holding A/S, E. I. du Pont de Nemours and Company, Evonik Industries AG, etc. Koninklijke DSM N.V. is a company that provides cutting-edge animal nutrition solutions, including probiotics that enhance gut health and performance. It is also a global leader in microbial solutions that offer innovative bacterial probiotics to support the development of balanced gut microbiota. Additionally, a key player in the specialty chemicals industry provides advanced amino acid-based probiotics to address the evolving needs of the animal feed industry.
Recent Developments:
Report Attributes | Details |
---|---|
Current Total Market Size (2024) | USD 3,645 million |
Projected Market Size (2034) | USD 6,798 million |
CAGR (2024 to 2034) | 6.4% |
Base Year for Estimation | 2023 |
Historical Period | 2019 to 2023 |
Projections Period | 2024 to 2034 |
Quantitative Units | USD million for value and kilotons for volume |
Sources Analyzed (Segment 1) | Bacteria, Non-Bacteria |
Animal Types Analyzed (Segment 2) | Companion Animal, Livestock, Equine, Swine, Aquaculture |
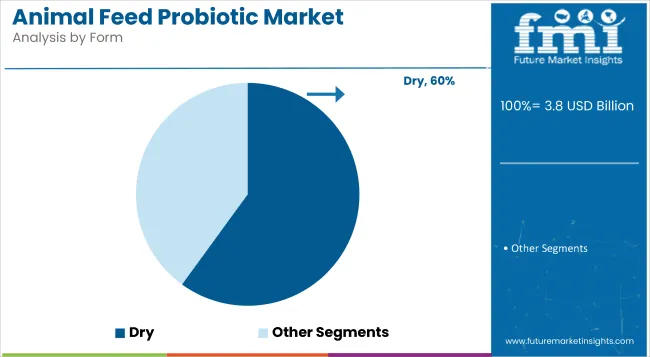
Forms Analyzed (Segment 3) | Liquid, Dry |
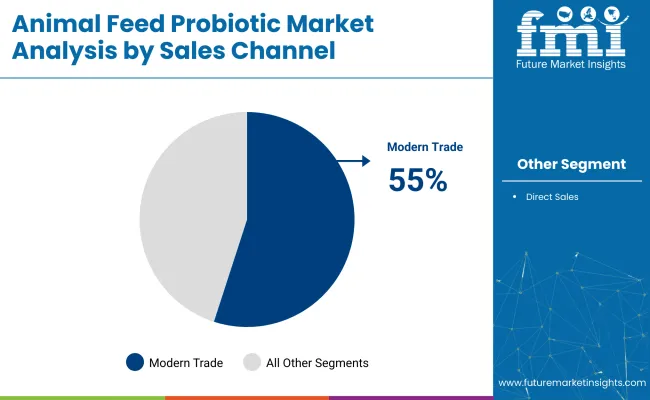
Sales Channels Analyzed (Segment 4) | Modern Trade, Direct Sales |
Regions Covered | North America; Latin America; Western Europe; Eastern Europe; South Asia and Pacific; East Asia; Middle East & Africa |
Countries Covered | United States, Canada, Mexico, Brazil, Argentina, Germany, France, United Kingdom, Italy, Spain, Netherlands, China, India, Japan, South Korea, ANZ, GCC Countries, South Africa |
Key Players influencing the Animal Feed Probiotic Market | Koninklijke DSM N.V., Alltech, Inc., Chr. Hansen Holding A/S, E. I. du Pont de Nemours and Company, Evonik Industries AG, Adisseo France SAS, Lallemand Inc., Novus International, Inc., Calpis Co., Ltd. |
Additional Attributes | Market share by source (bacteria vs non-bacteria), Adoption trends in swine and poultry feed, Regional livestock health and antibiotic-free production initiatives, R&D in strain-specific probiotic efficacy and stability, Expansion of probiotic liquid formulations for aquaculture systems |
Customization and Pricing | Customization and Pricing Available on Request |
Table 1: Global Market Value (US$ Million) Forecast by Region, 2019 to 2034
Table 2: Global Market Volume (Unit Pack) Forecast by Region, 2019 to 2034
Table 3: Global Market Value (US$ Million) Forecast by Source, 2019 to 2034
Table 4: Global Market Volume (Unit Pack) Forecast by Source, 2019 to 2034
Table 5: Global Market Value (US$ Million) Forecast by Animal, 2019 to 2034
Table 6: Global Market Volume (Unit Pack) Forecast by Animal, 2019 to 2034
Table 7: Global Market Value (US$ Million) Forecast by Form, 2019 to 2034
Table 8: Global Market Volume (Unit Pack) Forecast by Form, 2019 to 2034
Table 9: Global Market Value (US$ Million) Forecast by Sales Channel, 2019 to 2034
Table 10: Global Market Volume (Unit Pack) Forecast by Sales Channel, 2019 to 2034
Table 11: North America Market Value (US$ Million) Forecast by Country, 2019 to 2034
Table 12: North America Market Volume (Unit Pack) Forecast by Country, 2019 to 2034
Table 13: North America Market Value (US$ Million) Forecast by Source, 2019 to 2034
Table 14: North America Market Volume (Unit Pack) Forecast by Source, 2019 to 2034
Table 15: North America Market Value (US$ Million) Forecast by Animal, 2019 to 2034
Table 16: North America Market Volume (Unit Pack) Forecast by Animal, 2019 to 2034
Table 17: North America Market Value (US$ Million) Forecast by Form, 2019 to 2034
Table 18: North America Market Volume (Unit Pack) Forecast by Form, 2019 to 2034
Table 19: North America Market Value (US$ Million) Forecast by Sales Channel, 2019 to 2034
Table 20: North America Market Volume (Unit Pack) Forecast by Sales Channel, 2019 to 2034
Table 21: Latin America Market Value (US$ Million) Forecast by Country, 2019 to 2034
Table 22: Latin America Market Volume (Unit Pack) Forecast by Country, 2019 to 2034
Table 23: Latin America Market Value (US$ Million) Forecast by Source, 2019 to 2034
Table 24: Latin America Market Volume (Unit Pack) Forecast by Source, 2019 to 2034
Table 25: Latin America Market Value (US$ Million) Forecast by Animal, 2019 to 2034
Table 26: Latin America Market Volume (Unit Pack) Forecast by Animal, 2019 to 2034
Table 27: Latin America Market Value (US$ Million) Forecast by Form, 2019 to 2034
Table 28: Latin America Market Volume (Unit Pack) Forecast by Form, 2019 to 2034
Table 29: Latin America Market Value (US$ Million) Forecast by Sales Channel, 2019 to 2034
Table 30: Latin America Market Volume (Unit Pack) Forecast by Sales Channel, 2019 to 2034
Table 31: Western Europe Market Value (US$ Million) Forecast by Country, 2019 to 2034
Table 32: Western Europe Market Volume (Unit Pack) Forecast by Country, 2019 to 2034
Table 33: Western Europe Market Value (US$ Million) Forecast by Source, 2019 to 2034
Table 34: Western Europe Market Volume (Unit Pack) Forecast by Source, 2019 to 2034
Table 35: Western Europe Market Value (US$ Million) Forecast by Animal, 2019 to 2034
Table 36: Western Europe Market Volume (Unit Pack) Forecast by Animal, 2019 to 2034
Table 37: Western Europe Market Value (US$ Million) Forecast by Form, 2019 to 2034
Table 38: Western Europe Market Volume (Unit Pack) Forecast by Form, 2019 to 2034
Table 39: Western Europe Market Value (US$ Million) Forecast by Sales Channel, 2019 to 2034
Table 40: Western Europe Market Volume (Unit Pack) Forecast by Sales Channel, 2019 to 2034
Table 41: Eastern Europe Market Value (US$ Million) Forecast by Country, 2019 to 2034
Table 42: Eastern Europe Market Volume (Unit Pack) Forecast by Country, 2019 to 2034
Table 43: Eastern Europe Market Value (US$ Million) Forecast by Source, 2019 to 2034
Table 44: Eastern Europe Market Volume (Unit Pack) Forecast by Source, 2019 to 2034
Table 45: Eastern Europe Market Value (US$ Million) Forecast by Animal, 2019 to 2034
Table 46: Eastern Europe Market Volume (Unit Pack) Forecast by Animal, 2019 to 2034
Table 47: Eastern Europe Market Value (US$ Million) Forecast by Form, 2019 to 2034
Table 48: Eastern Europe Market Volume (Unit Pack) Forecast by Form, 2019 to 2034
Table 49: Eastern Europe Market Value (US$ Million) Forecast by Sales Channel, 2019 to 2034
Table 50: Eastern Europe Market Volume (Unit Pack) Forecast by Sales Channel, 2019 to 2034
Table 51: South Asia and Pacific Market Value (US$ Million) Forecast by Country, 2019 to 2034
Table 52: South Asia and Pacific Market Volume (Unit Pack) Forecast by Country, 2019 to 2034
Table 53: South Asia and Pacific Market Value (US$ Million) Forecast by Source, 2019 to 2034
Table 54: South Asia and Pacific Market Volume (Unit Pack) Forecast by Source, 2019 to 2034
Table 55: South Asia and Pacific Market Value (US$ Million) Forecast by Animal, 2019 to 2034
Table 56: South Asia and Pacific Market Volume (Unit Pack) Forecast by Animal, 2019 to 2034
Table 57: South Asia and Pacific Market Value (US$ Million) Forecast by Form, 2019 to 2034
Table 58: South Asia and Pacific Market Volume (Unit Pack) Forecast by Form, 2019 to 2034
Table 59: South Asia and Pacific Market Value (US$ Million) Forecast by Sales Channel, 2019 to 2034
Table 60: South Asia and Pacific Market Volume (Unit Pack) Forecast by Sales Channel, 2019 to 2034
Table 61: East Asia Market Value (US$ Million) Forecast by Country, 2019 to 2034
Table 62: East Asia Market Volume (Unit Pack) Forecast by Country, 2019 to 2034
Table 63: East Asia Market Value (US$ Million) Forecast by Source, 2019 to 2034
Table 64: East Asia Market Volume (Unit Pack) Forecast by Source, 2019 to 2034
Table 65: East Asia Market Value (US$ Million) Forecast by Animal, 2019 to 2034
Table 66: East Asia Market Volume (Unit Pack) Forecast by Animal, 2019 to 2034
Table 67: East Asia Market Value (US$ Million) Forecast by Form, 2019 to 2034
Table 68: East Asia Market Volume (Unit Pack) Forecast by Form, 2019 to 2034
Table 69: East Asia Market Value (US$ Million) Forecast by Sales Channel, 2019 to 2034
Table 70: East Asia Market Volume (Unit Pack) Forecast by Sales Channel, 2019 to 2034
Table 71: Middle East and Africa Market Value (US$ Million) Forecast by Country, 2019 to 2034
Table 72: Middle East and Africa Market Volume (Unit Pack) Forecast by Country, 2019 to 2034
Table 73: Middle East and Africa Market Value (US$ Million) Forecast by Source, 2019 to 2034
Table 74: Middle East and Africa Market Volume (Unit Pack) Forecast by Source, 2019 to 2034
Table 75: Middle East and Africa Market Value (US$ Million) Forecast by Animal, 2019 to 2034
Table 76: Middle East and Africa Market Volume (Unit Pack) Forecast by Animal, 2019 to 2034
Table 77: Middle East and Africa Market Value (US$ Million) Forecast by Form, 2019 to 2034
Table 78: Middle East and Africa Market Volume (Unit Pack) Forecast by Form, 2019 to 2034
Table 79: Middle East and Africa Market Value (US$ Million) Forecast by Sales Channel, 2019 to 2034
Table 80: Middle East and Africa Market Volume (Unit Pack) Forecast by Sales Channel, 2019 to 2034
Figure 1: Global Market Value (US$ Million) by Source, 2024 to 2034
Figure 2: Global Market Value (US$ Million) by Animal, 2024 to 2034
Figure 3: Global Market Value (US$ Million) by Form, 2024 to 2034
Figure 4: Global Market Value (US$ Million) by Sales Channel, 2024 to 2034
Figure 5: Global Market Value (US$ Million) by Region, 2024 to 2034
Figure 6: Global Market Value (US$ Million) Analysis by Region, 2019 to 2034
Figure 7: Global Market Volume (Unit Pack) Analysis by Region, 2019 to 2034
Figure 8: Global Market Value Share (%) and BPS Analysis by Region, 2024 to 2034
Figure 9: Global Market Y-o-Y Growth (%) Projections by Region, 2024 to 2034
Figure 10: Global Market Value (US$ Million) Analysis by Source, 2019 to 2034
Figure 11: Global Market Volume (Unit Pack) Analysis by Source, 2019 to 2034
Figure 12: Global Market Value Share (%) and BPS Analysis by Source, 2024 to 2034
Figure 13: Global Market Y-o-Y Growth (%) Projections by Source, 2024 to 2034
Figure 14: Global Market Value (US$ Million) Analysis by Animal, 2019 to 2034
Figure 15: Global Market Volume (Unit Pack) Analysis by Animal, 2019 to 2034
Figure 16: Global Market Value Share (%) and BPS Analysis by Animal, 2024 to 2034
Figure 17: Global Market Y-o-Y Growth (%) Projections by Animal, 2024 to 2034
Figure 18: Global Market Value (US$ Million) Analysis by Form, 2019 to 2034
Figure 19: Global Market Volume (Unit Pack) Analysis by Form, 2019 to 2034
Figure 20: Global Market Value Share (%) and BPS Analysis by Form, 2024 to 2034
Figure 21: Global Market Y-o-Y Growth (%) Projections by Form, 2024 to 2034
Figure 22: Global Market Value (US$ Million) Analysis by Sales Channel, 2019 to 2034
Figure 23: Global Market Volume (Unit Pack) Analysis by Sales Channel, 2019 to 2034
Figure 24: Global Market Value Share (%) and BPS Analysis by Sales Channel, 2024 to 2034
Figure 25: Global Market Y-o-Y Growth (%) Projections by Sales Channel, 2024 to 2034
Figure 26: Global Market Attractiveness by Source, 2024 to 2034
Figure 27: Global Market Attractiveness by Animal, 2024 to 2034
Figure 28: Global Market Attractiveness by Form, 2024 to 2034
Figure 29: Global Market Attractiveness by Sales Channel, 2024 to 2034
Figure 30: Global Market Attractiveness by Region, 2024 to 2034
Figure 31: North America Market Value (US$ Million) by Source, 2024 to 2034
Figure 32: North America Market Value (US$ Million) by Animal, 2024 to 2034
Figure 33: North America Market Value (US$ Million) by Form, 2024 to 2034
Figure 34: North America Market Value (US$ Million) by Sales Channel, 2024 to 2034
Figure 35: North America Market Value (US$ Million) by Country, 2024 to 2034
Figure 36: North America Market Value (US$ Million) Analysis by Country, 2019 to 2034
Figure 37: North America Market Volume (Unit Pack) Analysis by Country, 2019 to 2034
Figure 38: North America Market Value Share (%) and BPS Analysis by Country, 2024 to 2034
Figure 39: North America Market Y-o-Y Growth (%) Projections by Country, 2024 to 2034
Figure 40: North America Market Value (US$ Million) Analysis by Source, 2019 to 2034
Figure 41: North America Market Volume (Unit Pack) Analysis by Source, 2019 to 2034
Figure 42: North America Market Value Share (%) and BPS Analysis by Source, 2024 to 2034
Figure 43: North America Market Y-o-Y Growth (%) Projections by Source, 2024 to 2034
Figure 44: North America Market Value (US$ Million) Analysis by Animal, 2019 to 2034
Figure 45: North America Market Volume (Unit Pack) Analysis by Animal, 2019 to 2034
Figure 46: North America Market Value Share (%) and BPS Analysis by Animal, 2024 to 2034
Figure 47: North America Market Y-o-Y Growth (%) Projections by Animal, 2024 to 2034
Figure 48: North America Market Value (US$ Million) Analysis by Form, 2019 to 2034
Figure 49: North America Market Volume (Unit Pack) Analysis by Form, 2019 to 2034
Figure 50: North America Market Value Share (%) and BPS Analysis by Form, 2024 to 2034
Figure 51: North America Market Y-o-Y Growth (%) Projections by Form, 2024 to 2034
Figure 52: North America Market Value (US$ Million) Analysis by Sales Channel, 2019 to 2034
Figure 53: North America Market Volume (Unit Pack) Analysis by Sales Channel, 2019 to 2034
Figure 54: North America Market Value Share (%) and BPS Analysis by Sales Channel, 2024 to 2034
Figure 55: North America Market Y-o-Y Growth (%) Projections by Sales Channel, 2024 to 2034
Figure 56: North America Market Attractiveness by Source, 2024 to 2034
Figure 57: North America Market Attractiveness by Animal, 2024 to 2034
Figure 58: North America Market Attractiveness by Form, 2024 to 2034
Figure 59: North America Market Attractiveness by Sales Channel, 2024 to 2034
Figure 60: North America Market Attractiveness by Country, 2024 to 2034
Figure 61: Latin America Market Value (US$ Million) by Source, 2024 to 2034
Figure 62: Latin America Market Value (US$ Million) by Animal, 2024 to 2034
Figure 63: Latin America Market Value (US$ Million) by Form, 2024 to 2034
Figure 64: Latin America Market Value (US$ Million) by Sales Channel, 2024 to 2034
Figure 65: Latin America Market Value (US$ Million) by Country, 2024 to 2034
Figure 66: Latin America Market Value (US$ Million) Analysis by Country, 2019 to 2034
Figure 67: Latin America Market Volume (Unit Pack) Analysis by Country, 2019 to 2034
Figure 68: Latin America Market Value Share (%) and BPS Analysis by Country, 2024 to 2034
Figure 69: Latin America Market Y-o-Y Growth (%) Projections by Country, 2024 to 2034
Figure 70: Latin America Market Value (US$ Million) Analysis by Source, 2019 to 2034
Figure 71: Latin America Market Volume (Unit Pack) Analysis by Source, 2019 to 2034
Figure 72: Latin America Market Value Share (%) and BPS Analysis by Source, 2024 to 2034
Figure 73: Latin America Market Y-o-Y Growth (%) Projections by Source, 2024 to 2034
Figure 74: Latin America Market Value (US$ Million) Analysis by Animal, 2019 to 2034
Figure 75: Latin America Market Volume (Unit Pack) Analysis by Animal, 2019 to 2034
Figure 76: Latin America Market Value Share (%) and BPS Analysis by Animal, 2024 to 2034
Figure 77: Latin America Market Y-o-Y Growth (%) Projections by Animal, 2024 to 2034
Figure 78: Latin America Market Value (US$ Million) Analysis by Form, 2019 to 2034
Figure 79: Latin America Market Volume (Unit Pack) Analysis by Form, 2019 to 2034
Figure 80: Latin America Market Value Share (%) and BPS Analysis by Form, 2024 to 2034
Figure 81: Latin America Market Y-o-Y Growth (%) Projections by Form, 2024 to 2034
Figure 82: Latin America Market Value (US$ Million) Analysis by Sales Channel, 2019 to 2034
Figure 83: Latin America Market Volume (Unit Pack) Analysis by Sales Channel, 2019 to 2034
Figure 84: Latin America Market Value Share (%) and BPS Analysis by Sales Channel, 2024 to 2034
Figure 85: Latin America Market Y-o-Y Growth (%) Projections by Sales Channel, 2024 to 2034
Figure 86: Latin America Market Attractiveness by Source, 2024 to 2034
Figure 87: Latin America Market Attractiveness by Animal, 2024 to 2034
Figure 88: Latin America Market Attractiveness by Form, 2024 to 2034
Figure 89: Latin America Market Attractiveness by Sales Channel, 2024 to 2034
Figure 90: Latin America Market Attractiveness by Country, 2024 to 2034
Figure 91: Western Europe Market Value (US$ Million) by Source, 2024 to 2034
Figure 92: Western Europe Market Value (US$ Million) by Animal, 2024 to 2034
Figure 93: Western Europe Market Value (US$ Million) by Form, 2024 to 2034
Figure 94: Western Europe Market Value (US$ Million) by Sales Channel, 2024 to 2034
Figure 95: Western Europe Market Value (US$ Million) by Country, 2024 to 2034
Figure 96: Western Europe Market Value (US$ Million) Analysis by Country, 2019 to 2034
Figure 97: Western Europe Market Volume (Unit Pack) Analysis by Country, 2019 to 2034
Figure 98: Western Europe Market Value Share (%) and BPS Analysis by Country, 2024 to 2034
Figure 99: Western Europe Market Y-o-Y Growth (%) Projections by Country, 2024 to 2034
Figure 100: Western Europe Market Value (US$ Million) Analysis by Source, 2019 to 2034
Figure 101: Western Europe Market Volume (Unit Pack) Analysis by Source, 2019 to 2034
Figure 102: Western Europe Market Value Share (%) and BPS Analysis by Source, 2024 to 2034
Figure 103: Western Europe Market Y-o-Y Growth (%) Projections by Source, 2024 to 2034
Figure 104: Western Europe Market Value (US$ Million) Analysis by Animal, 2019 to 2034
Figure 105: Western Europe Market Volume (Unit Pack) Analysis by Animal, 2019 to 2034
Figure 106: Western Europe Market Value Share (%) and BPS Analysis by Animal, 2024 to 2034
Figure 107: Western Europe Market Y-o-Y Growth (%) Projections by Animal, 2024 to 2034
Figure 108: Western Europe Market Value (US$ Million) Analysis by Form, 2019 to 2034
Figure 109: Western Europe Market Volume (Unit Pack) Analysis by Form, 2019 to 2034
Figure 110: Western Europe Market Value Share (%) and BPS Analysis by Form, 2024 to 2034
Figure 111: Western Europe Market Y-o-Y Growth (%) Projections by Form, 2024 to 2034
Figure 112: Western Europe Market Value (US$ Million) Analysis by Sales Channel, 2019 to 2034
Figure 113: Western Europe Market Volume (Unit Pack) Analysis by Sales Channel, 2019 to 2034
Figure 114: Western Europe Market Value Share (%) and BPS Analysis by Sales Channel, 2024 to 2034
Figure 115: Western Europe Market Y-o-Y Growth (%) Projections by Sales Channel, 2024 to 2034
Figure 116: Western Europe Market Attractiveness by Source, 2024 to 2034
Figure 117: Western Europe Market Attractiveness by Animal, 2024 to 2034
Figure 118: Western Europe Market Attractiveness by Form, 2024 to 2034
Figure 119: Western Europe Market Attractiveness by Sales Channel, 2024 to 2034
Figure 120: Western Europe Market Attractiveness by Country, 2024 to 2034
Figure 121: Eastern Europe Market Value (US$ Million) by Source, 2024 to 2034
Figure 122: Eastern Europe Market Value (US$ Million) by Animal, 2024 to 2034
Figure 123: Eastern Europe Market Value (US$ Million) by Form, 2024 to 2034
Figure 124: Eastern Europe Market Value (US$ Million) by Sales Channel, 2024 to 2034
Figure 125: Eastern Europe Market Value (US$ Million) by Country, 2024 to 2034
Figure 126: Eastern Europe Market Value (US$ Million) Analysis by Country, 2019 to 2034
Figure 127: Eastern Europe Market Volume (Unit Pack) Analysis by Country, 2019 to 2034
Figure 128: Eastern Europe Market Value Share (%) and BPS Analysis by Country, 2024 to 2034
Figure 129: Eastern Europe Market Y-o-Y Growth (%) Projections by Country, 2024 to 2034
Figure 130: Eastern Europe Market Value (US$ Million) Analysis by Source, 2019 to 2034
Figure 131: Eastern Europe Market Volume (Unit Pack) Analysis by Source, 2019 to 2034
Figure 132: Eastern Europe Market Value Share (%) and BPS Analysis by Source, 2024 to 2034
Figure 133: Eastern Europe Market Y-o-Y Growth (%) Projections by Source, 2024 to 2034
Figure 134: Eastern Europe Market Value (US$ Million) Analysis by Animal, 2019 to 2034
Figure 135: Eastern Europe Market Volume (Unit Pack) Analysis by Animal, 2019 to 2034
Figure 136: Eastern Europe Market Value Share (%) and BPS Analysis by Animal, 2024 to 2034
Figure 137: Eastern Europe Market Y-o-Y Growth (%) Projections by Animal, 2024 to 2034
Figure 138: Eastern Europe Market Value (US$ Million) Analysis by Form, 2019 to 2034
Figure 139: Eastern Europe Market Volume (Unit Pack) Analysis by Form, 2019 to 2034
Figure 140: Eastern Europe Market Value Share (%) and BPS Analysis by Form, 2024 to 2034
Figure 141: Eastern Europe Market Y-o-Y Growth (%) Projections by Form, 2024 to 2034
Figure 142: Eastern Europe Market Value (US$ Million) Analysis by Sales Channel, 2019 to 2034
Figure 143: Eastern Europe Market Volume (Unit Pack) Analysis by Sales Channel, 2019 to 2034
Figure 144: Eastern Europe Market Value Share (%) and BPS Analysis by Sales Channel, 2024 to 2034
Figure 145: Eastern Europe Market Y-o-Y Growth (%) Projections by Sales Channel, 2024 to 2034
Figure 146: Eastern Europe Market Attractiveness by Source, 2024 to 2034
Figure 147: Eastern Europe Market Attractiveness by Animal, 2024 to 2034
Figure 148: Eastern Europe Market Attractiveness by Form, 2024 to 2034
Figure 149: Eastern Europe Market Attractiveness by Sales Channel, 2024 to 2034
Figure 150: Eastern Europe Market Attractiveness by Country, 2024 to 2034
Figure 151: South Asia and Pacific Market Value (US$ Million) by Source, 2024 to 2034
Figure 152: South Asia and Pacific Market Value (US$ Million) by Animal, 2024 to 2034
Figure 153: South Asia and Pacific Market Value (US$ Million) by Form, 2024 to 2034
Figure 154: South Asia and Pacific Market Value (US$ Million) by Sales Channel, 2024 to 2034
Figure 155: South Asia and Pacific Market Value (US$ Million) by Country, 2024 to 2034
Figure 156: South Asia and Pacific Market Value (US$ Million) Analysis by Country, 2019 to 2034
Figure 157: South Asia and Pacific Market Volume (Unit Pack) Analysis by Country, 2019 to 2034
Figure 158: South Asia and Pacific Market Value Share (%) and BPS Analysis by Country, 2024 to 2034
Figure 159: South Asia and Pacific Market Y-o-Y Growth (%) Projections by Country, 2024 to 2034
Figure 160: South Asia and Pacific Market Value (US$ Million) Analysis by Source, 2019 to 2034
Figure 161: South Asia and Pacific Market Volume (Unit Pack) Analysis by Source, 2019 to 2034
Figure 162: South Asia and Pacific Market Value Share (%) and BPS Analysis by Source, 2024 to 2034
Figure 163: South Asia and Pacific Market Y-o-Y Growth (%) Projections by Source, 2024 to 2034
Figure 164: South Asia and Pacific Market Value (US$ Million) Analysis by Animal, 2019 to 2034
Figure 165: South Asia and Pacific Market Volume (Unit Pack) Analysis by Animal, 2019 to 2034
Figure 166: South Asia and Pacific Market Value Share (%) and BPS Analysis by Animal, 2024 to 2034
Figure 167: South Asia and Pacific Market Y-o-Y Growth (%) Projections by Animal, 2024 to 2034
Figure 168: South Asia and Pacific Market Value (US$ Million) Analysis by Form, 2019 to 2034
Figure 169: South Asia and Pacific Market Volume (Unit Pack) Analysis by Form, 2019 to 2034
Figure 170: South Asia and Pacific Market Value Share (%) and BPS Analysis by Form, 2024 to 2034
Figure 171: South Asia and Pacific Market Y-o-Y Growth (%) Projections by Form, 2024 to 2034
Figure 172: South Asia and Pacific Market Value (US$ Million) Analysis by Sales Channel, 2019 to 2034
Figure 173: South Asia and Pacific Market Volume (Unit Pack) Analysis by Sales Channel, 2019 to 2034
Figure 174: South Asia and Pacific Market Value Share (%) and BPS Analysis by Sales Channel, 2024 to 2034
Figure 175: South Asia and Pacific Market Y-o-Y Growth (%) Projections by Sales Channel, 2024 to 2034
Figure 176: South Asia and Pacific Market Attractiveness by Source, 2024 to 2034
Figure 177: South Asia and Pacific Market Attractiveness by Animal, 2024 to 2034
Figure 178: South Asia and Pacific Market Attractiveness by Form, 2024 to 2034
Figure 179: South Asia and Pacific Market Attractiveness by Sales Channel, 2024 to 2034
Figure 180: South Asia and Pacific Market Attractiveness by Country, 2024 to 2034
Figure 181: East Asia Market Value (US$ Million) by Source, 2024 to 2034
Figure 182: East Asia Market Value (US$ Million) by Animal, 2024 to 2034
Figure 183: East Asia Market Value (US$ Million) by Form, 2024 to 2034
Figure 184: East Asia Market Value (US$ Million) by Sales Channel, 2024 to 2034
Figure 185: East Asia Market Value (US$ Million) by Country, 2024 to 2034
Figure 186: East Asia Market Value (US$ Million) Analysis by Country, 2019 to 2034
Figure 187: East Asia Market Volume (Unit Pack) Analysis by Country, 2019 to 2034
Figure 188: East Asia Market Value Share (%) and BPS Analysis by Country, 2024 to 2034
Figure 189: East Asia Market Y-o-Y Growth (%) Projections by Country, 2024 to 2034
Figure 190: East Asia Market Value (US$ Million) Analysis by Source, 2019 to 2034
Figure 191: East Asia Market Volume (Unit Pack) Analysis by Source, 2019 to 2034
Figure 192: East Asia Market Value Share (%) and BPS Analysis by Source, 2024 to 2034
Figure 193: East Asia Market Y-o-Y Growth (%) Projections by Source, 2024 to 2034
Figure 194: East Asia Market Value (US$ Million) Analysis by Animal, 2019 to 2034
Figure 195: East Asia Market Volume (Unit Pack) Analysis by Animal, 2019 to 2034
Figure 196: East Asia Market Value Share (%) and BPS Analysis by Animal, 2024 to 2034
Figure 197: East Asia Market Y-o-Y Growth (%) Projections by Animal, 2024 to 2034
Figure 198: East Asia Market Value (US$ Million) Analysis by Form, 2019 to 2034
Figure 199: East Asia Market Volume (Unit Pack) Analysis by Form, 2019 to 2034
Figure 200: East Asia Market Value Share (%) and BPS Analysis by Form, 2024 to 2034
Figure 201: East Asia Market Y-o-Y Growth (%) Projections by Form, 2024 to 2034
Figure 202: East Asia Market Value (US$ Million) Analysis by Sales Channel, 2019 to 2034
Figure 203: East Asia Market Volume (Unit Pack) Analysis by Sales Channel, 2019 to 2034
Figure 204: East Asia Market Value Share (%) and BPS Analysis by Sales Channel, 2024 to 2034
Figure 205: East Asia Market Y-o-Y Growth (%) Projections by Sales Channel, 2024 to 2034
Figure 206: East Asia Market Attractiveness by Source, 2024 to 2034
Figure 207: East Asia Market Attractiveness by Animal, 2024 to 2034
Figure 208: East Asia Market Attractiveness by Form, 2024 to 2034
Figure 209: East Asia Market Attractiveness by Sales Channel, 2024 to 2034
Figure 210: East Asia Market Attractiveness by Country, 2024 to 2034
Figure 211: Middle East and Africa Market Value (US$ Million) by Source, 2024 to 2034
Figure 212: Middle East and Africa Market Value (US$ Million) by Animal, 2024 to 2034
Figure 213: Middle East and Africa Market Value (US$ Million) by Form, 2024 to 2034
Figure 214: Middle East and Africa Market Value (US$ Million) by Sales Channel, 2024 to 2034
Figure 215: Middle East and Africa Market Value (US$ Million) by Country, 2024 to 2034
Figure 216: Middle East and Africa Market Value (US$ Million) Analysis by Country, 2019 to 2034
Figure 217: Middle East and Africa Market Volume (Unit Pack) Analysis by Country, 2019 to 2034
Figure 218: Middle East and Africa Market Value Share (%) and BPS Analysis by Country, 2024 to 2034
Figure 219: Middle East and Africa Market Y-o-Y Growth (%) Projections by Country, 2024 to 2034
Figure 220: Middle East and Africa Market Value (US$ Million) Analysis by Source, 2019 to 2034
Figure 221: Middle East and Africa Market Volume (Unit Pack) Analysis by Source, 2019 to 2034
Figure 222: Middle East and Africa Market Value Share (%) and BPS Analysis by Source, 2024 to 2034
Figure 223: Middle East and Africa Market Y-o-Y Growth (%) Projections by Source, 2024 to 2034
Figure 224: Middle East and Africa Market Value (US$ Million) Analysis by Animal, 2019 to 2034
Figure 225: Middle East and Africa Market Volume (Unit Pack) Analysis by Animal, 2019 to 2034
Figure 226: Middle East and Africa Market Value Share (%) and BPS Analysis by Animal, 2024 to 2034
Figure 227: Middle East and Africa Market Y-o-Y Growth (%) Projections by Animal, 2024 to 2034
Figure 228: Middle East and Africa Market Value (US$ Million) Analysis by Form, 2019 to 2034
Figure 229: Middle East and Africa Market Volume (Unit Pack) Analysis by Form, 2019 to 2034
Figure 230: Middle East and Africa Market Value Share (%) and BPS Analysis by Form, 2024 to 2034
Figure 231: Middle East and Africa Market Y-o-Y Growth (%) Projections by Form, 2024 to 2034
Figure 232: Middle East and Africa Market Value (US$ Million) Analysis by Sales Channel, 2019 to 2034
Figure 233: Middle East and Africa Market Volume (Unit Pack) Analysis by Sales Channel, 2019 to 2034
Figure 234: Middle East and Africa Market Value Share (%) and BPS Analysis by Sales Channel, 2024 to 2034
Figure 235: Middle East and Africa Market Y-o-Y Growth (%) Projections by Sales Channel, 2024 to 2034
Figure 236: Middle East and Africa Market Attractiveness by Source, 2024 to 2034
Figure 237: Middle East and Africa Market Attractiveness by Animal, 2024 to 2034
Figure 238: Middle East and Africa Market Attractiveness by Form, 2024 to 2034
Figure 239: Middle East and Africa Market Attractiveness by Sales Channel, 2024 to 2034
Figure 240: Middle East and Africa Market Attractiveness by Country, 2024 to 2034
The global animal feed probiotic market is expected to be worth USD 3,645 million by 2024.
The market for animal feed probiotics is expected to reach USD 6,798 million by 2034.
The animal feed probiotic market is growing at a CAGR of 6.4% from 2024 to 2034.
Some of the key players in the market are Koninklijke DSM N.V., Alltech, Inc., Chr. Hansen Holding A/S, E. I. du Pont de Nemours and Company, Evonik Industries AG, etc.
Bacterial is the most preferred source, dominating the market with a 55.1% share.
Explore Similar Insights
Thank you!
You will receive an email from our Business Development Manager. Please be sure to check your SPAM/JUNK folder too.