
- Market Size (2026)
- USD 854.9 Mn
- Forecast (2036)
- USD 2138.0 Mn
- CAGR (2026 to 2036)
- 9.6%
How Big is the Fertility Treatment Nutrition Market in 2026?
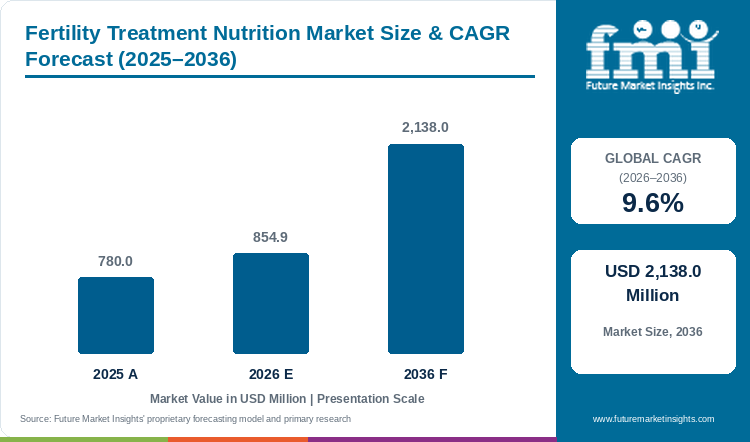
Sales of fertility treatment nutrition will expand at a 9.6% CAGR from 2026 to 2036. Valued at USD 780 Million in 2025, the market will reach USD 854.9 Million in 2026 and USD 2,138.0 Million by 2036.
Among adjacent markets, the personalized fertility care market will hold the largest opportunity. Demand will add USD 2.5 Billion at an 11% CAGR as clinics tailor treatment plans with diagnostics and genomics. The prenatal nutrition market will contribute USD 1.2 Billion at 8.4% CAGR through 2035, as brands follow women from preconception into pregnancy. The folic acid market is projected to add a smaller USD 480.4 Million at 4.6%. As per FMI's analysis, fertility treatment nutrition suppliers will find the best ROI in treatment-stage packs sold beside clinic pathways.
In July 2026, CDC guidance recommends 400 micrograms of folic acid daily before conception [1]. The American Society for Reproductive Medicine announced in March 2026 that 364 U.S. clinics reported 449,772 IVF treatment cycles in 2024, based on data compiled by SART-member fertility clinics [2]. These assisted reproductive technology pathways will add points for patients to start a nutrition routine.
Key Takeaways
- Fertility treatment nutrition market size will rise from USD 854.9 Million in 2026 to USD 2,138.0 Million by 2036, at a 9.6% CAGR.
- Preconception multinutrients will take 45.6% of product type revenue in 2026, and capsules / softgels 42.4% of form revenue.
- South Korea will grow fastest at a 9.9% CAGR through 2036, followed by the USA at 9.2%, with Japan the slowest at 7.7%.
Analyst Perspective
“Fertility nutrition brands keeping supplement claims apart from treatment outcomes will hold buyers longer. A multinutrient base paired with optional male or treatment-stage modules will bring the most durable repeat purchasing.”
Anurag Sharma, Principal Consultant, Future Market Insights
How is the Fertility Treatment Nutrition Market Segmented?
The market is analyzed by Product Type, User, Treatment Context, Form, Sales Channel, and Region.
The report covers product type, user, treatment context, form, sales channel, and region. The fertility treatment nutrition market is segmented by product type, user, treatment context, form, sales channel, and region. By product type, the market covers preconception multinutrients, CoQ10 and antioxidant blends, IVF-support protocol packs, male fertility nutrition, and others. Based on user, FMI's report studies products for females, males, and couples’ packs. By treatment context, demand is analyzed across natural conception support, IUI/IVF adjunct use, egg and sperm freezing preparation, and others. Form covers capsules and softgels, powders, gummies, and others. Sales channels include online/DTC, retail pharmacy, supermarkets and hypermarkets, specialty and health stores, and others. FMI also studies the market across 7 regions and 30+ countries.
What Makes Preconception Multinutrients Central to the Product Type Category?
With a 45.6% share in 2026, preconception multinutrients will drive demand for product type.
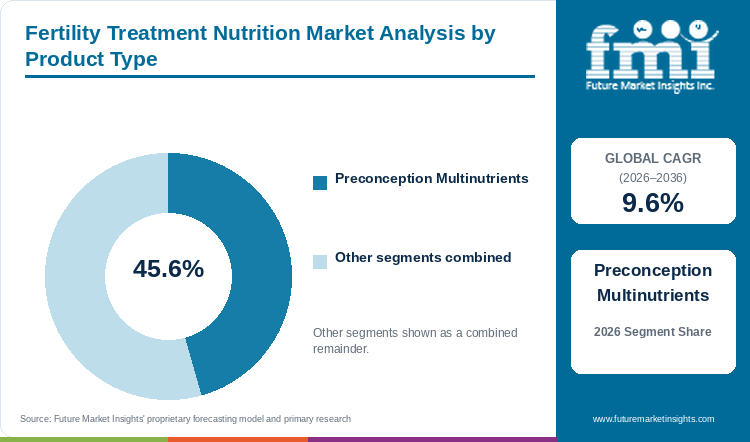
Demand for preconception multinutrients will remain high during the forecast period. IVF-Support Protocol Packs and Male Fertility Nutrition will gain relevance as consumers move toward specific fertility concerns. The multinutrient will enter the routine earlier and stay the base as targeted products are added.
- By product type, preconception multinutrients will account for 45.6% market share in 2026.
- Theralogix announced OvaNAD+ in March 2026 as a targeted egg-quality supplement, layered on top of the broader preconception base [3].
Why does Female Lead the User Category?
Female users will account for 50.9% of user demand in 2026.
Female users lead as preconception guidance and fertility-treatment workflows reach women earlier than male partners. As a result, building a larger habit for female fertility nutrition becomes easier. Male and couples’ packs still matter as infertility assessment increasingly treats conception as a shared pathway.
- By user, female users will hold 50.9% market share in 2026.
- Needed sells Sperm Support+, a 15-nutrient male formula with NAC, pre/probiotics and Shilajit, inside a Men's Fertility Support Plan [4].
How does Natural Conception Support Shape the Treatment Category?
By treatment, natural conception support will hold 45.1% in 2026.
Demand for natural conception will remain the highest as purchases start before a consumer enters fertility treatment. IUI / IVF adjunct and egg / sperm freezing prep are narrower, yet clearer timing will support higher-value protocol packs built around a three-month routine.
- By treatment context, natural conception support will hold 45.1% market share in 2026.
- Bird&Be expanded from 300 to nearly 1,000 Ulta Beauty stores by spring 2026 with Female Fertility Power Prenatal and Male Fertility Power Prenatal, bringing natural-conception products into mass beauty retail. [5].
What Supports Capsules / Softgels in the Form Category?
By form, sales of capsules / softgels will account for 42.4% of market share in 2026.
Sales of capsules / softgels for multinutrient format will account for leading share. Demand will be significant as capsules pack many ingredients into standard daily units. Softgels also suit lipid-based ingredients such as CoQ10. However, high capsule counts will push some demand toward powders and gummies.
- By form, capsules / softgels will hold 42.4% market share in 2026.
- Ritual sells Fertility Support as a twice-daily powder drink mix and says each ingredient sits at the clinically studied dosage, showing the competing form logic [6].
What Drives Online / DTC in the Sales Channel Category?
Detailed product education, bundles and simple repeat ordering will give online / DTC 36.1% of sales channel revenue in 2026.
Online / DTC will drive significant sales of fertility nutrition. Brand sites sort products by sex, age and treatment stage, then turn that guidance into bundles and subscriptions. Retail pharmacy and specialty stores will have an edge with buyers seeking in-person reassurance.
- By sales channel, online / DTC will hold 36.1% market share in 2026.
- Proceive reported a 2025 expansion into the USA and UAE after earlier retail growth, pairing direct reach with selective physical-channel expansion [7].
What are the Drivers, Restraints, and Opportunities in the Fertility Treatment Nutrition Market?
Longer preconception, ART and fertility-preservation planning windows will drive repeat demand, uneven clinical evidence for antioxidant and nutraceutical products limits broad efficacy claims, and couple-centered or treatment-stage packs form the main opportunity.
- Driver: Longer preconception, ART, and fertility-preservation planning windows will create repeat demand for nutrition before pregnancy.
- Restraint: The 2025 WHO infertility guideline makes no recommendation for or against routine antioxidant use in infertile men, so clinicians will keep questioning claims that blur nutritional support and medical treatment [8].
- Opportunity: Couple-centered and treatment-stage packs will simplify three-month routines, and HFEA data show UK egg-freezing cycles rose to 6,932 in 2023, up 170% from 2019, widening fertility preservation demand [9].
Time-bound preparation around conception will drive demand. The Society for Assisted Reproductive Technology reported 100,158 babies born through IVF in the USA in 2024 [2]. Each cycle opens a defined window for patients to organize health habits and purchases around a fertility goal.
Which Country CAGRs are Profiled in the Fertility Treatment Nutrition Market?
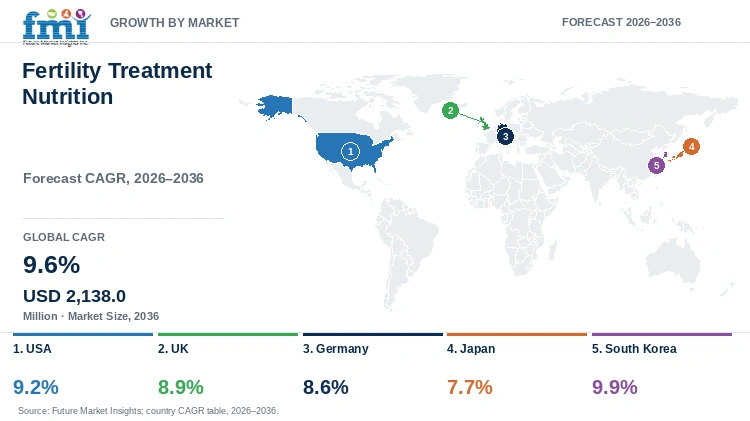
| Country | CAGR |
|---|---|
| USA | 9.2% |
| UK | 8.9% |
| Germany | 8.6% |
| Japan | 7.7% |
| South Korea | 9.9% |
How do Country-level CAGRs Compare in the Fertility Treatment Nutrition Market?
As per FMI, profiled country CAGRs span 2.2 percentage points from 2026 to 2036, from South Korea at 9.9% to Japan at 7.7%. The USA at 9.2% and the UK at 8.9% sit in an upper-middle band, with Germany at 8.6%. Treatment access and patient payment account for most of the gap.
- South Korea will lead the USA by 0.7 points.
- The USA will grow 0.3 points ahead of the UK. As a result, channel execution will matter more than headline CAGR.
- The UK leads Germany by 0.3 points with a larger private-treatment share.
- Germany grows 0.9 points faster than Japan. Japan's mature treatment base favors suppliers that fit established clinical routines.
Growth rates for 30+ countries across North America, Latin America, Western Europe, Eastern Europe, East Asia, South Asia and Pacific, and the Middle East and Africa are covered in the full FMI report.
Country Outlook
- Demand for fertility treatment nutrition in the USA will grow at a 9.2% CAGR from 2026 to 2036. The American Society for Reproductive Medicine released data in March 2026 showing that 364 U.S. fertility clinics reported 449,772 IVF treatment cycles in 2024. Buyers have wide product choice yet doubt which fertility-specific claims merit the extra spend, so suppliers will compete on transparent doses.
- Sales of fertility treatment nutrition in the UK will rise at an 8.9% CAGR from 2026 to 2036. HFEA reported in June 2025 that patients underwent more than 77,500 IVF cycles in 2023, and NHS-funded IVF fell to 27% of cycles from 35% in 2019 [9]. Heavy private spending makes discretionary adjuncts easier to question.
- Demand in Germany will grow at an 8.6% CAGR through 2036. The Federal Government service portal, updated in May 2025, states that statutory health insurance generally covers 50% of the approved costs for eligible artificial-insemination treatment [10]. Nutrition stays a separate consumer expense, so pharmacist-friendly education and precise labeling will build trust.
- Fertility treatment nutrition in Japan will expand at a 7.7% CAGR from 2026 to 2036. A 2026 Japan Society of Obstetrics and Gynecology registry report recorded 561,664 ART treatment cycles in 2023, with an average patient age of 37.3 years [11]. Established medical protocols make fit with the treatment journey more important than novelty.
- South Korea will post the fastest growth at a 9.9% CAGR till 2036. The Ministry of Health and Welfare said in April 2026 that fertility support will shift to a package including prevention and mental health, after preconception health program applications reached 291,246 in 2025 [12]. Coordinated male and female programs will gain the most from this shift.
Who are the Notable Companies in the Fertility Treatment Nutrition Market?
FMI profiles Fairhaven Health, Theralogix, Bird&Be, Ovaterra, Zita West, Proceive, Needed, and Ritual as the notable companies in this market.
FMI groups the profiled companies into three strategy cohorts. Ritual extends an established prenatal platform with a fertility powder. Treatment-stage coverage, regimen simplicity, and credible quality signals will decide repeat use.
- Clinical and practitioner-oriented reproductive nutrition: Fairhaven Health, Theralogix, and Ovaterra pair broad fertility assortments with study references and practitioner positioning.
- Protocol-pack and couple-centered fertility systems: Bird&Be, Proceive, and Needed package male and female needs into coordinated plans.
- Consumer-lifestyle fertility and prenatal extension: Zita West and Ritual tie fertility support to broader preconception or prenatal journeys.
Competitive Benchmarking
| Company | Treatment-Stage Fertility Coverage | Couple & Protocol Pack Architecture | Clinical Substantiation & Quality Signals | Geographic Reach |
|---|---|---|---|---|
| Fairhaven Health | High | High | High | United States and Canada; international wholesale capability is documented |
| Theralogix | High | High | High | United States with documented North American online reach |
| Bird&Be | High | High | Medium | United States and Canada |
| Ovaterra | High | High | High | United States with documented fertility-center use across multiple continents [14] |
| Zita West | High | High | Medium | United Kingdom-led direct and practitioner presence |
| Proceive | High | High | Medium | Ireland, UK, USA, UAE, Cyprus, and selected Asian distribution |
| Needed | High | High | Medium | United States-led DTC presence |
| Ritual | Medium | Medium | Medium | United States-led DTC and retail presence |
Scoring basis: Treatment-Stage Fertility Coverage measures documented breadth across preconception, male or female fertility, ART preparation, and preservation-related use cases. Couple & Protocol Pack Architecture measures whether the company offers coordinated bundles, paired male/female programs, or structured multi-product regimens. Clinical Substantiation & Quality Signals measures public evidence such as clinical studies, registered trials, practitioner development, patents, independent testing, or ingredient traceability. High indicates broad documented capability, and Medium indicates credible but narrower coverage. Low is reserved for a documented limitation, and unavailable public information is left unscored instead of treated as Low.
Key Developments
- In March 2026, Theralogix launched OvaNAD+, a women’s fertility supplement built around nicotinamide riboside and pterostilbene [3].
- In September 2026, Bird&Be raised USD 13 million in a Series A round led by BDC Thrive and BFG Partners [13].
- By spring 2026, Bird&Be had expanded from 300 to nearly 1,000 Ulta Beauty store locations, carrying Female Fertility Power Prenatal and Male Fertility Power Prenatal with CoQ10 [5].
Key Players
Clinical and Practitioner-Oriented Reproductive Nutrition
- Fairhaven Health
- Theralogix
- Ovaterra
Protocol-Pack and Couple-Centered Fertility Systems
- Bird&Be
- Proceive
- Needed
Consumer-Lifestyle Fertility and Prenatal Extension
- Zita West
- Ritual
Report Scope and Methodology
| Coverage field | Report scope |
|---|---|
| Market breakdown | Product Type; User; Treatment Context; Form; Sales Channel |
| Quantitative Units | USD Million |
| Market Definition | Revenue includes fertility-positioned nutritional supplements sold for preconception, natural conception support, IUI / IVF preparation or adjunct use, egg or sperm freezing preparation, and male fertility within the defined segmentation universe. The scope excludes fertility-clinic services, prescription fertility drugs, diagnostics, devices, general wellness supplements without explicit fertility positioning, and subsequent treatment or pregnancy-care revenue. |
| Regions Covered | North America; Latin America; Western Europe; Eastern Europe; East Asia; South Asia and Pacific; Middle East and Africa |
| Countries Covered | USA, UK, Germany, Japan, South Korea, and more than twenty-five additional countries in the full report |
| Key Companies Profiled | Fairhaven Health; Theralogix; Bird&Be; Ovaterra; Zita West; Proceive; Needed; Ritual |
| Forecast Period | 2026 to 2036 |
| Approach | FMI applies a hybrid bottom-up and top-down sizing approach that reconciles product pricing, channel structure, supplier participation, treatment-pathway indicators, and country-specific adoption conditions and excludes adjacent-category revenue. |
Research Methodology
| Method | Approach |
|---|---|
| Primary Research | Structured discussions with fertility-nutrition manufacturers, distributors, DTC and retail channel participants, fertility clinicians, nutrition specialists, and end-user buyers are used to test product boundaries, purchase triggers, channel economics, regimen design, and adoption frictions. No respondent counts are stated in this report. |
| Desk Research | Review covers official fertility-treatment statistics, professional clinical guidance, national reimbursement and policy material, company product documentation, company announcements, registered clinical studies, and relevant public filings. Evidence is included only when the source supports the defined revenue boundary or clarifies a purchase mechanism. |
| Market Sizing and Forecasting | Market sizing uses a hybrid bottom-up and top-down framework. The model considers observed product categories, price architecture, channel mix, addressable fertility and preconception use cases, treatment-pathway expansion, and country-level purchasing conditions before applying the 2026 to 2036 forecast assumptions. |
| Data Validation | Findings are reconciled across independent public sources and first-party company evidence. Validation excludes duplicate channel revenue, prescription fertility therapy, fertility-treatment service revenue, general wellness supplements without explicit fertility positioning, and unsupported efficacy claims from the market boundary. |
Fertility Treatment Nutrition Market by Segments
Fertility Treatment Nutrition Market Segmented by Product Type
- Preconception Multinutrients
- CoQ10 & Antioxidant Blends
- IVF-Support Protocol Packs
- Male Fertility Nutrition
- Others
Fertility Treatment Nutrition Market Segmented by User
- Female
- Male
- Couples Packs
Fertility Treatment Nutrition Market Segmented by Treatment Context
- Natural Conception Support
- IUI / IVF Adjunct
- Egg / Sperm Freezing Prep
- Others
Fertility Treatment Nutrition Market Segmented by Form
- Capsules / Softgels
- Powders
- Gummies
- Others
Fertility Treatment Nutrition Market Segmented by Sales Channel
- Online / DTC
- Retail Pharmacy
- Supermarkets & Hypermarkets
- Specialty & Health Stores
- Others
Fertility Treatment Nutrition Market Segmented by Region
- North America
- United States
- Canada
- Latin America
- Brazil
- Mexico
- Argentina
- Chile
- Western Europe
- Germany
- France
- United Kingdom
- Italy
- Spain
- Benelux
- Nordics
- Eastern Europe
- Poland
- Czech Republic
- Romania
- Hungary
- East Asia
- China
- Japan
- South Korea
- South Asia and Pacific
- India
- ASEAN
- Australia and New Zealand
- Middle East and Africa
- GCC Countries
- South Africa
- Türkiye
- Israel
Research Sources and Bibliography
- [1] Centers for Disease Control and Prevention (2026, July 15). About Folic Acid.
- [2] American Society for Reproductive Medicine (2026, March 24). For the First Time, More Than 100,000 Babies Born Through IVF in the U.S. in a Single Year.
- [3] Theralogix (2026, March 10). Theralogix Introduces OvaNAD+ Egg Quality Support: An Innovative NAD+ Supplement for Reproductive and Ovarian Health.
- [4] Needed (n.d.; accessed 2026, September 30). Sperm Support+. https://thisisneeded.com/products/sperm-support
- [5] Happi (2026, March 5). Ulta Stocks Bird&Be Supplements for Male and Female Fertility. https://www.happi.com/breaking-news/ulta-stocks-birdbe-supplements-for-male-and-female-fertility/
- [6] Ritual (n.d.; accessed 2026, September 30). Fertility Support. https://ritual.com/products/fertility-support
- [7] Proceive (n.d.; accessed 2026, September 1). Our Story. https://proceive.com/pages/our-story
- [ [8] American Urological Association, AUANews (2026, January 20). WHO Releases Landmark Infertility Guideline, Practical Takeaways for Urologists. https://auanews.net/issues/articles/2026/january-2026/who-releases-landmark-infertility-guideline-practical-takeaways-for-urologists
- [9] Human Fertilisation and Embryology Authority (2025, June). Fertility Treatment 2023: Trends and Figures. https://www.hfea.gov.uk/about-us/publications/research-and-data/fertility-treatment-2023-trends-and-figures/
- [10] Federal Government of Germany (2025, May 6). Artificial Insemination: Apply for Cost Coverage From Statutory Health Insurance. https://verwaltung.bund.de/leistungsverzeichnis/DE/leistung/99134005017000/herausgeber/LeiKa-584439/region/00
- [11] Katagiri, Y., Jwa, S. C., Kuwahara, A., et al. (2026). Assisted Reproductive Technology in Japan: A Summary Report for 2023 by the Committee on Professional Scientific Conduct and Clinical Ethics of the Japan Society of Obstetrics and Gynecology. https://pmc.ncbi.nlm.nih.gov/articles/PMC12728317/
- [12] Korea Biomedical Review (2026, April 23). Korea expands fertility support to include prevention and mental health. https://www.koreabiomed.com/news/articleView.html?idxno=31417
- [13] Bird&Be (2026, September 22). Fertility Brand Bird&Be Raises $13M to Expand Access to Evidence-Backed Fertility Care Nationwide. https://www.prnewswire.com/news-releases/fertility-brand-birdbe-raises-13m-to-expand-access-to-evidence-backed-fertility-care-nationwide-302884277.html
- [14] Ovaterra (n.d.; accessed 2026, September 1). Why Us. https://myovaterra.com/pages/why-us
- [15] Fairhaven Health (n.d.; accessed 2026, September 1). FH PRO Fertility Multivitamin Combo Pack. https://www.fairhavenhealth.com/products/fh-pro-fertility-multivitamin-combo-pack
- [16] Zita West (n.d.; accessed 2026, September 1). Fertility Supplements, Backed by Clinical Expertise. https://www.zitawest.com/
This bibliography is provided for reader reference and is not exhaustive. The full report contains the complete reference list and detailed citations.
This Report Answers
- What is the size of the Fertility Treatment Nutrition Market in 2026 and what value is forecast for 2036?
- Which preconception and fertility-care pressures support demand for fertility treatment nutrition?
- Why do Preconception Multinutrients hold the leading Product Type position?
- How does the Female user segment influence product architecture and downstream male or Couples Packs demand?
- Why does Natural Conception Support hold the leading Treatment Context position?
- How do Fertility Treatment Nutrition Market growth rates differ across USA, UK, Germany, Japan, and South Korea?
- Which approved companies compete through broad reproductive nutrition, protocol packs, or consumer-lifestyle fertility support?
- How does uncertain clinical utility for some antioxidant and nutraceutical interventions constrain adoption?
- What should brand, channel, and fertility-care decision-makers evaluate before adding or recommending fertility nutrition products?
Table of Content
- Key Takeaways
- Market Size and CAGR
- Top Growth Driver
- Fastest Growing Segment
- Leading Region
- Key Companies
- Emerging Opportunities
- Executive Summary
- Global Market Outlook
- Demand-side Trends
- Supply-side Trends
- Technology Roadmap Analysis
- Analysis and Recommendations
- Analyst Perspective (What is happening? Why now? What should investors know?)
- Key Questions Answered
- How large is the market?
- What is the CAGR?
- What are key trends?
- Which region dominates?
- Who are the leaders?
Read More...
- Market Overview
- Market Coverage / Taxonomy
- Market Definition / Scope / Limitations
- Research Methodology
- Chapter Orientation
- Analytical Lens and Working Hypotheses
- Market Structure, Signals, and Trend Drivers
- Benchmarking and Cross-market Comparability
- Market Sizing, Forecasting, and Opportunity Mapping
- Research Design and Evidence Framework
- Desk Research Programme (Secondary Evidence)
- Expert Input and Fieldwork (Primary Evidence)
- Tooling, Models, and Reference Databases
- Data Engineering and Model Build
- Quality Assurance and Audit Trail
- Market Background
- Market Dynamics (Drivers, Restraints, Opportunity, Trends)
- Scenario Forecast (Optimistic, Likely, Conservative)
- Impact Analysis
- AI Impact
- Sustainability Impact
- Regulatory Impact
- Technology Impact
- Consumer / Buyer Analysis
- Purchase Drivers
- Adoption Barriers
- Buyer Journey
- Opportunity Map Analysis
- Product Life Cycle Analysis
- Supply Chain Analysis
- Investment Feasibility Matrix
- Value Chain Analysis
- PESTLE and Porter's Analysis
- Regulatory Landscape
- Regional Parent Market Outlook
- Production and Consumption Statistics
- Import and Export Statistics
- Global Market Analysis and Forecast, 2021 to 2036
- Historical Market Size Value (USD Million) Analysis, 2021 to 2025
- Current and Future Market Size Value (USD Million) Projections, 2026 to 2036
- Y-o-Y Growth Trend Analysis
- Absolute $ Opportunity Analysis
- Global Market Pricing Analysis, 2021 to 2036
- Global Market Analysis and Forecast, By Product Type, 2021 to 2036
- Introduction / Key Findings
- Historical Market Size Value (USD Million) Analysis By Product Type, 2021 to 2025
- Current and Future Market Size Value (USD Million) Analysis and Forecast By Product Type, 2026 to 2036
- Preconception Multinutrients
- CoQ10 & Antioxidant Blends
- IVF-Support Protocol Packs
- Male Fertility Nutrition
- Others
- Y-o-Y Growth Trend Analysis By Product Type, 2021 to 2025
- Absolute $ Opportunity Analysis By Product Type, 2026 to 2036
- Global Market Analysis and Forecast, By User, 2021 to 2036
- Introduction / Key Findings
- Historical Market Size Value (USD Million) Analysis By User, 2021 to 2025
- Current and Future Market Size Value (USD Million) Analysis and Forecast By User, 2026 to 2036
- Female
- Male
- Couples Packs
- Y-o-Y Growth Trend Analysis By User, 2021 to 2025
- Absolute $ Opportunity Analysis By User, 2026 to 2036
- Global Market Analysis and Forecast, By Treatment Context, 2021 to 2036
- Introduction / Key Findings
- Historical Market Size Value (USD Million) Analysis By Treatment Context, 2021 to 2025
- Current and Future Market Size Value (USD Million) Analysis and Forecast By Treatment Context, 2026 to 2036
- Natural Conception Support
- IUI / IVF Adjunct
- Egg / Sperm Freezing Prep
- Others
- Y-o-Y Growth Trend Analysis By Treatment Context, 2021 to 2025
- Absolute $ Opportunity Analysis By Treatment Context, 2026 to 2036
- Global Market Analysis and Forecast, By Form, 2021 to 2036
- Introduction / Key Findings
- Historical Market Size Value (USD Million) Analysis By Form, 2021 to 2025
- Current and Future Market Size Value (USD Million) Analysis and Forecast By Form, 2026 to 2036
- Capsules / Softgels
- Powders
- Gummies
- Others
- Y-o-Y Growth Trend Analysis By Form, 2021 to 2025
- Absolute $ Opportunity Analysis By Form, 2026 to 2036
- Global Market Analysis and Forecast, By Sales Channel, 2021 to 2036
- Introduction / Key Findings
- Historical Market Size Value (USD Million) Analysis By Sales Channel, 2021 to 2025
- Current and Future Market Size Value (USD Million) Analysis and Forecast By Sales Channel, 2026 to 2036
- Online / DTC
- Retail Pharmacy
- Supermarkets & Hypermarkets
- Specialty & Health Stores
- Others
- Y-o-Y Growth Trend Analysis By Sales Channel, 2021 to 2025
- Absolute $ Opportunity Analysis By Sales Channel, 2026 to 2036
- Global Market Analysis and Forecast, By Region, 2021 to 2036
- Introduction
- Historical Market Size Value (USD Million) Analysis By Region, 2021 to 2025
- Current Market Size Value (USD Million) Analysis and Forecast By Region, 2026 to 2036
- North America
- Latin America
- Western Europe
- Eastern Europe
- East Asia
- South Asia and Pacific
- Middle East and Africa
- Market Attractiveness Analysis By Region
- North America Market Analysis and Forecast, By Country, 2021 to 2036
- Historical Market Size Value (USD Million) Trend Analysis By Market Taxonomy, 2021 to 2025
- Market Size Value (USD Million) Forecast By Market Taxonomy, 2026 to 2036
- By Country
- United States
- Canada
- By Product Type
- By User
- By Treatment Context
- By Form
- By Sales Channel
- By Country
- Market Attractiveness Analysis
- By Country
- By Product Type
- By User
- By Treatment Context
- By Form
- By Sales Channel
- Key Takeaways
- Latin America Market Analysis and Forecast, By Country
- Historical Market Size Value (USD Million) Trend Analysis By Market Taxonomy, 2021 to 2025
- Market Size Value (USD Million) Forecast By Market Taxonomy, 2026 to 2036
- By Country
- Brazil
- Mexico
- Argentina
- Chile
- By Product Type
- By User
- By Treatment Context
- By Form
- By Sales Channel
- By Country
- Market Attractiveness Analysis
- By Country
- By Product Type
- By User
- By Treatment Context
- By Form
- By Sales Channel
- Key Takeaways
- Western Europe Market Analysis and Forecast, By Country
- Historical Market Size Value (USD Million) Trend Analysis By Market Taxonomy, 2021 to 2025
- Market Size Value (USD Million) Forecast By Market Taxonomy, 2026 to 2036
- By Country
- Germany
- France
- United Kingdom
- Italy
- Spain
- Benelux
- Nordics
- By Product Type
- By User
- By Treatment Context
- By Form
- By Sales Channel
- By Country
- Market Attractiveness Analysis
- By Country
- By Product Type
- By User
- By Treatment Context
- By Form
- By Sales Channel
- Key Takeaways
- Eastern Europe Market Analysis and Forecast, By Country
- Historical Market Size Value (USD Million) Trend Analysis By Market Taxonomy, 2021 to 2025
- Market Size Value (USD Million) Forecast By Market Taxonomy, 2026 to 2036
- By Country
- Poland
- Czech Republic
- Romania
- Hungary
- By Product Type
- By User
- By Treatment Context
- By Form
- By Sales Channel
- By Country
- Market Attractiveness Analysis
- By Country
- By Product Type
- By User
- By Treatment Context
- By Form
- By Sales Channel
- Key Takeaways
- East Asia Market Analysis and Forecast, By Country
- Historical Market Size Value (USD Million) Trend Analysis By Market Taxonomy, 2021 to 2025
- Market Size Value (USD Million) Forecast By Market Taxonomy, 2026 to 2036
- By Country
- China
- Japan
- South Korea
- By Product Type
- By User
- By Treatment Context
- By Form
- By Sales Channel
- By Country
- Market Attractiveness Analysis
- By Country
- By Product Type
- By User
- By Treatment Context
- By Form
- By Sales Channel
- Key Takeaways
- South Asia and Pacific Market Analysis and Forecast, By Country
- Historical Market Size Value (USD Million) Trend Analysis By Market Taxonomy, 2021 to 2025
- Market Size Value (USD Million) Forecast By Market Taxonomy, 2026 to 2036
- By Country
- India
- ASEAN
- Australia and New Zealand
- By Product Type
- By User
- By Treatment Context
- By Form
- By Sales Channel
- By Country
- Market Attractiveness Analysis
- By Country
- By Product Type
- By User
- By Treatment Context
- By Form
- By Sales Channel
- Key Takeaways
- Middle East and Africa Market Analysis and Forecast, By Country
- Historical Market Size Value (USD Million) Trend Analysis By Market Taxonomy, 2021 to 2025
- Market Size Value (USD Million) Forecast By Market Taxonomy, 2026 to 2036
- By Country
- GCC Countries
- South Africa
- Türkiye
- Israel
- By Product Type
- By User
- By Treatment Context
- By Form
- By Sales Channel
- By Country
- Market Attractiveness Analysis
- By Country
- By Product Type
- By User
- By Treatment Context
- By Form
- By Sales Channel
- Key Takeaways
- Key Countries Market Analysis
- United States
- Pricing Analysis
- Market Share Analysis, 2025
- By Product Type
- By User
- By Treatment Context
- By Form
- By Sales Channel
- Canada
- Pricing Analysis
- Market Share Analysis, 2025
- By Product Type
- By User
- By Treatment Context
- By Form
- By Sales Channel
- Mexico
- Pricing Analysis
- Market Share Analysis, 2025
- By Product Type
- By User
- By Treatment Context
- By Form
- By Sales Channel
- Brazil
- Pricing Analysis
- Market Share Analysis, 2025
- By Product Type
- By User
- By Treatment Context
- By Form
- By Sales Channel
- Chile
- Pricing Analysis
- Market Share Analysis, 2025
- By Product Type
- By User
- By Treatment Context
- By Form
- By Sales Channel
- Germany
- Pricing Analysis
- Market Share Analysis, 2025
- By Product Type
- By User
- By Treatment Context
- By Form
- By Sales Channel
- United Kingdom
- Pricing Analysis
- Market Share Analysis, 2025
- By Product Type
- By User
- By Treatment Context
- By Form
- By Sales Channel
- Italy
- Pricing Analysis
- Market Share Analysis, 2025
- By Product Type
- By User
- By Treatment Context
- By Form
- By Sales Channel
- Spain
- Pricing Analysis
- Market Share Analysis, 2025
- By Product Type
- By User
- By Treatment Context
- By Form
- By Sales Channel
- France
- Pricing Analysis
- Market Share Analysis, 2025
- By Product Type
- By User
- By Treatment Context
- By Form
- By Sales Channel
- India
- Pricing Analysis
- Market Share Analysis, 2025
- By Product Type
- By User
- By Treatment Context
- By Form
- By Sales Channel
- ASEAN
- Pricing Analysis
- Market Share Analysis, 2025
- By Product Type
- By User
- By Treatment Context
- By Form
- By Sales Channel
- Australia and New Zealand
- Pricing Analysis
- Market Share Analysis, 2025
- By Product Type
- By User
- By Treatment Context
- By Form
- By Sales Channel
- China
- Pricing Analysis
- Market Share Analysis, 2025
- By Product Type
- By User
- By Treatment Context
- By Form
- By Sales Channel
- Japan
- Pricing Analysis
- Market Share Analysis, 2025
- By Product Type
- By User
- By Treatment Context
- By Form
- By Sales Channel
- South Korea
- Pricing Analysis
- Market Share Analysis, 2025
- By Product Type
- By User
- By Treatment Context
- By Form
- By Sales Channel
- Poland
- Pricing Analysis
- Market Share Analysis, 2025
- By Product Type
- By User
- By Treatment Context
- By Form
- By Sales Channel
- Hungary
- Pricing Analysis
- Market Share Analysis, 2025
- By Product Type
- By User
- By Treatment Context
- By Form
- By Sales Channel
- Türkiye
- Pricing Analysis
- Market Share Analysis, 2025
- By Product Type
- By User
- By Treatment Context
- By Form
- By Sales Channel
- South Africa
- Pricing Analysis
- Market Share Analysis, 2025
- By Product Type
- By User
- By Treatment Context
- By Form
- By Sales Channel
- United States
- Market Structure Analysis
- Competition Dashboard
- Competition Benchmarking
- Market Share Analysis of Top Players
- By Regional
- By Product Type
- By User
- By Treatment Context
- By Form
- By Sales Channel
- Emerging Startups
- Innovation Benchmarking
- Competition Analysis
- Competition Deep Dive
- Fairhaven Health
- Overview
- Product Portfolio
- Profitability by Market Segments
- Sales Footprint
- Strategy Overview
- Marketing Strategy
- Product Strategy
- Channel Strategy
- Theralogix
- Bird&Be
- Ovaterra
- Zita West
- Proceive
- Needed
- Ritual
- Key Players
- Fairhaven Health
- Case Studies
- Success Stories
- Recent Developments
- Competition Deep Dive
- Assumptions & Acronyms Used
List of Tables
- Table 1: Global Market Value (USD Million) Forecast by Region, 2021 to 2036
- Table 2: Global Market Value (USD Million) Forecast by Product Type, 2021 to 2036
- Table 3: Global Market Value (USD Million) Forecast by User, 2021 to 2036
- Table 4: Global Market Value (USD Million) Forecast by Treatment Context, 2021 to 2036
- Table 5: Global Market Value (USD Million) Forecast by Form, 2021 to 2036
- Table 6: Global Market Value (USD Million) Forecast by Sales Channel, 2021 to 2036
- Table 7: North America Market Value (USD Million) Forecast by Country, 2021 to 2036
- Table 8: North America Market Value (USD Million) Forecast by Product Type, 2021 to 2036
- Table 9: North America Market Value (USD Million) Forecast by User, 2021 to 2036
- Table 10: North America Market Value (USD Million) Forecast by Treatment Context, 2021 to 2036
- Table 11: North America Market Value (USD Million) Forecast by Form, 2021 to 2036
- Table 12: North America Market Value (USD Million) Forecast by Sales Channel, 2021 to 2036
- Table 13: Latin America Market Value (USD Million) Forecast by Country, 2021 to 2036
- Table 14: Latin America Market Value (USD Million) Forecast by Product Type, 2021 to 2036
- Table 15: Latin America Market Value (USD Million) Forecast by User, 2021 to 2036
- Table 16: Latin America Market Value (USD Million) Forecast by Treatment Context, 2021 to 2036
- Table 17: Latin America Market Value (USD Million) Forecast by Form, 2021 to 2036
- Table 18: Latin America Market Value (USD Million) Forecast by Sales Channel, 2021 to 2036
- Table 19: Western Europe Market Value (USD Million) Forecast by Country, 2021 to 2036
- Table 20: Western Europe Market Value (USD Million) Forecast by Product Type, 2021 to 2036
- Table 21: Western Europe Market Value (USD Million) Forecast by User, 2021 to 2036
- Table 22: Western Europe Market Value (USD Million) Forecast by Treatment Context, 2021 to 2036
- Table 23: Western Europe Market Value (USD Million) Forecast by Form, 2021 to 2036
- Table 24: Western Europe Market Value (USD Million) Forecast by Sales Channel, 2021 to 2036
- Table 25: Eastern Europe Market Value (USD Million) Forecast by Country, 2021 to 2036
- Table 26: Eastern Europe Market Value (USD Million) Forecast by Product Type, 2021 to 2036
- Table 27: Eastern Europe Market Value (USD Million) Forecast by User, 2021 to 2036
- Table 28: Eastern Europe Market Value (USD Million) Forecast by Treatment Context, 2021 to 2036
- Table 29: Eastern Europe Market Value (USD Million) Forecast by Form, 2021 to 2036
- Table 30: Eastern Europe Market Value (USD Million) Forecast by Sales Channel, 2021 to 2036
- Table 31: East Asia Market Value (USD Million) Forecast by Country, 2021 to 2036
- Table 32: East Asia Market Value (USD Million) Forecast by Product Type, 2021 to 2036
- Table 33: East Asia Market Value (USD Million) Forecast by User, 2021 to 2036
- Table 34: East Asia Market Value (USD Million) Forecast by Treatment Context, 2021 to 2036
- Table 35: East Asia Market Value (USD Million) Forecast by Form, 2021 to 2036
- Table 36: East Asia Market Value (USD Million) Forecast by Sales Channel, 2021 to 2036
- Table 37: South Asia and Pacific Market Value (USD Million) Forecast by Country, 2021 to 2036
- Table 38: South Asia and Pacific Market Value (USD Million) Forecast by Product Type, 2021 to 2036
- Table 39: South Asia and Pacific Market Value (USD Million) Forecast by User, 2021 to 2036
- Table 40: South Asia and Pacific Market Value (USD Million) Forecast by Treatment Context, 2021 to 2036
- Table 41: South Asia and Pacific Market Value (USD Million) Forecast by Form, 2021 to 2036
- Table 42: South Asia and Pacific Market Value (USD Million) Forecast by Sales Channel, 2021 to 2036
- Table 43: Middle East and Africa Market Value (USD Million) Forecast by Country, 2021 to 2036
- Table 44: Middle East and Africa Market Value (USD Million) Forecast by Product Type, 2021 to 2036
- Table 45: Middle East and Africa Market Value (USD Million) Forecast by User, 2021 to 2036
- Table 46: Middle East and Africa Market Value (USD Million) Forecast by Treatment Context, 2021 to 2036
- Table 47: Middle East and Africa Market Value (USD Million) Forecast by Form, 2021 to 2036
- Table 48: Middle East and Africa Market Value (USD Million) Forecast by Sales Channel, 2021 to 2036
List of Figures
- Figure 1: Global Market Pricing Analysis
- Figure 2: Global Market Value (USD Million) Forecast 2021-2036
- Figure 3: Global Market Value Share and BPS Analysis by Product Type, 2026 and 2036
- Figure 4: Global Market Y-o-Y Growth Comparison by Product Type, 2026-2036
- Figure 5: Global Market Attractiveness Analysis by Product Type
- Figure 6: Global Market Value Share and BPS Analysis by User, 2026 and 2036
- Figure 7: Global Market Y-o-Y Growth Comparison by User, 2026-2036
- Figure 8: Global Market Attractiveness Analysis by User
- Figure 9: Global Market Value Share and BPS Analysis by Treatment Context, 2026 and 2036
- Figure 10: Global Market Y-o-Y Growth Comparison by Treatment Context, 2026-2036
- Figure 11: Global Market Attractiveness Analysis by Treatment Context
- Figure 12: Global Market Value Share and BPS Analysis by Form, 2026 and 2036
- Figure 13: Global Market Y-o-Y Growth Comparison by Form, 2026-2036
- Figure 14: Global Market Attractiveness Analysis by Form
- Figure 15: Global Market Value Share and BPS Analysis by Sales Channel, 2026 and 2036
- Figure 16: Global Market Y-o-Y Growth Comparison by Sales Channel, 2026-2036
- Figure 17: Global Market Attractiveness Analysis by Sales Channel
- Figure 18: Global Market Value (USD Million) Share and BPS Analysis by Region, 2026 and 2036
- Figure 19: Global Market Y-o-Y Growth Comparison by Region, 2026-2036
- Figure 20: Global Market Attractiveness Analysis by Region
- Figure 21: North America Market Incremental Dollar Opportunity, 2026-2036
- Figure 22: Latin America Market Incremental Dollar Opportunity, 2026-2036
- Figure 23: Western Europe Market Incremental Dollar Opportunity, 2026-2036
- Figure 24: Eastern Europe Market Incremental Dollar Opportunity, 2026-2036
- Figure 25: East Asia Market Incremental Dollar Opportunity, 2026-2036
- Figure 26: South Asia and Pacific Market Incremental Dollar Opportunity, 2026-2036
- Figure 27: Middle East and Africa Market Incremental Dollar Opportunity, 2026-2036
- Figure 28: North America Market Value Share and BPS Analysis by Country, 2026 and 2036
- Figure 29: North America Market Value Share and BPS Analysis by Product Type, 2026 and 2036
- Figure 30: North America Market Y-o-Y Growth Comparison by Product Type, 2026-2036
- Figure 31: North America Market Attractiveness Analysis by Product Type
- Figure 32: North America Market Value Share and BPS Analysis by User, 2026 and 2036
- Figure 33: North America Market Y-o-Y Growth Comparison by User, 2026-2036
- Figure 34: North America Market Attractiveness Analysis by User
- Figure 35: North America Market Value Share and BPS Analysis by Treatment Context, 2026 and 2036
- Figure 36: North America Market Y-o-Y Growth Comparison by Treatment Context, 2026-2036
- Figure 37: North America Market Attractiveness Analysis by Treatment Context
- Figure 38: North America Market Value Share and BPS Analysis by Form, 2026 and 2036
- Figure 39: North America Market Y-o-Y Growth Comparison by Form, 2026-2036
- Figure 40: North America Market Attractiveness Analysis by Form
- Figure 41: North America Market Value Share and BPS Analysis by Sales Channel, 2026 and 2036
- Figure 42: North America Market Y-o-Y Growth Comparison by Sales Channel, 2026-2036
- Figure 43: North America Market Attractiveness Analysis by Sales Channel
- Figure 44: Latin America Market Value Share and BPS Analysis by Country, 2026 and 2036
- Figure 45: Latin America Market Value Share and BPS Analysis by Product Type, 2026 and 2036
- Figure 46: Latin America Market Y-o-Y Growth Comparison by Product Type, 2026-2036
- Figure 47: Latin America Market Attractiveness Analysis by Product Type
- Figure 48: Latin America Market Value Share and BPS Analysis by User, 2026 and 2036
- Figure 49: Latin America Market Y-o-Y Growth Comparison by User, 2026-2036
- Figure 50: Latin America Market Attractiveness Analysis by User
- Figure 51: Latin America Market Value Share and BPS Analysis by Treatment Context, 2026 and 2036
- Figure 52: Latin America Market Y-o-Y Growth Comparison by Treatment Context, 2026-2036
- Figure 53: Latin America Market Attractiveness Analysis by Treatment Context
- Figure 54: Latin America Market Value Share and BPS Analysis by Form, 2026 and 2036
- Figure 55: Latin America Market Y-o-Y Growth Comparison by Form, 2026-2036
- Figure 56: Latin America Market Attractiveness Analysis by Form
- Figure 57: Latin America Market Value Share and BPS Analysis by Sales Channel, 2026 and 2036
- Figure 58: Latin America Market Y-o-Y Growth Comparison by Sales Channel, 2026-2036
- Figure 59: Latin America Market Attractiveness Analysis by Sales Channel
- Figure 60: Western Europe Market Value Share and BPS Analysis by Country, 2026 and 2036
- Figure 61: Western Europe Market Value Share and BPS Analysis by Product Type, 2026 and 2036
- Figure 62: Western Europe Market Y-o-Y Growth Comparison by Product Type, 2026-2036
- Figure 63: Western Europe Market Attractiveness Analysis by Product Type
- Figure 64: Western Europe Market Value Share and BPS Analysis by User, 2026 and 2036
- Figure 65: Western Europe Market Y-o-Y Growth Comparison by User, 2026-2036
- Figure 66: Western Europe Market Attractiveness Analysis by User
- Figure 67: Western Europe Market Value Share and BPS Analysis by Treatment Context, 2026 and 2036
- Figure 68: Western Europe Market Y-o-Y Growth Comparison by Treatment Context, 2026-2036
- Figure 69: Western Europe Market Attractiveness Analysis by Treatment Context
- Figure 70: Western Europe Market Value Share and BPS Analysis by Form, 2026 and 2036
- Figure 71: Western Europe Market Y-o-Y Growth Comparison by Form, 2026-2036
- Figure 72: Western Europe Market Attractiveness Analysis by Form
- Figure 73: Western Europe Market Value Share and BPS Analysis by Sales Channel, 2026 and 2036
- Figure 74: Western Europe Market Y-o-Y Growth Comparison by Sales Channel, 2026-2036
- Figure 75: Western Europe Market Attractiveness Analysis by Sales Channel
- Figure 76: Eastern Europe Market Value Share and BPS Analysis by Country, 2026 and 2036
- Figure 77: Eastern Europe Market Value Share and BPS Analysis by Product Type, 2026 and 2036
- Figure 78: Eastern Europe Market Y-o-Y Growth Comparison by Product Type, 2026-2036
- Figure 79: Eastern Europe Market Attractiveness Analysis by Product Type
- Figure 80: Eastern Europe Market Value Share and BPS Analysis by User, 2026 and 2036
- Figure 81: Eastern Europe Market Y-o-Y Growth Comparison by User, 2026-2036
- Figure 82: Eastern Europe Market Attractiveness Analysis by User
- Figure 83: Eastern Europe Market Value Share and BPS Analysis by Treatment Context, 2026 and 2036
- Figure 84: Eastern Europe Market Y-o-Y Growth Comparison by Treatment Context, 2026-2036
- Figure 85: Eastern Europe Market Attractiveness Analysis by Treatment Context
- Figure 86: Eastern Europe Market Value Share and BPS Analysis by Form, 2026 and 2036
- Figure 87: Eastern Europe Market Y-o-Y Growth Comparison by Form, 2026-2036
- Figure 88: Eastern Europe Market Attractiveness Analysis by Form
- Figure 89: Eastern Europe Market Value Share and BPS Analysis by Sales Channel, 2026 and 2036
- Figure 90: Eastern Europe Market Y-o-Y Growth Comparison by Sales Channel, 2026-2036
- Figure 91: Eastern Europe Market Attractiveness Analysis by Sales Channel
- Figure 92: East Asia Market Value Share and BPS Analysis by Country, 2026 and 2036
- Figure 93: East Asia Market Value Share and BPS Analysis by Product Type, 2026 and 2036
- Figure 94: East Asia Market Y-o-Y Growth Comparison by Product Type, 2026-2036
- Figure 95: East Asia Market Attractiveness Analysis by Product Type
- Figure 96: East Asia Market Value Share and BPS Analysis by User, 2026 and 2036
- Figure 97: East Asia Market Y-o-Y Growth Comparison by User, 2026-2036
- Figure 98: East Asia Market Attractiveness Analysis by User
- Figure 99: East Asia Market Value Share and BPS Analysis by Treatment Context, 2026 and 2036
- Figure 100: East Asia Market Y-o-Y Growth Comparison by Treatment Context, 2026-2036
- Figure 101: East Asia Market Attractiveness Analysis by Treatment Context
- Figure 102: East Asia Market Value Share and BPS Analysis by Form, 2026 and 2036
- Figure 103: East Asia Market Y-o-Y Growth Comparison by Form, 2026-2036
- Figure 104: East Asia Market Attractiveness Analysis by Form
- Figure 105: East Asia Market Value Share and BPS Analysis by Sales Channel, 2026 and 2036
- Figure 106: East Asia Market Y-o-Y Growth Comparison by Sales Channel, 2026-2036
- Figure 107: East Asia Market Attractiveness Analysis by Sales Channel
- Figure 108: South Asia and Pacific Market Value Share and BPS Analysis by Country, 2026 and 2036
- Figure 109: South Asia and Pacific Market Value Share and BPS Analysis by Product Type, 2026 and 2036
- Figure 110: South Asia and Pacific Market Y-o-Y Growth Comparison by Product Type, 2026-2036
- Figure 111: South Asia and Pacific Market Attractiveness Analysis by Product Type
- Figure 112: South Asia and Pacific Market Value Share and BPS Analysis by User, 2026 and 2036
- Figure 113: South Asia and Pacific Market Y-o-Y Growth Comparison by User, 2026-2036
- Figure 114: South Asia and Pacific Market Attractiveness Analysis by User
- Figure 115: South Asia and Pacific Market Value Share and BPS Analysis by Treatment Context, 2026 and 2036
- Figure 116: South Asia and Pacific Market Y-o-Y Growth Comparison by Treatment Context, 2026-2036
- Figure 117: South Asia and Pacific Market Attractiveness Analysis by Treatment Context
- Figure 118: South Asia and Pacific Market Value Share and BPS Analysis by Form, 2026 and 2036
- Figure 119: South Asia and Pacific Market Y-o-Y Growth Comparison by Form, 2026-2036
- Figure 120: South Asia and Pacific Market Attractiveness Analysis by Form
- Figure 121: South Asia and Pacific Market Value Share and BPS Analysis by Sales Channel, 2026 and 2036
- Figure 122: South Asia and Pacific Market Y-o-Y Growth Comparison by Sales Channel, 2026-2036
- Figure 123: South Asia and Pacific Market Attractiveness Analysis by Sales Channel
- Figure 124: Middle East and Africa Market Value Share and BPS Analysis by Country, 2026 and 2036
- Figure 125: Middle East and Africa Market Value Share and BPS Analysis by Product Type, 2026 and 2036
- Figure 126: Middle East and Africa Market Y-o-Y Growth Comparison by Product Type, 2026-2036
- Figure 127: Middle East and Africa Market Attractiveness Analysis by Product Type
- Figure 128: Middle East and Africa Market Value Share and BPS Analysis by User, 2026 and 2036
- Figure 129: Middle East and Africa Market Y-o-Y Growth Comparison by User, 2026-2036
- Figure 130: Middle East and Africa Market Attractiveness Analysis by User
- Figure 131: Middle East and Africa Market Value Share and BPS Analysis by Treatment Context, 2026 and 2036
- Figure 132: Middle East and Africa Market Y-o-Y Growth Comparison by Treatment Context, 2026-2036
- Figure 133: Middle East and Africa Market Attractiveness Analysis by Treatment Context
- Figure 134: Middle East and Africa Market Value Share and BPS Analysis by Form, 2026 and 2036
- Figure 135: Middle East and Africa Market Y-o-Y Growth Comparison by Form, 2026-2036
- Figure 136: Middle East and Africa Market Attractiveness Analysis by Form
- Figure 137: Middle East and Africa Market Value Share and BPS Analysis by Sales Channel, 2026 and 2036
- Figure 138: Middle East and Africa Market Y-o-Y Growth Comparison by Sales Channel, 2026-2036
- Figure 139: Middle East and Africa Market Attractiveness Analysis by Sales Channel
- Figure 140: Global Market - Tier Structure Analysis
- Figure 141: Global Market - Company Share Analysis
Frequently Asked Questions
What is Driving Growth in the Fertility Treatment Nutrition Market?
As per FMI, growth is supported by longer preconception planning and by fertility-treatment or preservation pathways that create defined preparation windows. Consumers build repeat nutrition routines before conception, then add targeted products for egg health or sperm health when a more specific preparation need emerges.
Who are the Key Players in the Fertility Treatment Nutrition Market?
The companies profiled are Fairhaven Health, Theralogix, Bird&Be, Ovaterra, Zita West, Proceive, Needed, and Ritual. These brands compete through broad reproductive-nutrition portfolios and couple or treatment-stage packs, with practitioner positioning and differentiated formats creating further separation.
What is a Notable Restraint in the Fertility Treatment Nutrition Market?
Clinical evidence for many fertility-specific antioxidants and nutraceutical interventions is uneven, and that limits broad efficacy claims and slows clinician endorsement. Buyers therefore scrutinize ingredient rationale and dose transparency and treat quality controls and the boundary between nutritional support and medical treatment as separate filters.
Why Should Executives Track the Fertility Treatment Nutrition Market?
As per FMI, the market sits at the intersection of consumer supplements and organized fertility care, so treatment access creates new purchasing occasions without directly reimbursing nutrition. Converting those occasions into credible, repeatable regimens instead of one-off ingredient purchases will separate the brands that build lasting share from those that don't.
What Business Problem does the Fertility Treatment Nutrition Market Address?
The category helps consumers organize nutrition during a complex period when separate vitamins, antioxidants, and male or female products create regimen confusion. Structured formulas and packs reduce the work of selecting products and keep nutritional support distinct from fertility treatment.
What Should Fertility-care and Retail Decision-makers Evaluate in the Fertility Treatment Nutrition Market?
Decision-makers examine product scope and ingredient dose, then test quality signals and treatment-stage instructions against the evidence behind fertility-related claims. Checking whether a regimen adds unnecessary duplication when a user already takes a prenatal, multivitamin, or other targeted supplement matters just as much.
What Limits Return on Investment in the Fertility Treatment Nutrition Market?
Return on investment weakens when pill burden or overlapping ingredients reduce repeat use, and unclear positioning and unsupported claims erode clinician confidence. Channel acquisition costs also rise when brands spend heavily to clarify the fit between a specialty fertility product and standard preconception nutrition.
What Supports Long-term Commercial Confidence in the Fertility Treatment Nutrition Market?
Long-term confidence comes from durable preconception nutrition guidance and from large fertility-treatment pathways that keep preparation behavior visible. The strongest commercial case belongs to suppliers that pair those structural demand conditions with substantiation, quality discipline, and regimen designs consumers will sustain.
Preview the report firsthand - request a free sample
Get SampleGet the brochure for pricing and purchase details.
Get PDF
