In Vitro Fertilization Market
Market Insights on In Vitro Fertilization covering sales outlook, demand forecast & up-to-date key trends
In Vitro Fertilization Market Analysis by Product (Equipment and Reagent and Media), End User (Fertility Clinics, Hospitals & Surgical Centers, and Cryobank and Research Institutes), Cycle, Type, End User, & Region - Forecast to 2022-2032
In Vitro Fertilization Market Outlook 2022-2032
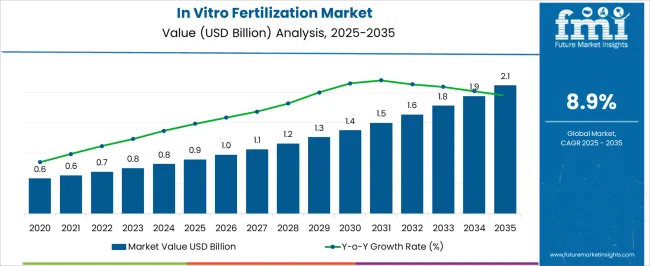
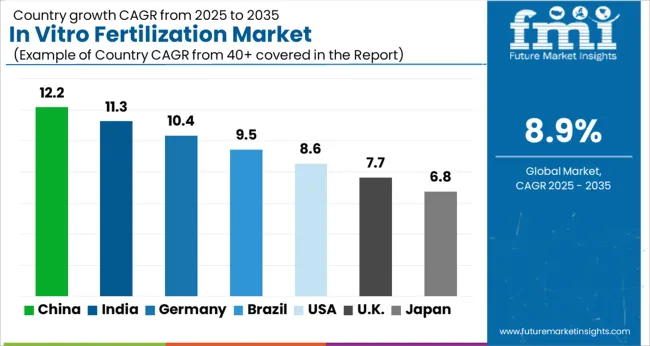
[329 Pages Report] The In Vitro Fertilization Market is projected to grow at a rate of 9% CAGR during the forecast period of 2022 to 2032, with an estimated value of US$ 990 Mn by 2026.
“The increased demand for hospitals for infertility treatments can be ascribed to increased accessibility and availability of possible therapies. “
Infertility clinics are seeing an increase in older women seeking aid as the social landscape changes. Complications in pregnancy and labour become more likely as people get older. One of the key challenges for the IVF business is the falling success rates of IVF treatment procedures in patients as they become older.
Attributes |
Details |
In Vitro Fertilization Market CAGR (2022 – 2032) |
9% |
In Vitro Fertilization Market (2026) |
US$ 990 Mn |
In Vitro Fertilization Market Attraction |
Asia Pacific will remain attractive due to medical tourism |
Let us know your requirement to get
100% FREE customization
What is the COVID-19 Implication on the In Vitro Fertilization Market?
The covid-19 has impacted the global supply chains of most of the markets. The lockdowns and shutdown of market spaces have slowed the economies down. In vitro fertilization process or IVF, the market has suffered badly due to the spread of coronavirus.
As there were no movement and most IVF centres were shut down to prevent the spread, the IVF procedures were impacted. Also, the demand for in vitro fertilization has also dropped because of the spread of covid-19.
According to Outlook India, 2-2.5 lac women go for the IVF procedure every year, but the number dropped by 90% during the coronavirus spike. For this procedure, many couples seek fertility financial assistance, which was not the priority during the lockdown. Therefore, it has impacted the IVF market and disturbed couples' family planning.
What are the Drivers Governing the In Vitro Fertilization Market Growth?
"The global in-vitro fertilization services market is expected to be driven by rising late first-time pregnancy rates and IVF success rates. However, high IVF treatment costs and problems, as well as little knowledge of IVF in developing countries, limit market expansion."
Globally, the median age of first time pregnancy has risen dramatically over the years. This development can be traced primarily to newer contraceptive procedures, later marriages, and an increasing percentage of women putting their jobs ahead of establishing a family.
Australian Institute of Health and Welfare statistics published in 2021, the average age of first time moms pregnancy in Australia grew from 27.9 years in 2009 to 31.9 years in 2019. With the typical age of first time pregnancy increasing, an increasing proportion of women are projected to struggle with spontaneous conception.
As a result of this circumstance, a rising number of women are obliged to seek IVF therapy, which is projected to fuel the IVF market's rise in the future years.
"Increased reproductive tourism, a growth in the number of fertility clinics, and lower IVF costs in developing nations compared to industrialized ones are likely to provide lucrative market expansion potential."
A variety of factors have contributed to the growth of the medical tourism business in emerging countries. In the United States, an IVF cycle costs roughly USD 12,000. However, in Brazil, the same treatment costs only USD 4,000. India is one of the most economical places for in vitro fertilization (IVF) and other infertility treatments globally, with over 500 distinct IVF centres.
In India, healthcare procedures cost up to 90% less than in the United States. In the United States, an IVF cycle costs over USD 12,000, however in India, the same cycle costs between USD 2,000 and USD 3,000. Techniques such as Testicular Sperm Extraction (PESA and TESE) and the creation of new products are being launched to boost the success rate of IVF.
What are the Global Market Constraints Regarding In Vitro Fertilization /IVF?
Worldwide, around 2.5 million in vitro fertilization (IVF) rounds are conducted each year. However, due to a lack of reimbursement rules, the cost of IVF therapy varies per nation. In addition, in certain regions of the world, a lack of insurance coverage and a bad reimbursement environment impede the expansion of this sector.
Infertility clinics are seeing an increase in older women seeking aid as the social landscape changes. Complications in pregnancy and labour become more likely as people get older. One of the key challenges for the IVF business is the falling success rates of IVF treatment procedures in patients as they get older.
However, issues with IVF treatment, such as multiple pregnancies and birth abnormalities, restrictions on three-parent IVF procedures, sporadic reimbursements, and the high cost of IVF treatments in the United States, limit the market's expansion.
Find your sweet spots for generating winning opportunities in this market.
Talk to AnalystComparative View of Adjacent In Vitro Fertilization Market
In Vitro Fertilization Market :
Attributes |
In Vitro Fertilization Market |
CAGR (2022 - 2032) |
9% |
Market Value (2026) |
US$ 990 Bn |
Growth Factor |
Rising awareness about fertility to drive demand. |
Opportunity |
Rising instances of medical tourism to drive demand. |
Key Trends |
Focus on Asia Pacific region to offer opportunities. |
Extracorporeal Membrane Oxygenation Systems Market :
Attributes |
Extracorporeal Membrane Oxygenation Systems Market |
CAGR (2022 - 2032) |
5% |
Market Value (2026) |
US$ 673 Mn |
Growth Factor |
Rising survival rates with ECMO to drive adoption. |
Opportunity |
Investments in respiratory segment to boost market position. |
Key Trends |
Development of portable devices to keep the market trendy. |
Wearable Healthcare Devices Market :
Attributes |
Wearable Healthcare Devices Market |
CAGR (2022 - 2032) |
13% |
Market Value (2026) |
US$ 30 Bn |
Growth Factor |
Shortage of physicians and fear of getting infected is shifting the trend towards mobile healthcare consulting. |
Opportunity |
Outbreak of COVID-19 to offer opportunities to the market players. |
Key Trends |
Innovation is the key for the players. |
A surge in the age category of first-time moms, dropping fertility rates, rising male infertility, rising obesity rates and frequent alcohol usage, and expanding awareness about the availability of treatment alternatives are all driving this in vitro fertilization market forward.
The growing knowledge of sophisticated in vitro fertilization (IVF) procedures, higher IVF success rates, and problems caused by delayed pregnancy onset have boosted the demand for IVF techniques worldwide.
The IVF procedure's complications, as well as the associated socio-ethical concerns. Moreover, the high cost and minimal success rate of IVF treatment and stringent laws and ethical issues are anticipated to hamper the in vitro fertilization market's growth.
Over the forecast period, the Sperm Separation Systems segment is expected to have the largest in vitro fertilization market share in the revenue generated.
For most assisted reproductive technologies (ART), such as in-vitro fertilization (IVF) and artificial insemination, sperm separation techniques are employed. These technologies are critical for ARTs because they offer pure samples used in subsequent operations. Additionally, the in vitro fertilization market is being driven by firms' increasing focus on creating innovative devices in assisted reproductive technology (ART) operations performed by fertility clinics and obstetrician-gynaecologist (OB/GYN) offices.
Owing to the increased frequency of related disorders such as polycystic ovarian syndrome, the in vitro fertilization market in North America is predicted to develop significantly (PCOS). The study in vitro fertilization market in the area is expected to be driven by a continual rise in the frequency of infertility in both sexes.
According to the SingleCare online survey, 20% of respondents got in vitro fertilization (IVF) in the United States in October 2020.
19% of those surveyed said they had polycystic ovarian syndrome (PCOS), and 25% said they were sterile for unexplained reasons. The in vitro fertilization market's expansion is fueled by the increased incidence of infertility.
The demand for infertility treatment devices in the sector is driven by newly opened fertility facilities and reimbursement policies for infertility treatment.
Which are the Key In Vitro Fertilization Market Segments?
"High success rate is the major driving factor of non-donor segment's growth, and it is preferred around the global market in IVF centres and fertility clinics."
Global study on in vitro fertilization IVF market categorized the market by product, cycle, end-user and type. These categories are further divided into small segments that perform differently in every region. Therefore, the driving factors, market space, and distribution channels differ with every performing segment.
What Type of Product Holds the Biggest Market Share in the In-Vitro Fertilization Market?
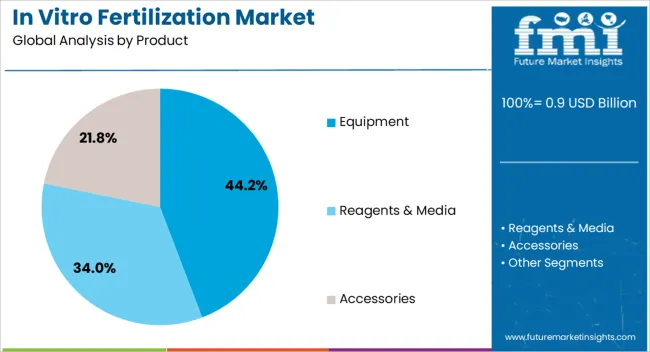
Based on product type, in vitro fertilization market is segmented into Equipment (Sperm analyzer systems, imaging systems Ovum aspiration pumps, incubators etc.), Reagents and media (Cryopreservation media, embryo culture media, ovum processing media etc.) and accessories.
The equipment segment is the biggest and likely holds the highest growth rate during the forecast period. Equipment is most in use, and their life cycle is also short. This equipment like incubators and imaging systems is also there in related advanced IVF procedures.
Which Segment Performs the Best in the In Vitro Fertilization Market Based on Cycle Type?
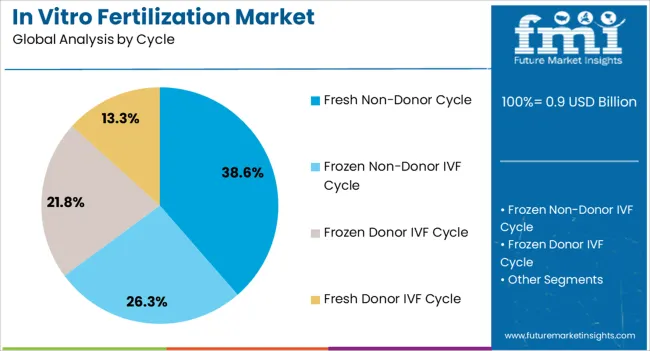
Based on the cycle, the in vitro fertilization IVF market is segmented into a fresh non-donor cycle, frozen, non-donor, and frozen donor, IVF, and fresh donor. The performing cycle in the global market is a fresh non-donor segment.
The driving factors behind the growth of this segment are a high success rate, better embryo donation & production and an easy implantation process. The high success rate is the major driving factor of its growth, and it is preferred around the global IVF markets.
What End User Generates the Highest Demand for In Vitro Fertilization Process?
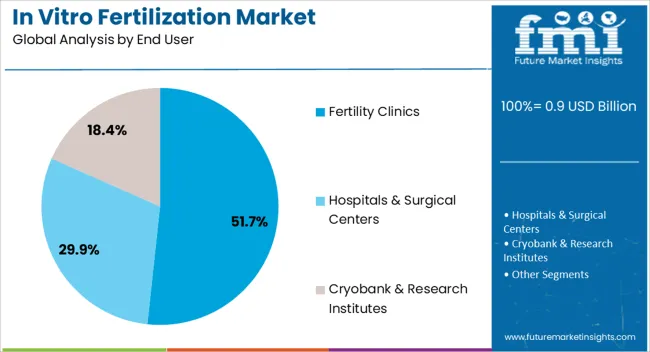
Based on end-user, the global IVF market is segmented into fertility clinics, hospitals & surgical centres, cryobank and research institutes. The segment that tops this category is the fertility clinic.
Fertility clinics that hold the largest share in the global market are likely to continue their streak in the forecast period. The excessive growth is the increasing government and international programs to set up fertility clinics IVF centres or adding IVF departments into hospitals.
What Type of In Vitro Fertilization Process is in High Demand?
The market is segmented into Conventional IVF, IVF with ICSI, and IVF with Donor Eggs. The biggest segment of this category is IVF with ICSI and is likely to hold the largest portion of the market in the forecast period. The boosting factors for his segment are the increasing usage of ICSI in IVF procedures and the high success rate associated with ICSI.

An unified Market Research Subscription Platform, built for today’s disparate research needs.
Which Region Leads the IVF Market?
"The acceptance of IVF procedures amongst the couples is another driving force of the overall growth."
In vitro fertilization, market / IVF market report distributes the global market into five major regions; North America, Europe, Asia Pacific (APAC), Middle East & Africa (MEA) and Latin America. IVF market is expanding all over the world, be it developed countries or underdeveloped regions.
The growing infertility rate and new IVF support centres opening up in the developing region is helping grow the market. The Asia Pacific region is the biggest market and will hold the largest portion of the global in-vitro fertilization / IVF market share. In Vitro fertilization, IVF market survey explains that the factors behind the market's growth in this region are increasing medical tourism, adoption of IVF procedures amongst masses and growing fertility clinics in this region.
Due to pollution and inactive lifestyle, the fertility rate is dropping in the region, accounting for the high sales of services here. Other regions like North America and Europe are the growing in vitro fertilization market.
Who are the Significant Players in the IVF Market?
In Vitro fertilization IVF market analysis states that the competitive landscape is dynamic and preciseness and care are the only USP with which these IVF centres lead in the global market. Companies form their strategies integrating it with the new-gen technology, providing better care and precision in the procedures.
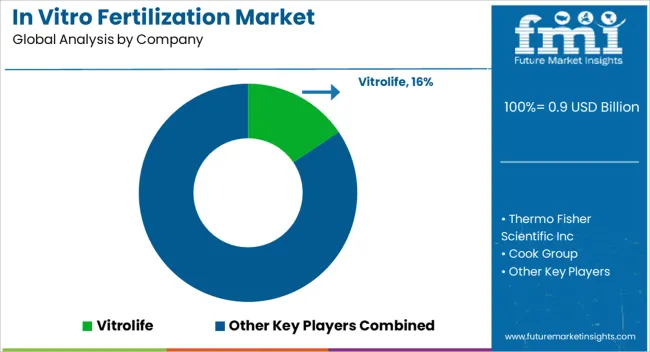
These companies compete on edge-to-edge on factors like care, precision and advanced procedure. In vitro fertilization market's major competitors are Cook Group, Vitrolife, Thermo Fisher Scientific Inc, Esco Micro, Genea Limited, IVFtech ApS, Fujifilm Irvine Scientific, The Baker Company and Kitazato Corporation.
Recent Market Development
- Hamilton Thorne Ltd. has received the FDA approval and now will start the commercialization procedure of GYNEMED GM501. This design is ready-to-use at medium level in vitro washing of oocytes and embryo transfer procedure in ivf covering the USA and European regions.
- A vitrification media solution, Vit Kit-NX, has been launched by Fujifilm Irvin Scientific.
- CooperSurgical has tied up with Vitrus Health to strengthen and update to cutting edge fertility technology, use IVF in medical research and help infertile couples with that advanced treatment.
Key Segments
By Product:
- Equipment
- Reagents and Media
By Cycle:
- Fresh non-donor cycle
- Frozen non-donor IVF cycle
- Frozen donor IVF cycle
- Fresh donor IVF cycle
By End User:
- Fertility Clinics
- Hospitals & Surgical Centers
- Cryobank and Research Institutes
By Type:
- Conventional IVF
- IVF with ICSI
- IVF with Donor Eggs
By Region:
- North America
- Latin America
- Middle East and Africa
- Asia Pacific
- Europe
Frequently Asked Questions
The in vitro fertilization market is anticipated to record 9% CAGR during the forecast period.
The projected value of in vitro fertilization market is expected to be US$ 1.6 Bn by 2032.
Thermo Fisher Scientific Inc., Vitrolife AB, Nikon Corporation, Fujifilm Corporation, Merck KGaA are the major companies operating in the in vitro fertilization market.
North America accounts for the largest revenue share.
Key factors that are driving the IVF market growth include an increase in cases of infertility and the development of advanced technologies.
1. Executive Summary
1.1. Global Market Outlook
1.2. Summary of Statistics
1.3. Key Market Characteristics & Attributes
1.4. Fact.MR Analysis and Recommendations
2. Market Overview
2.1. Market Coverage
2.2. Market Definition
3. Market Risks and Trends Assessment
3.1. Risk Assessment
3.1.1. COVID-19 Crisis and Impact on In Vitro Fertilization /IVF
3.1.2. COVID-19 Impact Benchmark with Previous Crisis
3.1.3. Impact on Market Value (US$ Mn)
3.1.4. Assessment by Key Countries
3.1.5. Assessment by Key Market Segments
3.1.6. Action Points and Recommendation for Suppliers
3.2. Key Trends Impacting the Market
3.3. Formulation and Product Development Trends
4. Market Background
4.1. In Vitro Fertilization /IVF Market, by Key Countries
4.2. In Vitro Fertilization /IVF Market Opportunity Assessment (US$ Mn)
4.2.1. Total Available Market
4.2.2. Serviceable Addressable Market
4.2.3. Serviceable Obtainable Market
4.3. Market Scenario Forecast
4.3.1. Demand in optimistic Scenario
4.3.2. Demand in Likely Scenario
4.3.3. Demand in Conservative Scenario
4.4. Investment Feasibility Analysis
4.4.1. Investment in Established Markets
4.4.1.1. In Short Term
4.4.1.2. In Long Term
4.4.2. Investment in Emerging Markets
4.4.2.1. In Short Term
4.4.2.2. In Long Term
4.5. Forecast Factors - Relevance & Impact
4.5.1. Top Companies Historical Growth
4.5.2. Growth in Automation, By Country
4.5.3. In Vitro Fertilization /IVF Adoption Rate, By Country
4.6. Market Dynamics
4.6.1. Market Driving Factors and Impact Assessment
4.6.2. Prominent Market Challenges and Impact Assessment
4.6.3. In Vitro Fertilization /IVF Market Opportunities
4.6.4. Prominent Trends in the Global Market & Their Impact Assessment
5. Key Success Factors
5.1. Manufacturers’ Focus on Low Penetration High Growth Markets
5.2. Banking on with Segments High Incremental Opportunity
5.3. Peer Benchmarking
6. Global In Vitro Fertilization /IVF Market Demand Analysis 2015-2021 and Forecast, 2022-2032
6.1. Historical Market Analysis, 2015-2021
6.2. Current and Future Market Projections, 2022-2032
6.3. Y-o-Y Growth Trend Analysis
7. Global In Vitro Fertilization /IVF Market Value Analysis 2015-2021 and Forecast, 2022-2032
7.1. Historical Market Value (US$ Mn) Analysis, 2015-2021
7.2. Current and Future Market Value (US$ Mn) Projections, 2022-2032
7.2.1. Y-o-Y Growth Trend Analysis
7.2.2. Absolute $ Opportunity Analysis
8. Global In Vitro Fertilization /IVF Market Analysis 2015-2021 and Forecast 2022-2032, By Product
8.1. Introduction / Key Findings
8.2. Historical Market Size (US$ Mn) Analysis By Product , 2015-2021
8.3. Current and Future Market Size (US$ Mn) Analysis and Forecast By Product , 2022-2032
8.3.1. Equipment
8.3.1.1. Sperm Analyzer Systems
8.3.1.2. Imaging Systems
8.3.1.3. Ovum Aspiration Pumps
8.3.1.4. Micromanipulator Systems
8.3.1.5. Incubators
8.3.1.6. Gas Analyzers
8.3.1.7. Laser Systems
8.3.1.8. Cryosystems
8.3.1.9. Sperm Separation Devices
8.3.1.10. IVF Cabinets
8.3.1.11. Anti-vibration Tables
8.3.1.12. Witness Systems
8.3.1.13. Other Equipments
8.3.2. Reagents & Media
8.3.2.1. Cryopreservation Media
8.3.2.2. Embryo Culture Media
8.3.2.3. Ovum Processing Media
8.3.2.4. Sperm Processing Media
8.3.3. Accessories
8.4. Market Attractiveness Analysis By Product
9. Global In Vitro Fertilization /IVF Market Analysis 2015-2021 and Forecast 2022-2032, By Cycle
9.1. Introduction / Key Findings
9.2. Historical Market Size (US$ Mn) Analysis By Cycle , 2015-2021
9.3. Current and Future Market Size (US$ Mn) Analysis and Forecast By Cycle , 2022-2032
9.3.1. Fresh Non-donor IVF Cycles
9.3.2. Frozen Non-donor IVF Cycles
9.3.3. Frozen Donor IVF Cycles
9.3.4. Fresh Donor IVF Cycle
9.4. Market Attractiveness Analysis By Cycle
10. Global In Vitro Fertilization /IVF Market Analysis 2015-2021 and Forecast 2022-2032, By End User
10.1. Introduction / Key Findings
10.2. Historical Market Size (US$ Mn) Analysis By End User , 2015-2021
10.3. Current and Future Market Size (US$ Mn) Analysis and Forecast By End User , 2022-2032
10.3.1. Fertility Clinics
10.3.2. Hospitals & Surgical Centers
10.3.3. Cryobanks
10.3.4. Research Institutes
10.4. Market Attractiveness Analysis By End User
11. Global In Vitro Fertilization /IVF Market Analysis 2015-2021 and Forecast 2022-2032, By Type
11.1. Introduction / Key Findings
11.2. Historical Market Size (US$ Mn) Analysis By Type, 2015-2021
11.3. Current and Future Market Size (US$ Mn) Analysis and Forecast By Type, 2022-2032
11.3.1. Conventional IVF
11.3.2. IVF with ICSI
11.3.3. IVF with Donar Eggs
11.3.4. Others
11.4. Market Attractiveness Analysis By Type
12. Global In Vitro Fertilization /IVF Market Analysis 2015-2021 and Forecast 2022-2032, By Region
12.1. Introduction
12.2. Historical Market Size (US$ Mn) Analysis By Region, 2015-2021
12.3. Current Market Size (US$ Mn) & Analysis and Forecast By Region, 2022-2032
12.3.1. North America
12.3.2. Latin America
12.3.3. Europe
12.3.4. Asia Pacific
12.3.5. Middle East and Africa (MEA)
12.4. Market Attractiveness Analysis By Region
13. North America In Vitro Fertilization /IVF Market Analysis 2015-2021 and Forecast 2022-2032
13.1. Introduction
13.2. Pricing Analysis
13.3. Historical Market Value (US$ Mn) Trend Analysis By Market Taxonomy, 2015-2021
13.4. Market Value (US$ Mn) & Forecast By Market Taxonomy, 2022-2032
13.4.1. By Country
13.4.1.1. U.S.
13.4.1.2. Canada
13.4.1.3. Rest of North America
13.4.2. By Product
13.4.3. By Cycle
13.4.4. By Type
13.4.5. By End User
13.5. Market Attractiveness Analysis
13.5.1. By Country
13.5.2. By Product
13.5.3. By Cycle
13.5.4. By Type
13.5.5. By End User
14. Latin America In Vitro Fertilization /IVF Market Analysis 2015-2021 and Forecast 2022-2032
14.1. Introduction
14.2. Pricing Analysis
14.3. Historical Market Value (US$ Mn) Trend Analysis By Market Taxonomy, 2015-2021
14.4. Market Value (US$ Mn) & Forecast By Market Taxonomy, 2022-2032
14.4.1. By Country
14.4.1.1. Brazil
14.4.1.2. Mexico
14.4.1.3. Rest of Latin America
14.4.2. By Product
14.4.3. By Cycle
14.4.4. By Type
14.4.5. By End User
14.5. Market Attractiveness Analysis
14.5.1. By Country
14.5.2. By Product
14.5.3. By Cycle
14.5.4. By Type
14.5.5. By End User
15. Europe In Vitro Fertilization /IVF Market Analysis 2015-2021 and Forecast 2022-2032
15.1. Introduction
15.2. Pricing Analysis
15.3. Historical Market Value (US$ Mn) Trend Analysis By Market Taxonomy, 2015-2021
15.4. Market Value (US$ Mn) & Forecast By Market Taxonomy, 2022-2032
15.4.1. By Country
15.4.1.1. Germany
15.4.1.2. France
15.4.1.3. U.K.
15.4.1.4. Italy
15.4.1.5. Benelux
15.4.1.6. Nordic Countries
15.4.1.7. Rest of Europe
15.4.2. By Product
15.4.3. By Cycle
15.4.4. By Type
15.4.5. By End User
15.5. Market Attractiveness Analysis
15.5.1. By Country
15.5.2. By Product
15.5.3. By Cycle
15.5.4. By Type
15.5.5. By End User
16. Asia Pacific In Vitro Fertilization /IVF Market Analysis 2015-2021 and Forecast 2022-2032
16.1. Introduction
16.2. Pricing Analysis
16.3. Historical Market Value (US$ Mn) Trend Analysis By Market Taxonomy, 2015-2021
16.4. Market Value (US$ Mn) & Forecast By Market Taxonomy, 2022-2032
16.4.1. By Country
16.4.1.1. China
16.4.1.2. Japan
16.4.1.3. South Korea
16.4.1.4. Rest of Asia Pacific
16.4.2. By Product
16.4.3. By Cycle
16.4.4. By Type
16.4.5. By End User
16.5. Market Attractiveness Analysis
16.5.1. By Country
16.5.2. By Product
16.5.3. By Cycle
16.5.4. By Type
16.5.5. By End User
17. Middle East and Africa In Vitro Fertilization /IVF Market Analysis 2015-2021 and Forecast 2022-2032
17.1. Introduction
17.2. Pricing Analysis
17.3. Historical Market Value (US$ Mn) Trend Analysis By Market Taxonomy, 2015-2021
17.4. Market Value (US$ Mn) & Forecast By Market Taxonomy, 2022-2032
17.4.1. By Country
17.4.1.1. GCC Countries
17.4.1.2. South Africa
17.4.1.3. Turkey
17.4.1.4. Rest of Middle East and Africa
17.4.2. By Product
17.4.3. By Cycle
17.4.4. By Type
17.4.5. By End User
17.5. Market Attractiveness Analysis
17.5.1. By Country
17.5.2. By Product
17.5.3. By Cycle
17.5.4. By Type
17.5.5. By End User
18. Key Countries In Vitro Fertilization /IVF Market Analysis 2015-2021 and Forecast 2022-2032
18.1. Introduction
18.1.1. Market Value Proportion Analysis, By Key Countries
18.1.2. Global Vs. Country Growth Comparison
18.2. US In Vitro Fertilization /IVF Market Analysis
18.2.1. Value Proportion Analysis by Market Taxonomy
18.2.2. Value Analysis and Forecast by Market Taxonomy, 2015-2032
18.2.2.1. By Product
18.2.2.2. By Cycle
18.2.2.3. By Type
18.2.2.4. By End User
18.3. Canada In Vitro Fertilization /IVF Market Analysis
18.3.1. Value Proportion Analysis by Market Taxonomy
18.3.2. Value Analysis and Forecast by Market Taxonomy, 2015-2032
18.3.2.1. By Product
18.3.2.2. By Cycle
18.3.2.3. By Type
18.3.2.4. By End User
18.4. Mexico In Vitro Fertilization /IVF Market Analysis
18.4.1. Value Proportion Analysis by Market Taxonomy
18.4.2. Value Analysis and Forecast by Market Taxonomy, 2015-2032
18.4.2.1. By Product
18.4.2.2. By Cycle
18.4.2.3. By Type
18.4.2.4. By End User
18.5. Brazil In Vitro Fertilization /IVF Market Analysis
18.5.1. Value Proportion Analysis by Market Taxonomy
18.5.2. Value Analysis and Forecast by Market Taxonomy, 2015-2032
18.5.2.1. By Product
18.5.2.2. By Cycle
18.5.2.3. By Type
18.5.2.4. By End User
18.6. Germany In Vitro Fertilization /IVF Market Analysis
18.6.1. Value Proportion Analysis by Market Taxonomy
18.6.2. Value Analysis and Forecast by Market Taxonomy, 2015-2032
18.6.2.1. By Product
18.6.2.2. By Cycle
18.6.2.3. By Type
18.6.2.4. By End User
18.7. France In Vitro Fertilization /IVF Market Analysis
18.7.1. Value Proportion Analysis by Market Taxonomy
18.7.2. Value Analysis and Forecast by Market Taxonomy, 2015-2032
18.7.2.1. By Product
18.7.2.2. By Cycle
18.7.2.3. By Type
18.7.2.4. By End User
18.8. Italy In Vitro Fertilization /IVF Market Analysis
18.8.1. Value Proportion Analysis by Market Taxonomy
18.8.2. Value Analysis and Forecast by Market Taxonomy, 2015-2032
18.8.2.1. By Product
18.8.2.2. By Cycle
18.8.2.3. By Type
18.8.2.4. By End User
18.9. BENELUX In Vitro Fertilization /IVF Market Analysis
18.9.1. Value Proportion Analysis by Market Taxonomy
18.9.2. Value Analysis and Forecast by Market Taxonomy, 2015-2032
18.9.2.1. By Product
18.9.2.2. By Cycle
18.9.2.3. By Type
18.9.2.4. By End User
18.10. UK In Vitro Fertilization /IVF Market Analysis
18.10.1. Value Proportion Analysis by Market Taxonomy
18.10.2. Value Analysis and Forecast by Market Taxonomy, 2015-2032
18.10.2.1. By Product
18.10.2.2. By Cycle
18.10.2.3. By Type
18.10.2.4. By End User
18.11. Nordic Countries In Vitro Fertilization /IVF Market Analysis
18.11.1. Value Proportion Analysis by Market Taxonomy
18.11.2. Value Analysis and Forecast by Market Taxonomy, 2015-2032
18.11.2.1. By Product
18.11.2.2. By Cycle
18.11.2.3. By Type
18.11.2.4. By End User
18.12. China In Vitro Fertilization /IVF Market Analysis
18.12.1. Value Proportion Analysis by Market Taxonomy
18.12.2. Value Analysis and Forecast by Market Taxonomy, 2015-2032
18.12.2.1. By Product
18.12.2.2. By Cycle
18.12.2.3. By Type
18.12.2.4. By End User
18.13. Japan In Vitro Fertilization /IVF Market Analysis
18.13.1. Value Proportion Analysis by Market Taxonomy
18.13.2. Value Analysis and Forecast by Market Taxonomy, 2015-2032
18.13.2.1. By Product
18.13.2.2. By Cycle
18.13.2.3. By Type
18.13.2.4. By End User
18.14. South Korea In Vitro Fertilization /IVF Market Analysis
18.14.1. Value Proportion Analysis by Market Taxonomy
18.14.2. Value Analysis and Forecast by Market Taxonomy, 2015-2032
18.14.2.1. By Product
18.14.2.2. By Cycle
18.14.2.3. By Type
18.14.2.4. By End User
18.15. GCC Countries In Vitro Fertilization /IVF Market Analysis
18.15.1. Value Proportion Analysis by Market Taxonomy
18.15.2. Value Analysis and Forecast by Market Taxonomy, 2015-2032
18.15.2.1. By Product
18.15.2.2. By Cycle
18.15.2.3. By Type
18.15.2.4. By End User
18.16. South Africa In Vitro Fertilization /IVF Market Analysis
18.16.1. Value Proportion Analysis by Market Taxonomy
18.16.2. Value Analysis and Forecast by Market Taxonomy, 2015-2032
18.16.2.1. By Product
18.16.2.2. By Cycle
18.16.2.3. By Type
18.16.2.4. By End User
18.17. Turkey In Vitro Fertilization /IVF Market Analysis
18.17.1. Value Proportion Analysis by Market Taxonomy
18.17.2. Value Analysis and Forecast by Market Taxonomy, 2015-2032
18.17.2.1. By Product
18.17.2.2. By Cycle
18.17.2.3. By Type
18.17.2.4. By End User
18.17.3. Competition Landscape and Player Concentration in the Country
19. Market Structure Analysis
19.1. Market Analysis by Tier of Companies
19.2. Market Concentration
19.3. Market Share Analysis of Top Players
19.4. Market Presence Analysis
19.4.1. By Regional footprint of Players
19.4.2. Product footprint by Players
20. Competition Analysis
20.1. Competition Dashboard
20.2. Competition Benchmarking
20.3. Competition Deep Dive
20.3.1. The Cooper Companies Inc
20.3.1.1. Overview
20.3.1.2. Product Portfolio
20.3.1.3. Sales Footprint
20.3.1.4. Strategy Overview
20.3.2. Cook Group
20.3.2.1. Overview
20.3.2.2. Product Portfolio
20.3.2.3. Sales Footprint
20.3.2.4. Strategy Overview
20.3.3. Vitrolife
20.3.3.1. Overview
20.3.3.2. Product Portfolio
20.3.3.3. Sales Footprint
20.3.3.4. Strategy Overview
20.3.4. Thermo Fisher Scientific, Inc
20.3.4.1. Overview
20.3.4.2. Product Portfolio
20.3.4.3. Sales Footprint
20.3.4.4. Strategy Overview
20.3.5. Esco Micro
20.3.5.1. Overview
20.3.5.2. Product Portfolio
20.3.5.3. Sales Footprint
20.3.5.4. Strategy Overview
20.3.6. Genea Limited
20.3.6.1. Overview
20.3.6.2. Product Portfolio
20.3.6.3. Sales Footprint
20.3.6.4. Strategy Overview
20.3.7. IVFtech ApS
20.3.7.1. Overview
20.3.7.2. Product Portfolio
20.3.7.3. Sales Footprint
20.3.7.4. Strategy Overview
20.3.8. FUJIFILM Irvine Scientific
20.3.8.1. Overview
20.3.8.2. Product Portfolio
20.3.8.3. Sales Footprint
20.3.8.4. Strategy Overview
20.3.9. The Baker Company
20.3.9.1. Overview
20.3.9.2. Product Portfolio
20.3.9.3. Sales Footprint
20.3.9.4. Strategy Overview
20.3.10. Kitazato Corporation
20.3.10.1. Overview
20.3.10.2. Product Portfolio
20.3.10.3. Sales Footprint
20.3.10.4. Strategy Overview
21. Assumptions and Acronyms Used
22. Research Methodology
Let us know your requirement to get
100% FREE customization
Table 1: Global In Vitro Fertilization /IVF Market Value (US$ Mn),By Product , 2015 – 2021
Table 2: Global In Vitro Fertilization /IVF Market Value (US$ Mn),By Product , 2022 – 2032
Table 3: Global In Vitro Fertilization /IVF Market Value (US$ Mn), By Cycle , 2015 – 2021
Table 4: Global In Vitro Fertilization /IVF Market Value (US$ Mn), By Cycle , 2022 – 2032
Table 5: Global In Vitro Fertilization /IVF Market Value (US$ Mn), By End User , 2015 – 2021
Table 6: Global In Vitro Fertilization /IVF Market Value (US$ Mn), By End User , 2022 – 2032
Table 7: Global In Vitro Fertilization /IVF Market Value (US$ Mn), By Type, 2015 – 2021
Table 8: Global In Vitro Fertilization /IVF Market Value (US$ Mn), By Type, 2022 – 2032
Table 9: Global In Vitro Fertilization /IVF Market, By Region, 2015 – 2021
Table 10: Global In Vitro Fertilization /IVF Market, By Region, 2022 – 2032
Table 11: North America In Vitro Fertilization /IVF Market Value (US$ Mn),By Product , 2015 – 2021
Table 12: North America In Vitro Fertilization /IVF Market Value (US$ Mn),By Product , 2022 – 2032
Table 13: North America In Vitro Fertilization /IVF Market Value (US$ Mn), By Cycle , 2015 – 2021
Table 14: North America In Vitro Fertilization /IVF Market Value (US$ Mn), By Cycle , 2022 – 2032
Table 15: North America In Vitro Fertilization /IVF Market Value (US$ Mn), By End User , 2015 – 2021
Table 16: North America In Vitro Fertilization /IVF Market Value (US$ Mn), By End User , 2022 – 2032
Table 17: North America In Vitro Fertilization /IVF Market Value (US$ Mn), By Type, 2015 – 2021
Table 18: North America In Vitro Fertilization /IVF Market Value (US$ Mn), By Type, 2022 – 2032
Table 19: North America In Vitro Fertilization /IVF Market, By Country, 2015 – 2021
Table 20: North America In Vitro Fertilization /IVF Market, By Country, 2022 – 2032
Table 21: Latin America In Vitro Fertilization /IVF Market Value (US$ Mn),By Product , 2015 – 2021
Table 22: Latin America In Vitro Fertilization /IVF Market Value (US$ Mn),By Product , 2022 – 2032
Table 23: Latin America In Vitro Fertilization /IVF Market Value (US$ Mn), By Cycle , 2015 – 2021
Table 24: Latin America In Vitro Fertilization /IVF Market Value (US$ Mn), By Cycle , 2022 – 2032
Table 25: Latin America In Vitro Fertilization /IVF Market Value (US$ Mn), By End User , 2015 – 2021
Table 26: Latin America In Vitro Fertilization /IVF Market Value (US$ Mn), By End User , 2022 – 2032
Table 27: Latin America In Vitro Fertilization /IVF Market Value (US$ Mn), By Type, 2015 – 2021
Table 28: Latin America In Vitro Fertilization /IVF Market Value (US$ Mn), By Type, 2022 – 2032
Table 29: Latin America In Vitro Fertilization /IVF Market, By Country, 2015 – 2021
Table 30: Latin America In Vitro Fertilization /IVF Market, By Country, 2022 – 2032
Table 31: Europe In Vitro Fertilization /IVF Market Value (US$ Mn),By Product , 2015 – 2021
Table 32: Europe In Vitro Fertilization /IVF Market Value (US$ Mn),By Product , 2022 – 2032
Table 33: Europe In Vitro Fertilization /IVF Market Value (US$ Mn), By Cycle , 2015 – 2021
Table 34: Europe In Vitro Fertilization /IVF Market Value (US$ Mn), By Cycle , 2022 – 2032
Table 35: Europe In Vitro Fertilization /IVF Market Value (US$ Mn), By End User , 2015 – 2021
Table 36: Europe In Vitro Fertilization /IVF Market Value (US$ Mn), By End User , 2022 – 2032
Table 37: Europe In Vitro Fertilization /IVF Market Value (US$ Mn), By Type, 2015 – 2021
Table 38: Europe In Vitro Fertilization /IVF Market Value (US$ Mn), By Type, 2022 – 2032
Table 39: Europe In Vitro Fertilization /IVF Market, By Country, 2015 – 2021
Table 40: Europe In Vitro Fertilization /IVF Market, By Country, 2022 – 2032
Table 41: Asia Pacific In Vitro Fertilization /IVF Market Value (US$ Mn),By Product , 2015 – 2021
Table 42: Asia Pacific In Vitro Fertilization /IVF Market Value (US$ Mn),By Product , 2022 – 2032
Table 43: Asia Pacific In Vitro Fertilization /IVF Market Value (US$ Mn), By Cycle , 2015 – 2021
Table 44: Asia Pacific In Vitro Fertilization /IVF Market Value (US$ Mn), By Cycle , 2022 – 2032
Table 45: Asia Pacific In Vitro Fertilization /IVF Market Value (US$ Mn), By End User , 2015 – 2021
Table 46: Asia Pacific In Vitro Fertilization /IVF Market Value (US$ Mn), By End User , 2022 – 2032
Table 47: Asia Pacific In Vitro Fertilization /IVF Market Value (US$ Mn), By Type, 2015 – 2021
Table 48: Asia Pacific In Vitro Fertilization /IVF Market Value (US$ Mn), By Type, 2022 – 2032
Table 49: Asia Pacific In Vitro Fertilization /IVF Market, By Country, 2015 – 2021
Table 50: Asia Pacific In Vitro Fertilization /IVF Market, By Country, 2022 – 2032
Table 51: MEA In Vitro Fertilization /IVF Market Value (US$ Mn),By Product , 2015 – 2021
Table 52: MEA In Vitro Fertilization /IVF Market Value (US$ Mn),By Product , 2022 – 2032
Table 53: MEA In Vitro Fertilization /IVF Market Value (US$ Mn), By Cycle , 2015 – 2021
Table 54: MEA In Vitro Fertilization /IVF Market Value (US$ Mn), By Cycle , 2022 – 2032
Table 55: MEA In Vitro Fertilization /IVF Market Value (US$ Mn), By End User , 2015 – 2021
Table 56: MEA In Vitro Fertilization /IVF Market Value (US$ Mn), By End User , 2022 – 2032
Table 57: MEA In Vitro Fertilization /IVF Market Value (US$ Mn), By Type, 2015 – 2021
Table 58: MEA In Vitro Fertilization /IVF Market Value (US$ Mn), By Type, 2022 – 2032
Table 59: MEA In Vitro Fertilization /IVF Market, By Country, 2015 – 2021
Table 60: MEA In Vitro Fertilization /IVF Market, By Country, 2022 – 2032
Find your sweet spots for generating winning opportunities in this market.
Talk to AnalystFigure 1: Global In Vitro Fertilization /IVF Market Value (US$ Mn) and Year-on-Year Growth, 2015-2032
Figure 2: Global In Vitro Fertilization /IVF Market Absolute $ Historical Gain (2015 - 2021) and Opportunity (2022 – 2032), US$ Mn
Figure 3: Global In Vitro Fertilization /IVF Market Share, By Product , 2022 & 2032
Figure 4: Global In Vitro Fertilization /IVF Market Y-o-Y Growth Projections, By Product – 2022-2032
Figure 5: Global In Vitro Fertilization /IVF Market Attractiveness Index, By Product – 2022-2032
Figure 6: Global In Vitro Fertilization /IVF Market Share, By Cycle , 2022 & 2032
Figure 7: Global In Vitro Fertilization /IVF Market Y-o-Y Growth Projections, By Cycle – 2022-2032
Figure 8: Global In Vitro Fertilization /IVF Market Attractiveness Index, By Cycle – 2022-2032
Figure 9: Global In Vitro Fertilization /IVF Market Share, By Type, 2022 & 2032
Figure 10: Global In Vitro Fertilization /IVF Market Y-o-Y Growth Projections, By Type – 2022-2032
Figure 11: Global In Vitro Fertilization /IVF Market Attractiveness Index, By Type – 2022-2032
Figure 12: Global In Vitro Fertilization /IVF Market Share, By End User , 2022 & 2032
Figure 13: Global In Vitro Fertilization /IVF Market Y-o-Y Growth Projections, By End User – 2022-2032
Figure 14: Global In Vitro Fertilization /IVF Market Attractiveness Index, By End User – 2022-2032
Figure 15: Global In Vitro Fertilization /IVF Market Share, By Region, 2022 & 2032
Figure 16: Global In Vitro Fertilization /IVF Market Y-o-Y Growth Projections, By Region – 2022-2032
Figure 17: Global In Vitro Fertilization /IVF Market Attractiveness Index, By Region – 2022-2032
Figure 18: North America In Vitro Fertilization /IVF Market Value (US$ Mn) and Year-on-Year Growth, 2015-2032
Figure 19: North America In Vitro Fertilization /IVF Market Absolute $ Opportunity Historical (2015 - 2021) and Forecast Period (2022 – 2032), US$ Mn
Figure 20: North America In Vitro Fertilization /IVF Market Share, By Product , 2022 & 2032
Figure 21: North America In Vitro Fertilization /IVF Market Y-o-Y Growth Projections, By Product – 2022-2032
Figure 22: North America In Vitro Fertilization /IVF Market Attractiveness Index, By Product – 2022-2032
Figure 23: North America In Vitro Fertilization /IVF Market Share, By Cycle , 2022 & 2032
Figure 24: North America In Vitro Fertilization /IVF Market Y-o-Y Growth Projections, By Cycle – 2022-2032
Figure 25: North America In Vitro Fertilization /IVF Market Attractiveness Index, By Cycle – 2022-2032
Figure 26: North America In Vitro Fertilization /IVF Market Share, By Type, 2022 & 2032
Figure 27: North America In Vitro Fertilization /IVF Market Y-o-Y Growth Projections, By Type – 2022-2032
Figure 28: North America In Vitro Fertilization /IVF Market Attractiveness Index, By Type – 2022-2032
Figure 29: North America In Vitro Fertilization /IVF Market Share, By End User , 2022 & 2032
Figure 30: North America In Vitro Fertilization /IVF Market Y-o-Y Growth Projections, By End User – 2022-2032
Figure 31: North America In Vitro Fertilization /IVF Market Attractiveness Index, By End User – 2022-2032
Figure 32: North America In Vitro Fertilization /IVF Market Share, By Country, 2022 & 2032
Figure 33: North America Market Y-o-Y Growth Projections, By Country – 2022-2032
Figure 34: North America Market Attractiveness Index, By Country – 2022-2032
Figure 35: Latin America In Vitro Fertilization /IVF Market Value (US$ Mn) and Year-on-Year Growth, 2015-2032
Figure 36: Latin America In Vitro Fertilization /IVF Market Absolute $ Opportunity Historical (2015 - 2021) and Forecast Period (2022 – 2032), US$ Mn
Figure 37: Latin America In Vitro Fertilization /IVF Market Share, By Product , 2022 & 2032
Figure 38: Latin America In Vitro Fertilization /IVF Market Y-o-Y Growth Projections, By Product – 2022-2032
Figure 39: Latin America In Vitro Fertilization /IVF Market Attractiveness Index, By Product – 2022-2032
Figure 40: Latin America In Vitro Fertilization /IVF Market Share, By Cycle , 2022 & 2032
Figure 41: Latin America In Vitro Fertilization /IVF Market Y-o-Y Growth Projections, By Cycle – 2022-2032
Figure 42: Latin America In Vitro Fertilization /IVF Market Attractiveness Index, By Cycle – 2022-2032
Figure 43: Latin America In Vitro Fertilization /IVF Market Share, By Type, 2022 & 2032
Figure 44: Latin America In Vitro Fertilization /IVF Market Y-o-Y Growth Projections, By Type – 2022-2032
Figure 45: Latin America In Vitro Fertilization /IVF Market Attractiveness Index, By Type – 2022-2032
Figure 46: Latin America In Vitro Fertilization /IVF Market Share, By End User , 2022 & 2032
Figure 47: Latin America In Vitro Fertilization /IVF Market Y-o-Y Growth Projections, By End User – 2022-2032
Figure 48: Latin America In Vitro Fertilization /IVF Market Attractiveness Index, By End User – 2022-2032
Figure 49: Latin America In Vitro Fertilization /IVF Market Share, By Country, 2022 & 2032
Figure 50: Latin America In Vitro Fertilization /IVF Market Y-o-Y Growth Projections, By Country – 2022-2032
Figure 51: Latin America In Vitro Fertilization /IVF Market Attractiveness Index, By Country – 2022-2032
Figure 52: Europe In Vitro Fertilization /IVF Market Value (US$ Mn) and Year-on-Year Growth, 2015-2032
Figure 53: Europe In Vitro Fertilization /IVF Market Absolute $ Opportunity Historical (2015 - 2021) and Forecast Period (2022 – 2032), US$ Mn
Figure 54: Europe In Vitro Fertilization /IVF Market Share, By Product , 2022 & 2032
Figure 55: Europe In Vitro Fertilization /IVF Market Y-o-Y Growth Projections, By Product – 2022-2032
Figure 56: Europe In Vitro Fertilization /IVF Market Attractiveness Index, By Product – 2022-2032
Figure 57: Europe In Vitro Fertilization /IVF Market Share, By Cycle , 2022 & 2032
Figure 58: Europe In Vitro Fertilization /IVF Market Y-o-Y Growth Projections, By Cycle – 2022-2032
Figure 59: Europe In Vitro Fertilization /IVF Market Attractiveness Index, By Cycle – 2022-2032
Figure 60: Europe In Vitro Fertilization /IVF Market Share, By Type, 2022 & 2032
Figure 61: Europe In Vitro Fertilization /IVF Market Y-o-Y Growth Projections, By Type – 2022-2032
Figure 62: Europe In Vitro Fertilization /IVF Market Attractiveness Index, By Type – 2022-2032
Figure 63: Europe In Vitro Fertilization /IVF Market Share, By End User , 2022 & 2032
Figure 64: Europe In Vitro Fertilization /IVF Market Y-o-Y Growth Projections, By End User – 2022-2032
Figure 65: Europe In Vitro Fertilization /IVF Market Attractiveness Index, By End User – 2022-2032
Figure 66: Europe In Vitro Fertilization /IVF Market Share, By Country, 2022 & 2032
Figure 67: Europe In Vitro Fertilization /IVF Market Y-o-Y Growth Projections, By Country – 2022-2032
Figure 68: Europe In Vitro Fertilization /IVF Market Attractiveness Index, By Country – 2022-2032
Figure 69: MEA In Vitro Fertilization /IVF Market Value (US$ Mn) and Year-on-Year Growth, 2015-2032
Figure 70: MEA In Vitro Fertilization /IVF Market Absolute $ Opportunity Historical (2015 - 2021) and Forecast Period (2022 – 2032), US$ Mn
Figure 71: MEA In Vitro Fertilization /IVF Market Share, By Product , 2022 & 2032
Figure 72: MEA In Vitro Fertilization /IVF Market Y-o-Y Growth Projections, By Product – 2022-2032
Figure 73: MEA In Vitro Fertilization /IVF Market Attractiveness Index, By Product – 2022-2032
Figure 74: MEA In Vitro Fertilization /IVF Market Share, By Cycle , 2022 & 2032
Figure 75: MEA In Vitro Fertilization /IVF Market Y-o-Y Growth Projections, By Cycle – 2022-2032
Figure 76: MEA In Vitro Fertilization /IVF Market Attractiveness Index, By Cycle – 2022-2032
Figure 77: MEA In Vitro Fertilization /IVF Market Share, By Type, 2022 & 2032
Figure 78: MEA In Vitro Fertilization /IVF Market Y-o-Y Growth Projections, By Type – 2022-2032
Figure 79: MEA In Vitro Fertilization /IVF Market Attractiveness Index, By Type – 2022-2032
Figure 80: MEA In Vitro Fertilization /IVF Market Share, By End User , 2022 & 2032
Figure 81: MEA In Vitro Fertilization /IVF Market Y-o-Y Growth Projections, By End User – 2022-2032
Figure 82: MEA In Vitro Fertilization /IVF Market Attractiveness Index, By End User – 2022-2032
Figure 83: MEA In Vitro Fertilization /IVF Market Share, By Country, 2022 & 2032
Figure 84: MEA In Vitro Fertilization /IVF Market Y-o-Y Growth Projections, By Country – 2022-2032
Figure 85: MEA In Vitro Fertilization /IVF Market Attractiveness Index, By Country – 2022-2032
Figure 86: Asia Pacific In Vitro Fertilization /IVF Market Value (US$ Mn) and Year-on-Year Growth, 2015-2032
Figure 87: Asia Pacific In Vitro Fertilization /IVF Market Absolute $ Opportunity Historical (2015 - 2021) and Forecast Period (2022 – 2032), US$ Mn
Figure 88: Asia Pacific In Vitro Fertilization /IVF Market Share, By Product , 2022 & 2032
Figure 89: Asia Pacific In Vitro Fertilization /IVF Market Y-o-Y Growth Projections, By Product – 2022-2032
Figure 90: Asia Pacific In Vitro Fertilization /IVF Market Attractiveness Index, By Product – 2022-2032
Figure 91: Asia Pacific In Vitro Fertilization /IVF Market Share, By Cycle , 2022 & 2032
Figure 92: Asia Pacific In Vitro Fertilization /IVF Market Y-o-Y Growth Projections, By Cycle – 2022-2032
Figure 93: Asia Pacific In Vitro Fertilization /IVF Market Attractiveness Index, By Cycle – 2022-2032
Figure 94: Asia Pacific In Vitro Fertilization /IVF Market Share, By Type, 2022 & 2032
Figure 95: Asia Pacific In Vitro Fertilization /IVF Market Y-o-Y Growth Projections, By Type – 2022-2032
Figure 96: Asia Pacific In Vitro Fertilization /IVF Market Attractiveness Index, By Type – 2022-2032
Figure 97: Asia Pacific In Vitro Fertilization /IVF Market Share, By End User , 2022 & 2032
Figure 98: Asia Pacific In Vitro Fertilization /IVF Market Y-o-Y Growth Projections, By End User – 2022-2032
Figure 99: Asia Pacific In Vitro Fertilization /IVF Market Attractiveness Index, By End User – 2022-2032
Figure 100: Asia Pacific In Vitro Fertilization /IVF Market Share, By Country, 2022 & 2032
Figure 101: Asia Pacific In Vitro Fertilization /IVF Market Y-o-Y Growth Projections, By Country – 2022-2032
Figure 102: Asia Pacific In Vitro Fertilization /IVF Market Attractiveness Index, By Country – 2022-2032
Need specific information?
Request CustomizationExplore Healthcare Insights
View Reports