Flaky Skin Treatment Market Size and Share Forecast Outlook 2025 to 2035

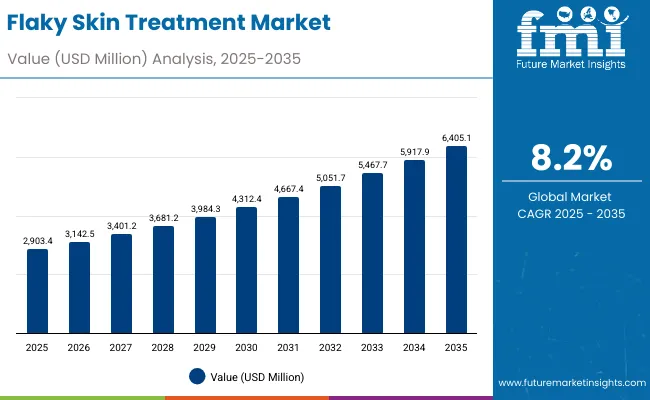
The Flaky Skin Treatment Market is expected to record a valuation of USD 2,903.4 million in 2025 and USD 6,405.1 million in 2035, with an increase of USD 3,501.7 million, which equals a growth of over 120% across the decade. The overall expansion represents a CAGR of 8.2% and a 2.2X increase in market size.

Quick Stats for Flaky Skin Treatment Market

  • Flaky Skin Treatment Market Value (2025): USD 2,903.4 million
  • Flaky Skin Treatment Market Forecast Value (2035): USD 6,405.1 million
  • Flaky Skin Treatment Market Forecast CAGR: 8.2%
  • Leading Segment in Flaky Skin Treatment Market in 2025: Creams (49.9%)
  • Key Growth Regions in the Flaky Skin Treatment Market: Asia-Pacific (China, India, Japan), North America, Europe
  • Top Key Players in Flaky Skin Treatment Market: Aveeno, CeraVe, Cetaphil, Eucerin, Burt’s Bees, La Roche-Posay, Neutrogena, Mustela, Paula’s Choice, Bioderma

Flaky Skin Treatment Market Key Takeaways

Metric Value
Flaky Skin Treatment Market Estimated Value in (2025E) USD 2,903.4 million
Flaky Skin Treatment Market Forecast Value in (2035F) USD 6,405.1 million
Forecast CAGR (2025 to 2035) 8.2%

Flaky Skin Treatment Market

During the first five-year period from 2025 to 2030, the market increases from USD 2,903.4 million to USD 4,312.4 million, adding USD 1,409.0 million, which accounts for nearly 40% of the total decade growth. This phase records steady adoption among adults who represent nearly 60% of the demand, with creams dominating as the most accessible and trusted product type. Demand is further fueled by high usage in pharmacies and drugstores, as these remain the most convenient retail channels globally for both over-the-counter and dermatologist-recommended formulas. Adults drive adoption in this phase with eczema-related dryness and seasonal skin conditions as primary targets.

The second half from 2030 to 2035 contributes USD 2,092.7 million, equal to over 60% of total growth, as the market jumps from USD 4,312.4 million to USD 6,405.1 million. This acceleration is powered by strong growth in Asia-Pacific countries, particularly India and China, which record CAGRs of 22.7% and 19.8% respectively. Rising middle-class incomes, increased dermatology clinic visits, and growing consumer awareness of skincare contribute significantly to this surge. Japan strengthens its premium dermo-cosmetic positioning with a 16.4% CAGR, while Western markets such as the USA grow steadily, crossing USD 1,261.6 million in 2035. Balms and oils see faster adoption in the latter half due to increased consumer preferences for natural and clean-label solutions, while e-commerce channels significantly expand, overtaking mass retail in many emerging economies.

From 2020 to 2024, the Flaky Skin Treatment Market expanded steadily, rising from around USD 2,100 million to nearly USD 2,800 million, driven by higher consumer awareness of chronic skin dryness linked to eczema and psoriasis. During this period, the competitive landscape was dominated by pharmaceutical skincare brands and dermo-cosmetic players controlling nearly 70% of the value, with leaders such as CeraVe, Eucerin, and La Roche-Posay focusing on ceramide- and urea-based formulas backed by dermatologist endorsements.

Competitive differentiation relied heavily on clinical validation, product tolerability, and distribution via pharmacies and dermatology clinics. Clean-label and fragrance-free claims began gaining traction, but natural formulations like shea butter and colloidal oatmeal were still considered niche offerings, representing less than 15% of total sales.

Demand for flaky skin treatments will expand to USD 2,903.4 million in 2025, and the revenue mix will gradually shift as natural active ingredients such as shea butter and colloidal oatmeal gain share, while traditional ceramide-dominant brands continue to lead. By 2030, over 50% of products will carry dermatologist-tested and hypoallergenic claims, reflecting the global consumer preference for safety and skin barrier protection. From 2030 onwards, e-commerce will rise as a primary channel, especially in China and India, where direct-to-consumer online platforms and subscription-based skincare services are scaling rapidly.

Western markets such as the USA and Europe will consolidate, with pharmacies and drugstores retaining a strong foothold, while emerging Asia-Pacific markets accelerate growth through localized product innovation and rising adoption among younger demographics. The competitive advantage is shifting from pharmacy distribution alone to multi-channel retail presence, scientific claims, and brand trust combined with affordability and accessibility.

Why the Flaky Skin Treatment Market is Growing?

The Flaky Skin Treatment Market is witnessing rapid growth due to rising incidences of eczema-related and psoriasis-related dryness, which affect millions globally and require long-term treatment. Adults account for nearly 60% of demand, driven by higher exposure to urban pollution, stress, and seasonal variations in skin health. The increasing popularity of dermatologist-tested and fragrance-free claims reflects growing consumer demand for safe, clinically backed solutions that minimize irritation and strengthen the skin barrier.

Another major growth driver is the expansion of product accessibility across retail and e-commerce channels. Pharmacies and drugstores remain the most dominant distribution channels, holding nearly 48% of global share in 2025, supported by consumer trust in medical-grade skincare. However, e-commerce is gaining strong momentum, especially in Asia-Pacific, where platforms such as Tmall, Flipkart, and Amazon are reshaping consumer access to international and local dermo-cosmetic brands. Segment growth is led by creams, which remain the go-to product type for consumers due to ease of application, affordability, and clinical endorsement, while balms and oils are rapidly growing as consumers seek natural, moisturizing alternatives.

Segmental Analysis

The market is segmented by condition target, active ingredient, product type, claim, channel, and end user. Condition targets include eczema-related dryness, psoriasis-related dryness, seasonal dryness, and general skin flaking, reflecting the diverse clinical and lifestyle-driven needs of consumers. Active ingredients are led by ceramides, colloidal oatmeal, shea butter, urea, and glycerin, each offering distinct hydration and barrier-repair properties.

Product types include creams, balms, oils, and ointments, with creams holding the largest share due to clinical trust and wider availability. Claims driving growth include dermatologist-tested, fragrance-free, hypoallergenic, and clean-label, which highlight consumer preference for safety and sustainability. Distribution channels span pharmacies/drugstores, e-commerce, mass retail, and dermatology clinics, while end users include adults, children/babies, and seniors, with adults remaining the dominant consumer group globally.
Insights into the Product Type Segment with Creams Leading in Market Share

Flaky Skin Treatment Market By Product Type

Product Type Value Share% 2025
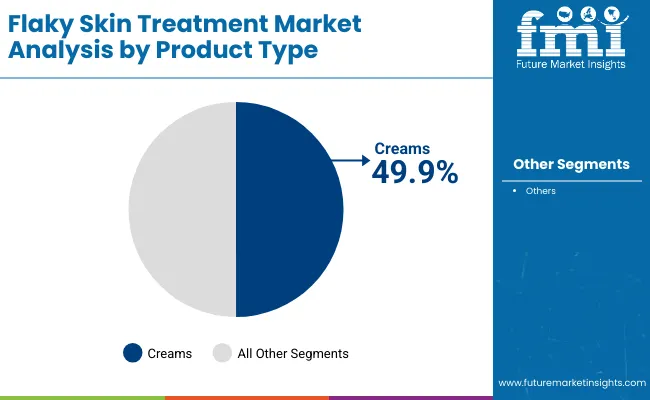
Creams 49.9%
Others 50.1%

The creams segment is projected to contribute 49.9% of the Flaky Skin Treatment Market revenue in 2025, maintaining its lead as the dominant product type. This is driven by their widespread acceptance among consumers, dermatologist recommendations, and proven ability to deliver consistent hydration for eczema, psoriasis, and seasonal dryness. Creams remain the most accessible and trusted solution, available across pharmacies, dermatology clinics, and e-commerce platforms worldwide.

The segment’s growth is also supported by innovations in formulation, including ceramide-enriched, colloidal oatmeal-based, and fragrance-free variants designed to suit sensitive skin. Convenience of application and strong clinical validation give creams a competitive edge over oils, balms, and ointments. As clean-label and hypoallergenic claims gain momentum, leading brands are reformulating creams to include natural actives such as shea butter and glycerin, while maintaining dermatologist-tested credentials. The creams segment is expected to retain its position as the backbone of the global flaky skin treatment category.
Insights into the Channel Segment with Pharmacies/Drugstores Dominating the Demand

Flaky Skin Treatment Market By Channel

Channel Value Share% 2025
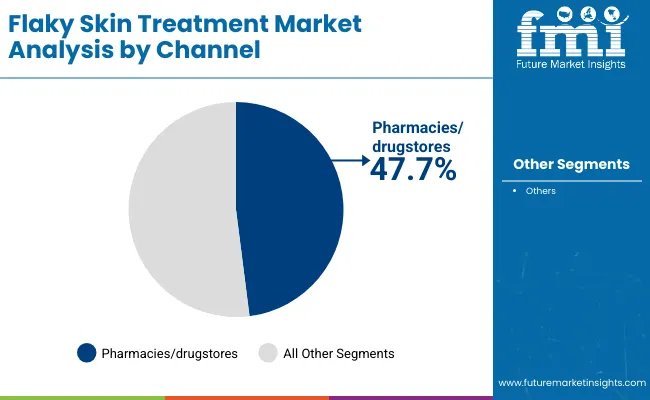
Pharmacies/drugstores 47.7%
Others 52.3%

The pharmacies/drugstores segment is forecasted to hold 47.7% of the market share in 2025, led by its role as the most trusted distribution channel for medical-grade skincare and dermatologist-recommended treatments. Consumers seeking reliable solutions for chronic conditions like eczema and psoriasis prefer pharmacy-based purchases, where credibility and clinical backing are central. These outlets also enable effective consumer education, as pharmacists often act as advisers in recommending dermatologist-tested and hypoallergenic formulas.

Pharmacies and drugstores are also heavily leveraged by leading brands such as CeraVe, Cetaphil, and Eucerin to launch new products, ensuring wide accessibility across global regions. Growth is further bolstered by the increasing presence of dermatology clinics attached to pharmacy chains, particularly in North America and Europe, enhancing the trust factor. While e-commerce is growing rapidly, pharmacies remain the dominant sales driver, especially in developed markets. The segment is expected to continue its dominance, anchored by consumer trust, regulatory oversight, and medical-grade positioning.
Insights into the End User Segment with Adults Driving Market Share

Flaky Skin Treatment Market By End User

End User Value Share% 2025
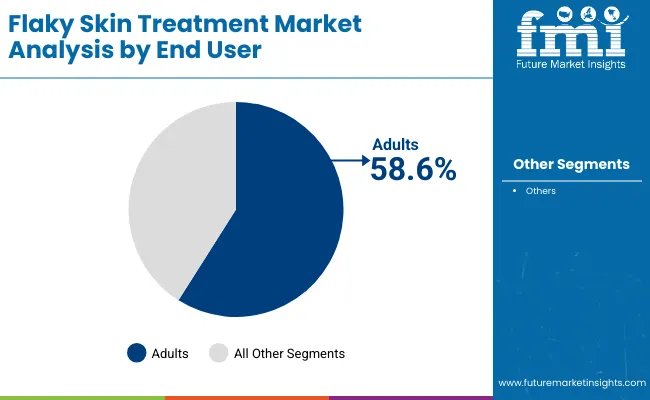
Adults 58.6%
Others 41.4%

The adults segment is projected to account for 58.6% of the Flaky Skin Treatment Market revenue in 2025, establishing it as the leading end-user category. Adults are more susceptible to chronic skin dryness caused by eczema, psoriasis, environmental pollution, and lifestyle-related stress. As such, they form the largest consumer base for both prescription and over-the-counter flaky skin treatments. This group drives demand across multiple product formats, from intensive creams and ointments to natural oils and balms, with a notable emphasis on dermatologist-tested and fragrance-free formulations.

Rising skincare awareness, supported by aggressive marketing campaigns from dermo-cosmetic brands, has further accelerated adoption among adults. In addition, adults in emerging economies are driving online sales, while consumers in developed countries continue to rely heavily on pharmacies and dermatology clinics. With consistent exposure to environmental triggers and a heightened focus on personal care, adults are expected to remain the cornerstone of demand in the Flaky Skin Treatment Market.

What are the Drivers, Restraints, and Key Trends of the Flaky Skin Treatment Market?

Drivers

Rising Prevalence of Chronic Skin Conditions Linked to Autoimmune Disorders

A significant driver of the Flaky Skin Treatment Market is the rising incidence of autoimmune-related skin conditions such as eczema and psoriasis, which are increasingly being diagnosed in adults and children alike. These conditions create a constant demand for long-term treatment options, where ceramide-based creams and dermatologist-tested ointments are viewed as essential daily-use products rather than discretionary purchases.

In markets like the USA and Europe, where medical dermatology is well established, this results in recurring pharmacy-driven sales. Meanwhile, in high-growth markets like India and China, increased awareness of psoriasis and eczema as chronic medical conditions has led to higher clinic visits and product prescriptions, boosting consistent uptake. This chronic condition-driven demand ensures the category remains resilient even during economic downturns, differentiating it from more discretionary skincare markets.

Accelerated Adoption of E-commerce as a Trusted Medical Skincare Channel in Emerging Asia

Another powerful driver is the rapid expansion of e-commerce platforms as credible distribution channels for clinical-grade skincare. Unlike traditional cosmetics, flaky skin treatment products have historically been pharmacy-dominated, but platforms such as Tmall in China, Flipkart in India, and Amazon’s specialized health & wellness verticals have transformed accessibility. For instance, in China, creams already account for over 50% of product sales (USD 162.9 million in 2025), with a large portion driven by cross-border e-commerce and direct-to-consumer brand strategies.

Online channels also facilitate subscription-based replenishment models, appealing to chronic skin condition patients who need continuous treatment. This shift is particularly impactful in Asia-Pacific, where consumer trust in online pharmacies and regulated digital health platforms is rising quickly.

Restraints

Price Sensitivity and Limited Affordability in Emerging Markets

Although the market is expanding globally, one key restraint is the high cost of clinically validated, dermatologist-tested formulas. In emerging markets such as India and Southeast Asia, price sensitivity remains high, and premium products from global brands like La Roche-Posay and CeraVe are often unaffordable for a majority of consumers. This has created a two-tier market, where international brands dominate niche urban segments, while mass consumers are left with less effective, lower-priced generic alternatives. The lack of affordable yet clinically proven mid-market options slows down the adoption curve and can limit overall market penetration despite high potential demand.

Regulatory Complexity in Claim Validation and Market Entry

A major restraint is the tightening global regulatory scrutiny around skincare claims such as "dermatologist-tested," "hypoallergenic," and "clean-label." For flaky skin treatments, where products border between cosmetic and therapeutic categories, compliance varies across regions. For example, in the USA and EU, ceramide- and urea-based treatments often undergo stricter oversight, while in Asia, regulatory ambiguity slows down product launches. This fragmented regulatory environment not only increases time-to-market but also drives up costs for global players, creating barriers for new entrants and smaller domestic brands trying to scale internationally.

Key Trends

Premiumization of Everyday Care Through Dermatology-backed Skincare

A notable trend is the increasing premiumization of daily skincare routines, where consumers view flaky skin treatment products as long-term essentials rather than occasional remedies. Adults, who make up nearly 60% of global demand (USD 1,699 million in 2025), are driving this shift, especially in developed regions like the USA, Germany, and the UK Here, dermatologist-endorsed, prescription-strength products are migrating into mainstream retail through partnerships with pharmacy chains and dermo-cosmetic outlets. This "medicalization of skincare" is elevating consumer willingness to pay more for trusted, clinically validated solutions, boosting both margins and brand loyalty for leading players.

Local Ingredient-driven Innovation in High-growth Asian Markets

Another important trend shaping the market is the rise of locally relevant formulations in high-growth markets like China and India. While global brands rely heavily on ceramides and urea, domestic players are innovating with culturally resonant ingredients such as Ayurvedic botanicals in India and fermented skincare actives in East Asia, blending tradition with clinical positioning. This not only allows local brands to resonate more deeply with regional consumers but also creates a competitive threat to global incumbents by addressing the price sensitivity barrier while aligning with clean-label and natural product preferences. The trend is particularly strong in markets like India, which is projected to grow at 22.7% CAGR, signaling both opportunity and rising competition for international brands.
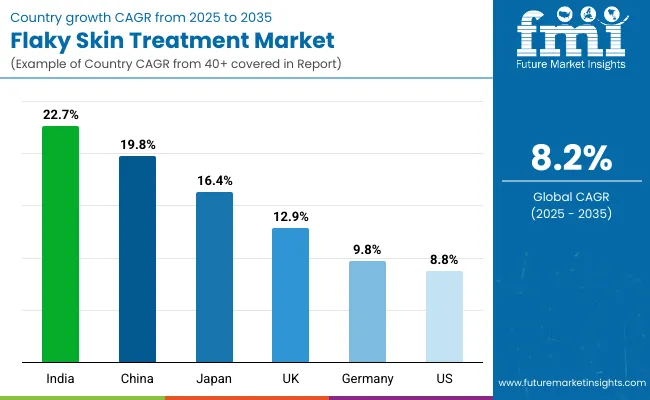
Analysis of Flaky Skin Treatment Market By Key Countries

Country Wise Analysis Flaky Skin Treatment Market

Countries Estimated CAGR (2025 to 2035)
China 19.8%
USA 8.8%
India 22.7%
UK 12.9%
Germany 9.8%
Japan 16.4%

The Flaky Skin Treatment Market shows a highly diverse growth trajectory across key countries. India (22.7% CAGR) and China (19.8% CAGR) stand out as the fastest-growing markets, fueled by rising disposable incomes, urbanization, and a surge in awareness of skin health. In these countries, a combination of increasing dermatology clinic visits, expanding e-commerce penetration, and strong marketing by both domestic and international brands is accelerating adoption.

For example, in China, creams already capture over half of the product mix, with growth further supported by cross-border e-commerce. In India, Ayurvedic and botanical-inspired innovations complement established dermo-cosmetic solutions, creating unique hybrid offerings that resonate with a price-sensitive but rapidly expanding consumer base. Japan (16.4% CAGR) also shows robust growth, driven by its strong culture of preventive skincare, premium positioning of products, and high consumer trust in dermatologist-backed solutions.

Meanwhile, Western markets exhibit steadier but substantial growth. The USA (8.8% CAGR) remains the largest market in absolute terms, expected to reach USD 1,261.6 million by 2035, with adults representing nearly 60% of demand. Growth here is anchored by pharmacy-dominated distribution and rising demand for fragrance-free and hypoallergenic products that address chronic conditions like eczema and psoriasis.

Germany (9.8% CAGR) and the UK (12.9% CAGR) highlight Europe’s evolving landscape, where regulatory scrutiny is high, but consumers are increasingly drawn to clean-label and dermatologist-tested formulations. Germany continues to drive demand through its strong dermo-cosmetic heritage and pharmacy networks, while the UK benefits from rising consumer adoption of online skincare platforms. Collectively, these diverse growth patterns illustrate a global market where Asia-Pacific drives acceleration, and North America and Europe sustain steady, trust-driven expansion.
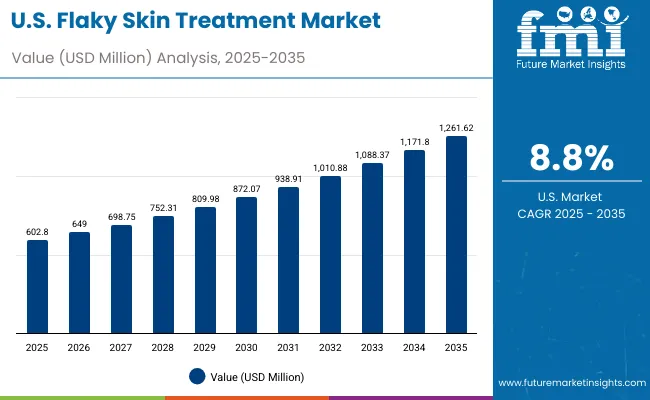
Sales Outlook for Flaky Skin Treatment in the United States

United States Flaky Skin Treatment Market

Year USA Flaky Skin Treatment Market (USD Million)
2025 602.80
2026 649.00
2027 698.75
2028 752.31
2029 809.98
2030 872.07
2031 938.91
2032 1,010.88
2033 1,088.37
2034 1,171.80
2035 1,261.62

The Flaky Skin Treatment Market in the United States is projected to grow at a CAGR of 8.8%, led by high demand for dermatologist-tested and fragrance-free solutions addressing chronic conditions like eczema and psoriasis. Adults form the largest consumer base, representing nearly 60% of sales in 2025, supported by strong retail access through pharmacies and drugstores. The USA market also shows increasing adoption of hypoallergenic and clean-label formulations as awareness of sensitive skin care rises. Growth is further supported by e-commerce expansion, though pharmacies remain the primary retail driver due to consumer trust in medical-grade skincare.

  • Eczema and psoriasis care dominate adult consumer demand in the USA
  • Pharmacies and dermatology clinics remain the most trusted retail outlets.
  • Hypoallergenic and fragrance-free claims are key differentiators for market growth.

Growth and Expansion Outlook for Flaky Skin Treatment in the United Kingdom

The Flaky Skin Treatment Market in the United Kingdom is expected to grow at a CAGR of 12.9%, supported by rising consumer awareness and demand for dermatologist-tested, sensitive-skin solutions. British consumers show strong preference for fragrance-free and clean-label products, a trend accelerated by regulatory oversight and marketing campaigns emphasizing safety. Pharmacies and drugstores remain important distribution hubs, while online platforms are becoming increasingly popular for specialty products. Premium brands such as La Roche-Posay and Bioderma are expanding through both pharmacies and e-commerce, while mass-market players continue to build share.

  • Consumers in the UK prioritize dermatologist-backed and clean-label skincare.
  • Pharmacies retain dominance, but online platforms are gaining momentum.
  • Premium dermo-cosmetics are expanding market penetration through dual-channel strategies.

Growth and Expansion Outlook for Flaky Skin Treatment in India

India is witnessing rapid growth in the Flaky Skin Treatment Market, which is forecast to expand at a CAGR of 22.7% through 2035, the fastest among leading countries. Growth is supported by expanding e-commerce penetration in tier-2 and tier-3 cities, where affordability and accessibility of creams and balms are driving adoption. Rising disposable incomes and dermatology awareness campaigns are fueling increased diagnosis of eczema and psoriasis, creating strong long-term demand. Local players are incorporating Ayurvedic botanicals with ceramides and glycerin to offer hybrid solutions at competitive price points, catering to cost-sensitive but aspirational consumers.
  • Tier-2 and tier-3 city adoption is rising due to expanding e-commerce and affordability.
  • Ayurvedic and botanical blends are gaining traction alongside dermo-cosmetic creams.
  • Dermatology clinics and awareness campaigns are fueling higher treatment uptake.

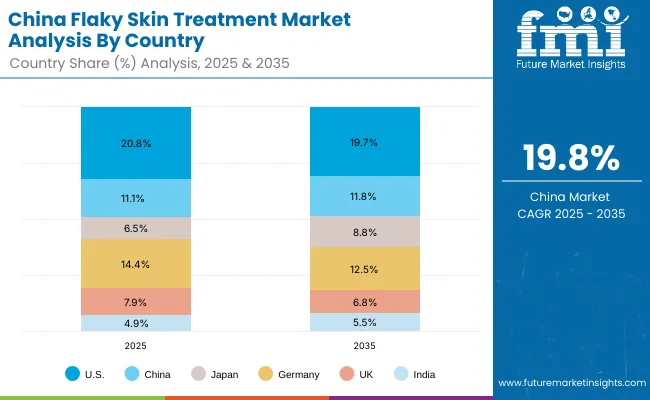
Sales Outlook for Flaky Skin Treatment in China

China Flaky Skin Treatment Market

Countries 2025 Share (%)
USA 20.8%
China 11.1%
Japan 6.5%
Germany 14.4%
UK 7.9%
India 4.9%
Countries 2035 Share (%)
USA 19.7%
China 11.8%
Japan 8.8%
Germany 12.5%
UK 6.8%
India 5.5%

The Flaky Skin Treatment Market in China is expected to grow at a CAGR of 19.8%, among the highest globally. Growth momentum is supported by strong demand for creams, which already account for over 50% of the product mix (USD 162.9 million in 2025). E-commerce and cross-border retail platforms like Tmall and JD.com dominate distribution, providing consumers access to both global dermo-cosmetic brands and innovative local players. Government-led awareness programs on dermatological care and the increasing role of dermatology clinics in urban centers further drive growth. Affordable formulations from domestic brands, combined with premium imports, are enabling broader adoption across consumer groups.

  • E-commerce platforms drive majority of sales, especially for creams and ointments.
  • Global brands and local players compete in offering dermatologist-backed solutions.
  • Urban dermatology clinics and public awareness initiatives strengthen consumer trust.

Growth Outlook for Flaky Skin Treatment Market in the USA

USA by End User Value Share% 2025
Adults 59.9%
Others 40.1%

The Flaky Skin Treatment Market in the United States is projected at USD 602.8 million in 2025, growing at a steady 8.8% CAGR through 2035. Adults dominate consumption with a 59.9% share (USD 361.0 million), reflecting the high prevalence of eczema- and psoriasis-related dryness in the population. Chronic dermatological conditions drive consistent pharmacy purchases, where clinically validated, fragrance-free, and hypoallergenic products are in strongest demand.

The USA market is defined by its reliance on pharmacy and dermatology clinic distribution, which continues to hold nearly half of all sales. While e-commerce platforms are expanding their role, consumer trust in pharmacist-recommended and dermatologist-tested products remains a defining factor. Innovation is focused on formulas enriched with ceramides and urea, which are widely recognized for repairing the skin barrier. The rise of subscription-based e-commerce platforms and digital health channels is expected to further increase product accessibility and repeat purchases.

  • Market in the USA holds share of 20.8% of the global market in 2025
  • Adults lead end user category at 59.9% vs 40.1%
  • Growth supported by strong pharmacy trust and dermatologist-recommended products

Opportunity Analysis of Flaky Skin Treatment Market in China

China by Product Type Value Share% 2025
Creams 50.7%
Others 49.3%

The Flaky Skin Treatment Market in China is valued at USD 321.6 million in 2025, with creams leading at 50.7% (USD 162.9 million), followed by balms, oils, and ointments collectively holding 49.3% (USD 158.6 million). The dominance of creams reflects their affordability, versatility, and alignment with consumer preference for fast-absorbing, multi-purpose treatments. The strong positioning of international brands alongside domestic players has made creams the most accessible and trusted format.

China’s market expansion, at a CAGR of 19.8%, is fueled by e-commerce dominance through platforms like Tmall and JD.com, which enable consumers to access both global dermo-cosmetic brands and competitively priced domestic solutions. Public health initiatives promoting dermatological awareness, combined with urban consumers’ growing demand for dermatologist-tested and hypoallergenic products, are driving strong uptake. Local firms are also innovating with urea- and shea butter-based creams, while premium imports target higher-income consumers.
  • Market size in China in 2025: USD 321.6 million
  • Global market share: 11.1% in 2025
  • Creams lead at 50.7%, supported by strong e-commerce penetration and domestic innovation

Competitive Landscape of the Flaky Skin Treatment Market

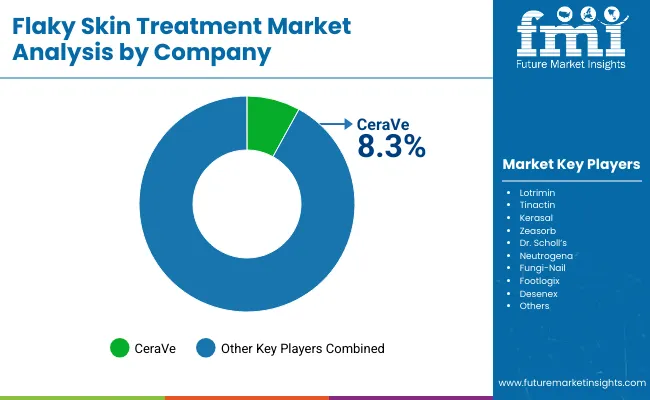
Flaky Skin Treatment Market By Company

Global Value Share 2025
CeraVe 8.3%
Others 91.7%

The Flaky Skin Treatment Market is moderately fragmented, with leading multinational dermo-cosmetic brands, established pharmacy-backed players, and natural care specialists competing for share. CeraVe leads the market in 2025 with an 8.3% global share, supported by its ceramide-rich formulations, strong pharmacy presence, and dermatologist endorsements, particularly in the USA and Europe. The brand’s ability to scale across both clinical and consumer segments has been central to its leadership. Other global players such as Aveeno, Cetaphil, Eucerin, La Roche-Posay, Neutrogena, and Bioderma hold significant positions by offering dermatologist-tested and fragrance-free products that dominate pharmacy shelves in North America and Europe. Their strategies increasingly emphasize clean-label claims, digital outreach, and expansion through e-commerce in Asia-Pacific.

Natural skincare specialists including Burt’s Bees and Mustela focus on botanically derived ingredients like shea butter, colloidal oatmeal, and glycerin, appealing to consumers seeking gentle, hypoallergenic solutions for children and babies. These brands are expanding their footprint in Europe and Asia by leveraging trust in "family-safe" products. Paula’s Choice, on the other hand, is gaining traction in premium e-commerce channels with its transparency-driven, ingredient-focused formulations. Competitive differentiation is shifting away from product availability alone toward integrated positioning around safety, dermatologist validation, and sustainability. Companies that successfully balance clinical claims with natural and clean-label positioning are best positioned to capture the dual demand of medical necessity and lifestyle-driven skincare.

Key Developments in Flaky Skin Treatment Market

  • On March 5, 2024, CeraVe launched its Eczema Relief Creamy Oil in the USA market, combining ceramides with safflower oil. The product was positioned as a dual-action solution for barrier repair and long-lasting moisturization.
  • On June 17, 2024, La Roche-Posay expanded its Lipikar AP+M Body Balm range in the European market, adding a fragrance-free baby-safe formulation. The launch targeted pediatric eczema treatment with dermatology endorsements.

Scope of the Report

Item Value
Quantitative Units USD Million
Condition Target Eczema-related dryness, Psoriasis-related dryness, Seasonal dryness, and General skin flaking
Active Ingredient Ceramides, Colloidal oatmeal, Shea butter, Urea, and Glycerin
Product Type Creams, Balms, Oils, and Ointments
Claim Dermatologist-tested, Fragrance-free, Hypoallergenic, and Clean-label
Channel Pharmacies/drugstores, E-commerce, Mass retail, and Dermatology clinics
End User Adults, Children/babies, and Seniors
Regions Covered North America, Europe, Asia-Pacific, Latin America, Middle East & Africa
Country Covered United States, Canada, Germany, France, United Kingdom, China, Japan, India, Brazil, South Africa
Key Companies Profiled Aveeno, CeraVe, Cetaphil, Eucerin, Burt’s Bees, La Roche-Posay, Neutrogena, Mustela, Paula’s Choice, and Bioderma
Additional Attributes Dollar sales by product type and channel, adoption trends in eczema- and psoriasis-related care, rising demand for fragrance-free and hypoallergenic treatments, sector-specific growth in adult and pediatric dermatology, clean-label and natural formulation innovation, revenue segmentation by retail pharmacy vs e-commerce, integration of digital health and subscription-based models, regional trends influenced by urbanization and rising skincare awareness, and innovations in ceramide, urea, and colloidal oatmeal formulations.

Key Segments

By Condition Target:

  • Eczema-related dryness
  • Psoriasis-related dryness
  • Seasonal dryness
  • General skin flaking

By Product Type:

  • Creams
  • Balms
  • Oils
  • Ointments

By Channel:

  • E-commerce
  • Pharmacies/drugstores
  • Mass retail
  • Dermatology clinics

By Claim:

  • Dermatologist-tested
  • Fragrance-free
  • Hypoallergenic
  • Clean-label

By End User:

  • Adults
  • Children/babies
  • Seniors

By Active Ingredient:

  • Ceramides
  • Colloidal oatmeal
  • Shea butter
  • Urea
  • Glycerin

By Region:

  • North America
  • Latin America
  • Europe
  • East Asia
  • South Asia & Pacific
  • Middle East and Africa

Frequently Asked Questions

How big is the Flaky Skin Treatment Market in 2025?

The Flaky Skin Treatment Market is estimated to be valued at USD 2,903.4 million in 2025.

What will be the size of the Flaky Skin Treatment Market in 2035?

The market size for the Flaky Skin Treatment Market is projected to reach USD 6,405.1 million by 2035.

How much will be the Flaky Skin Treatment Market growth between 2025 and 2035?

The Flaky Skin Treatment Market is expected to grow at a CAGR of 8.2% between 2025 and 2035.

What are the key product types in the Flaky Skin Treatment Market?

The key product types in the Flaky Skin Treatment Market are creams, balms, oils, and ointments.

Which channel segment will contribute significant share in the Flaky Skin Treatment Market in 2025?

In terms of channel, pharmacies/drugstores are projected to command a 47.7% share in the Flaky Skin Treatment Market in 2025.

Table of Content

  1. Executive Summary
    • Global Market Outlook
    • Demand-side Trends
    • Supply-side Trends
    • Technology Roadmap Analysis
    • Analysis and Recommendations
  2. Market Overview
    • Market Coverage / Taxonomy
    • Market Definition / Scope / Limitations
  3. Market Background
    • Market Dynamics
      • Drivers
      • Restraints
      • Opportunity
      • Trends
    • Scenario Forecast
      • Demand in Optimistic Scenario
      • Demand in Likely Scenario
      • Demand in Conservative Scenario
    • Opportunity Map Analysis
    • Product Life Cycle Analysis
    • Supply Chain Analysis
      • Supply Side Participants and their Roles
        • Producers
        • Mid-Level Participants (Traders/ Agents/ Brokers)
        • Wholesalers and Distributors
      • Value Added and Value Created at Node in the Supply Chain
      • List of Raw Material Suppliers
      • List of Existing and Potential Buyer’s
    • Investment Feasibility Matrix
    • Value Chain Analysis
      • Profit Margin Analysis
      • Wholesalers and Distributors
      • Retailers
    • PESTLE and Porter’s Analysis
    • Regulatory Landscape
      • By Key Regions
      • By Key Countries
    • Regional Parent Market Outlook
    • Production and Consumption Statistics
    • Import and Export Statistics
  4. Global Market Analysis 2020 to 2024 and Forecast, 2025 to 2035
    • Historical Market Size Value (USD Million) & Volume (Units) Analysis, 2020 to 2024
    • Current and Future Market Size Value (USD Million) & Volume (Units) Projections, 2025 to 2035
      • Y-o-Y Growth Trend Analysis
      • Absolute $ Opportunity Analysis
  5. Global Market Analysis 2020 to 2024 and Forecast 2025 to 2035, By Condition Target
    • Introduction / Key Findings
    • Historical Market Size Value (USD Million) & Volume (Units) Analysis By Condition Target, 2020 to 2024
    • Current and Future Market Size Value (USD Million) & Volume (Units) Analysis and Forecast By Condition Target, 2025 to 2035
      • Eczema-related dryness
      • Psoriasis-related dryness
      • Seasonal dryness
      • General skin flaking
    • Y-o-Y Growth Trend Analysis By Condition Target, 2020 to 2024
    • Absolute $ Opportunity Analysis By Condition Target, 2025 to 2035
  6. Global Market Analysis 2020 to 2024 and Forecast 2025 to 2035, By Product Type
    • Introduction / Key Findings
    • Historical Market Size Value (USD Million) & Volume (Units) Analysis By Product Type, 2020 to 2024
    • Current and Future Market Size Value (USD Million) & Volume (Units) Analysis and Forecast By Product Type, 2025 to 2035
      • Creams
      • Balms
      • Oils
      • Ointments
    • Y-o-Y Growth Trend Analysis By Product Type, 2020 to 2024
    • Absolute $ Opportunity Analysis By Product Type, 2025 to 2035
  7. Global Market Analysis 2020 to 2024 and Forecast 2025 to 2035, By Channel
    • Introduction / Key Findings
    • Historical Market Size Value (USD Million) & Volume (Units) Analysis By Channel, 2020 to 2024
    • Current and Future Market Size Value (USD Million) & Volume (Units) Analysis and Forecast By Channel, 2025 to 2035
      • E-commerce
      • Pharmacies/drugstores
      • Mass retail
      • Dermatology clinics
    • Y-o-Y Growth Trend Analysis By Channel, 2020 to 2024
    • Absolute $ Opportunity Analysis By Channel, 2025 to 2035
  8. Global Market Analysis 2020 to 2024 and Forecast 2025 to 2035, By Claim
    • Introduction / Key Findings
    • Historical Market Size Value (USD Million) & Volume (Units) Analysis By Claim, 2020 to 2024
    • Current and Future Market Size Value (USD Million) & Volume (Units) Analysis and Forecast By Claim, 2025 to 2035
      • Dermatologist-tested
      • Fragrance-free
      • Hypoallergenic
      • Clean-label
    • Y-o-Y Growth Trend Analysis By Claim, 2020 to 2024
    • Absolute $ Opportunity Analysis By Claim, 2025 to 2035
  9. Global Market Analysis 2020 to 2024 and Forecast 2025 to 2035, By End User
    • Introduction / Key Findings
    • Historical Market Size Value (USD Million) & Volume (Units) Analysis By End User, 2020 to 2024
    • Current and Future Market Size Value (USD Million) & Volume (Units) Analysis and Forecast By End User, 2025 to 2035
      • Adults
      • Children/babies
      • Seniors
    • Y-o-Y Growth Trend Analysis By End User, 2020 to 2024
    • Absolute $ Opportunity Analysis By End User, 2025 to 2035
  10. Global Market Analysis 2020 to 2024 and Forecast 2025 to 2035, By Active Ingredient
    • Introduction / Key Findings
    • Historical Market Size Value (USD Million) & Volume (Units) Analysis By Active Ingredient, 2020 to 2024
    • Current and Future Market Size Value (USD Million) & Volume (Units) Analysis and Forecast By Active Ingredient, 2025 to 2035
      • Ceramides
      • Colloidal oatmeal
      • Shea butter
      • Urea
      • Glycerin
    • Y-o-Y Growth Trend Analysis By Active Ingredient, 2020 to 2024
    • Absolute $ Opportunity Analysis By Active Ingredient, 2025 to 2035
  11. Global Market Analysis 2020 to 2024 and Forecast 2025 to 2035, By Region
    • Introduction
    • Historical Market Size Value (USD Million) & Volume (Units) Analysis By Region, 2020 to 2024
    • Current Market Size Value (USD Million) & Volume (Units) Analysis and Forecast By Region, 2025 to 2035
      • North America
      • Latin America
      • Europe
      • East Asia
      • South Asia & Pacific
      • Middle East and Africa
    • Market Attractiveness Analysis By Region
  12. North America Market Analysis 2020 to 2024 and Forecast 2025 to 2035, By Country
    • Historical Market Size Value (USD Million) & Volume (Units) Trend Analysis By Market Taxonomy, 2020 to 2024
    • Market Size Value (USD Million) & Volume (Units) Forecast By Market Taxonomy, 2025 to 2035
      • By Country
        • USA
        • Canada
      • By Condition Target
      • By Product Type
      • By Channel
      • By Claim
      • By End User
      • By Active Ingredient
    • Market Attractiveness Analysis
      • By Country
      • By Condition Target
      • By Product Type
      • By Channel
      • By Claim
      • By End User
      • By Active Ingredient
    • Key Takeaways
  13. Latin America Market Analysis 2020 to 2024 and Forecast 2025 to 2035, By Country
    • Historical Market Size Value (USD Million) & Volume (Units) Trend Analysis By Market Taxonomy, 2020 to 2024
    • Market Size Value (USD Million) & Volume (Units) Forecast By Market Taxonomy, 2025 to 2035
      • By Country
        • Brazil
        • Mexico
        • Colombia
        • Rest of Latin America
      • By Condition Target
      • By Product Type
      • By Channel
      • By Claim
      • By End User
      • By Active Ingredient
    • Market Attractiveness Analysis
      • By Country
      • By Condition Target
      • By Product Type
      • By Channel
      • By Claim
      • By End User
      • By Active Ingredient
    • Key Takeaways
  14. Europe Market Analysis 2020 to 2024 and Forecast 2025 to 2035, By Country
    • Historical Market Size Value (USD Million) & Volume (Units) Trend Analysis By Market Taxonomy, 2020 to 2024
    • Market Size Value (USD Million) & Volume (Units) Forecast By Market Taxonomy, 2025 to 2035
      • By Country
        • Germany
        • UK
        • France
        • Italy
        • Spain
        • Belgium
        • Netherlands
        • Nordic
        • Switzerland
        • Russia
        • Poland
        • Rest of Europe
      • By Condition Target
      • By Product Type
      • By Channel
      • By Claim
      • By End User
      • By Active Ingredient
    • Market Attractiveness Analysis
      • By Country
      • By Condition Target
      • By Product Type
      • By Channel
      • By Claim
      • By End User
      • By Active Ingredient
    • Key Takeaways
  15. East Asia Market Analysis 2020 to 2024 and Forecast 2025 to 2035, By Country
    • Historical Market Size Value (USD Million) & Volume (Units) Trend Analysis By Market Taxonomy, 2020 to 2024
    • Market Size Value (USD Million) & Volume (Units) Forecast By Market Taxonomy, 2025 to 2035
      • By Country
        • China
        • Japan
        • South Korea
      • By Condition Target
      • By Product Type
      • By Channel
      • By Claim
      • By End User
      • By Active Ingredient
    • Market Attractiveness Analysis
      • By Country
      • By Condition Target
      • By Product Type
      • By Channel
      • By Claim
      • By End User
      • By Active Ingredient
    • Key Takeaways
  16. South Asia & Pacific Market Analysis 2020 to 2024 and Forecast 2025 to 2035, By Country
    • Historical Market Size Value (USD Million) & Volume (Units) Trend Analysis By Market Taxonomy, 2020 to 2024
    • Market Size Value (USD Million) & Volume (Units) Forecast By Market Taxonomy, 2025 to 2035
      • By Country
        • India
        • Thailand
        • Malaysia
        • Indonesia
        • Singapore
        • Vietnam
        • Australia
        • New Zealand
        • Rest of South Asia
      • By Condition Target
      • By Product Type
      • By Channel
      • By Claim
      • By End User
      • By Active Ingredient
    • Market Attractiveness Analysis
      • By Country
      • By Condition Target
      • By Product Type
      • By Channel
      • By Claim
      • By End User
      • By Active Ingredient
    • Key Takeaways
  17. Middle East and Africa Market Analysis 2020 to 2024 and Forecast 2025 to 2035, By Country
    • Historical Market Size Value (USD Million) & Volume (Units) Trend Analysis By Market Taxonomy, 2020 to 2024
    • Market Size Value (USD Million) & Volume (Units) Forecast By Market Taxonomy, 2025 to 2035
      • By Country
        • Turkey
        • UAE
        • Saudi Arabia
        • Israel
        • Other GCC Countries
        • North Africa
        • South Africa
      • By Condition Target
      • By Product Type
      • By Channel
      • By Claim
      • By End User
      • By Active Ingredient
    • Market Attractiveness Analysis
      • By Country
      • By Condition Target
      • By Product Type
      • By Channel
      • By Claim
      • By End User
      • By Active Ingredient
    • Key Takeaways
  18. Key Countries Market Analysis
    • USA
      • Pricing Analysis
      • Market Share Analysis, 2024
        • By Condition Target
        • By Product Type
        • By Channel
        • By Claim
        • By End User
        • By Active Ingredient
    • Canada
      • Pricing Analysis
      • Market Share Analysis, 2024
        • By Condition Target
        • By Product Type
        • By Channel
        • By Claim
        • By End User
        • By Active Ingredient
    • Brazil
      • Pricing Analysis
      • Market Share Analysis, 2024
        • By Condition Target
        • By Product Type
        • By Channel
        • By Claim
        • By End User
        • By Active Ingredient
    • Mexico
      • Pricing Analysis
      • Market Share Analysis, 2024
        • By Condition Target
        • By Product Type
        • By Channel
        • By Claim
        • By End User
        • By Active Ingredient
    • Colombia
      • Pricing Analysis
      • Market Share Analysis, 2024
        • By Condition Target
        • By Product Type
        • By Channel
        • By Claim
        • By End User
        • By Active Ingredient
    • Germany
      • Pricing Analysis
      • Market Share Analysis, 2024
        • By Condition Target
        • By Product Type
        • By Channel
        • By Claim
        • By End User
        • By Active Ingredient
    • UK
      • Pricing Analysis
      • Market Share Analysis, 2024
        • By Condition Target
        • By Product Type
        • By Channel
        • By Claim
        • By End User
        • By Active Ingredient
    • France
      • Pricing Analysis
      • Market Share Analysis, 2024
        • By Condition Target
        • By Product Type
        • By Channel
        • By Claim
        • By End User
        • By Active Ingredient
    • Italy
      • Pricing Analysis
      • Market Share Analysis, 2024
        • By Condition Target
        • By Product Type
        • By Channel
        • By Claim
        • By End User
        • By Active Ingredient
    • Spain
      • Pricing Analysis
      • Market Share Analysis, 2024
        • By Condition Target
        • By Product Type
        • By Channel
        • By Claim
        • By End User
        • By Active Ingredient
    • Belgium
      • Pricing Analysis
      • Market Share Analysis, 2024
        • By Condition Target
        • By Product Type
        • By Channel
        • By Claim
        • By End User
        • By Active Ingredient
    • Netherlands
      • Pricing Analysis
      • Market Share Analysis, 2024
        • By Condition Target
        • By Product Type
        • By Channel
        • By Claim
        • By End User
        • By Active Ingredient
    • Nordic
      • Pricing Analysis
      • Market Share Analysis, 2024
        • By Condition Target
        • By Product Type
        • By Channel
        • By Claim
        • By End User
        • By Active Ingredient
    • Switzerland
      • Pricing Analysis
      • Market Share Analysis, 2024
        • By Condition Target
        • By Product Type
        • By Channel
        • By Claim
        • By End User
        • By Active Ingredient
    • Russia
      • Pricing Analysis
      • Market Share Analysis, 2024
        • By Condition Target
        • By Product Type
        • By Channel
        • By Claim
        • By End User
        • By Active Ingredient
    • Poland
      • Pricing Analysis
      • Market Share Analysis, 2024
        • By Condition Target
        • By Product Type
        • By Channel
        • By Claim
        • By End User
        • By Active Ingredient
    • China
      • Pricing Analysis
      • Market Share Analysis, 2024
        • By Condition Target
        • By Product Type
        • By Channel
        • By Claim
        • By End User
        • By Active Ingredient
    • Japan
      • Pricing Analysis
      • Market Share Analysis, 2024
        • By Condition Target
        • By Product Type
        • By Channel
        • By Claim
        • By End User
        • By Active Ingredient
    • South Korea
      • Pricing Analysis
      • Market Share Analysis, 2024
        • By Condition Target
        • By Product Type
        • By Channel
        • By Claim
        • By End User
        • By Active Ingredient
    • India
      • Pricing Analysis
      • Market Share Analysis, 2024
        • By Condition Target
        • By Product Type
        • By Channel
        • By Claim
        • By End User
        • By Active Ingredient
    • Thailand
      • Pricing Analysis
      • Market Share Analysis, 2024
        • By Condition Target
        • By Product Type
        • By Channel
        • By Claim
        • By End User
        • By Active Ingredient
    • Indonesia
      • Pricing Analysis
      • Market Share Analysis, 2024
        • By Condition Target
        • By Product Type
        • By Channel
        • By Claim
        • By End User
        • By Active Ingredient
    • Australia
      • Pricing Analysis
      • Market Share Analysis, 2024
        • By Condition Target
        • By Product Type
        • By Channel
        • By Claim
        • By End User
        • By Active Ingredient
    • New Zealand
      • Pricing Analysis
      • Market Share Analysis, 2024
        • By Condition Target
        • By Product Type
        • By Channel
        • By Claim
        • By End User
        • By Active Ingredient
    • Turkey
      • Pricing Analysis
      • Market Share Analysis, 2024
        • By Condition Target
        • By Product Type
        • By Channel
        • By Claim
        • By End User
        • By Active Ingredient
    • UAE
      • Pricing Analysis
      • Market Share Analysis, 2024
        • By Condition Target
        • By Product Type
        • By Channel
        • By Claim
        • By End User
        • By Active Ingredient
    • Saudi Arabia
      • Pricing Analysis
      • Market Share Analysis, 2024
        • By Condition Target
        • By Product Type
        • By Channel
        • By Claim
        • By End User
        • By Active Ingredient
    • Israel
      • Pricing Analysis
      • Market Share Analysis, 2024
        • By Condition Target
        • By Product Type
        • By Channel
        • By Claim
        • By End User
        • By Active Ingredient
    • North Africa
      • Pricing Analysis
      • Market Share Analysis, 2024
        • By Condition Target
        • By Product Type
        • By Channel
        • By Claim
        • By End User
        • By Active Ingredient
    • South Africa
      • Pricing Analysis
      • Market Share Analysis, 2024
        • By Condition Target
        • By Product Type
        • By Channel
        • By Claim
        • By End User
        • By Active Ingredient
  19. Market Structure Analysis
    • Competition Dashboard
    • Competition Benchmarking
    • Market Share Analysis of Top Players
      • By Regional
      • By Condition Target
      • By Product Type
      • By Channel
      • By Claim
      • By End User
      • By Active Ingredient
  20. Competition Analysis
    • Competition Deep Dive
      • Aveeno
        • Overview
        • Product Portfolio
        • Profitability by Market Segments (Product/Age /Sales Channel/Region)
        • Sales Footprint
        • Strategy Overview
          • Marketing Strategy
          • Product Strategy
          • Channel Strategy
      • CeraVe
        • Overview
        • Product Portfolio
        • Profitability by Market Segments (Product/Age /Sales Channel/Region)
        • Sales Footprint
        • Strategy Overview
          • Marketing Strategy
          • Product Strategy
          • Channel Strategy
      • Cetaphil
        • Overview
        • Product Portfolio
        • Profitability by Market Segments (Product/Age /Sales Channel/Region)
        • Sales Footprint
        • Strategy Overview
          • Marketing Strategy
          • Product Strategy
          • Channel Strategy
      • Eucerin
        • Overview
        • Product Portfolio
        • Profitability by Market Segments (Product/Age /Sales Channel/Region)
        • Sales Footprint
        • Strategy Overview
          • Marketing Strategy
          • Product Strategy
          • Channel Strategy
      • Burt’s Bees
        • Overview
        • Product Portfolio
        • Profitability by Market Segments (Product/Age /Sales Channel/Region)
        • Sales Footprint
        • Strategy Overview
          • Marketing Strategy
          • Product Strategy
          • Channel Strategy
      • La Roche-Posay
        • Overview
        • Product Portfolio
        • Profitability by Market Segments (Product/Age /Sales Channel/Region)
        • Sales Footprint
        • Strategy Overview
          • Marketing Strategy
          • Product Strategy
          • Channel Strategy
      • Neutrogena
        • Overview
        • Product Portfolio
        • Profitability by Market Segments (Product/Age /Sales Channel/Region)
        • Sales Footprint
        • Strategy Overview
          • Marketing Strategy
          • Product Strategy
          • Channel Strategy
      • Mustela
        • Overview
        • Product Portfolio
        • Profitability by Market Segments (Product/Age /Sales Channel/Region)
        • Sales Footprint
        • Strategy Overview
          • Marketing Strategy
          • Product Strategy
          • Channel Strategy
      • Paula’s Choice
        • Overview
        • Product Portfolio
        • Profitability by Market Segments (Product/Age /Sales Channel/Region)
        • Sales Footprint
        • Strategy Overview
          • Marketing Strategy
          • Product Strategy
          • Channel Strategy
      • Bioderma
        • Overview
        • Product Portfolio
        • Profitability by Market Segments (Product/Age /Sales Channel/Region)
        • Sales Footprint
        • Strategy Overview
          • Marketing Strategy
          • Product Strategy
          • Channel Strategy
  21. Assumptions & Acronyms Used
  22. Research Methodology

List of Tables

  • Table 1: Global Market Value (USD Million) Forecast by Region, 2020-2035
  • Table 2: Global Market Volume (Units) Forecast by Region, 2020-2035
  • Table 3: Global Market Value (USD Million) Forecast by Condition Target, 2020-2035
  • Table 4: Global Market Volume (Units) Forecast by Condition Target, 2020-2035
  • Table 5: Global Market Value (USD Million) Forecast by Product Type, 2020-2035
  • Table 6: Global Market Volume (Units) Forecast by Product Type, 2020-2035
  • Table 7: Global Market Value (USD Million) Forecast by Channel, 2020-2035
  • Table 8: Global Market Volume (Units) Forecast by Channel, 2020-2035
  • Table 9: Global Market Value (USD Million) Forecast by Claim, 2020-2035
  • Table 10: Global Market Volume (Units) Forecast by Claim, 2020-2035
  • Table 11: Global Market Value (USD Million) Forecast by End User, 2020-2035
  • Table 12: Global Market Volume (Units) Forecast by End User, 2020-2035
  • Table 13: Global Market Value (USD Million) Forecast by Active Ingredient, 2020-2035
  • Table 14: Global Market Volume (Units) Forecast by Active Ingredient, 2020-2035
  • Table 15: North America Market Value (USD Million) Forecast by Country, 2020-2035
  • Table 16: North America Market Volume (Units) Forecast by Country, 2020-2035
  • Table 17: North America Market Value (USD Million) Forecast by Condition Target, 2020-2035
  • Table 18: North America Market Volume (Units) Forecast by Condition Target, 2020-2035
  • Table 19: North America Market Value (USD Million) Forecast by Product Type, 2020-2035
  • Table 20: North America Market Volume (Units) Forecast by Product Type, 2020-2035
  • Table 21: North America Market Value (USD Million) Forecast by Channel, 2020-2035
  • Table 22: North America Market Volume (Units) Forecast by Channel, 2020-2035
  • Table 23: North America Market Value (USD Million) Forecast by Claim, 2020-2035
  • Table 24: North America Market Volume (Units) Forecast by Claim, 2020-2035
  • Table 25: North America Market Value (USD Million) Forecast by End User, 2020-2035
  • Table 26: North America Market Volume (Units) Forecast by End User, 2020-2035
  • Table 27: North America Market Value (USD Million) Forecast by Active Ingredient, 2020-2035
  • Table 28: North America Market Volume (Units) Forecast by Active Ingredient, 2020-2035
  • Table 29: Latin America Market Value (USD Million) Forecast by Country, 2020-2035
  • Table 30: Latin America Market Volume (Units) Forecast by Country, 2020-2035
  • Table 31: Latin America Market Value (USD Million) Forecast by Condition Target, 2020-2035
  • Table 32: Latin America Market Volume (Units) Forecast by Condition Target, 2020-2035
  • Table 33: Latin America Market Value (USD Million) Forecast by Product Type, 2020-2035
  • Table 34: Latin America Market Volume (Units) Forecast by Product Type, 2020-2035
  • Table 35: Latin America Market Value (USD Million) Forecast by Channel, 2020-2035
  • Table 36: Latin America Market Volume (Units) Forecast by Channel, 2020-2035
  • Table 37: Latin America Market Value (USD Million) Forecast by Claim, 2020-2035
  • Table 38: Latin America Market Volume (Units) Forecast by Claim, 2020-2035
  • Table 39: Latin America Market Value (USD Million) Forecast by End User, 2020-2035
  • Table 40: Latin America Market Volume (Units) Forecast by End User, 2020-2035
  • Table 41: Latin America Market Value (USD Million) Forecast by Active Ingredient, 2020-2035
  • Table 42: Latin America Market Volume (Units) Forecast by Active Ingredient, 2020-2035
  • Table 43: Europe Market Value (USD Million) Forecast by Country, 2020-2035
  • Table 44: Europe Market Volume (Units) Forecast by Country, 2020-2035
  • Table 45: Europe Market Value (USD Million) Forecast by Condition Target, 2020-2035
  • Table 46: Europe Market Volume (Units) Forecast by Condition Target, 2020-2035
  • Table 47: Europe Market Value (USD Million) Forecast by Product Type, 2020-2035
  • Table 48: Europe Market Volume (Units) Forecast by Product Type, 2020-2035
  • Table 49: Europe Market Value (USD Million) Forecast by Channel, 2020-2035
  • Table 50: Europe Market Volume (Units) Forecast by Channel, 2020-2035
  • Table 51: Europe Market Value (USD Million) Forecast by Claim, 2020-2035
  • Table 52: Europe Market Volume (Units) Forecast by Claim, 2020-2035
  • Table 53: Europe Market Value (USD Million) Forecast by End User, 2020-2035
  • Table 54: Europe Market Volume (Units) Forecast by End User, 2020-2035
  • Table 55: Europe Market Value (USD Million) Forecast by Active Ingredient, 2020-2035
  • Table 56: Europe Market Volume (Units) Forecast by Active Ingredient, 2020-2035
  • Table 57: East Asia Market Value (USD Million) Forecast by Country, 2020-2035
  • Table 58: East Asia Market Volume (Units) Forecast by Country, 2020-2035
  • Table 59: East Asia Market Value (USD Million) Forecast by Condition Target, 2020-2035
  • Table 60: East Asia Market Volume (Units) Forecast by Condition Target, 2020-2035
  • Table 61: East Asia Market Value (USD Million) Forecast by Product Type, 2020-2035
  • Table 62: East Asia Market Volume (Units) Forecast by Product Type, 2020-2035
  • Table 63: East Asia Market Value (USD Million) Forecast by Channel, 2020-2035
  • Table 64: East Asia Market Volume (Units) Forecast by Channel, 2020-2035
  • Table 65: East Asia Market Value (USD Million) Forecast by Claim, 2020-2035
  • Table 66: East Asia Market Volume (Units) Forecast by Claim, 2020-2035
  • Table 67: East Asia Market Value (USD Million) Forecast by End User, 2020-2035
  • Table 68: East Asia Market Volume (Units) Forecast by End User, 2020-2035
  • Table 69: East Asia Market Value (USD Million) Forecast by Active Ingredient, 2020-2035
  • Table 70: East Asia Market Volume (Units) Forecast by Active Ingredient, 2020-2035
  • Table 71: South Asia & Pacific Market Value (USD Million) Forecast by Country, 2020-2035
  • Table 72: South Asia & Pacific Market Volume (Units) Forecast by Country, 2020-2035
  • Table 73: South Asia & Pacific Market Value (USD Million) Forecast by Condition Target, 2020-2035
  • Table 74: South Asia & Pacific Market Volume (Units) Forecast by Condition Target, 2020-2035
  • Table 75: South Asia & Pacific Market Value (USD Million) Forecast by Product Type, 2020-2035
  • Table 76: South Asia & Pacific Market Volume (Units) Forecast by Product Type, 2020-2035
  • Table 77: South Asia & Pacific Market Value (USD Million) Forecast by Channel, 2020-2035
  • Table 78: South Asia & Pacific Market Volume (Units) Forecast by Channel, 2020-2035
  • Table 79: South Asia & Pacific Market Value (USD Million) Forecast by Claim, 2020-2035
  • Table 80: South Asia & Pacific Market Volume (Units) Forecast by Claim, 2020-2035
  • Table 81: South Asia & Pacific Market Value (USD Million) Forecast by End User, 2020-2035
  • Table 82: South Asia & Pacific Market Volume (Units) Forecast by End User, 2020-2035
  • Table 83: South Asia & Pacific Market Value (USD Million) Forecast by Active Ingredient, 2020-2035
  • Table 84: South Asia & Pacific Market Volume (Units) Forecast by Active Ingredient, 2020-2035
  • Table 85: Middle East and Africa Market Value (USD Million) Forecast by Country, 2020-2035
  • Table 86: Middle East and Africa Market Volume (Units) Forecast by Country, 2020-2035
  • Table 87: Middle East and Africa Market Value (USD Million) Forecast by Condition Target, 2020-2035
  • Table 88: Middle East and Africa Market Volume (Units) Forecast by Condition Target, 2020-2035
  • Table 89: Middle East and Africa Market Value (USD Million) Forecast by Product Type, 2020-2035
  • Table 90: Middle East and Africa Market Volume (Units) Forecast by Product Type, 2020-2035
  • Table 91: Middle East and Africa Market Value (USD Million) Forecast by Channel, 2020-2035
  • Table 92: Middle East and Africa Market Volume (Units) Forecast by Channel, 2020-2035
  • Table 93: Middle East and Africa Market Value (USD Million) Forecast by Claim, 2020-2035
  • Table 94: Middle East and Africa Market Volume (Units) Forecast by Claim, 2020-2035
  • Table 95: Middle East and Africa Market Value (USD Million) Forecast by End User, 2020-2035
  • Table 96: Middle East and Africa Market Volume (Units) Forecast by End User, 2020-2035
  • Table 97: Middle East and Africa Market Value (USD Million) Forecast by Active Ingredient, 2020-2035
  • Table 98: Middle East and Africa Market Volume (Units) Forecast by Active Ingredient, 2020-2035

List of Figures

  • Figure 1: Global Market Value (USD Million) by Condition Target, 2025-2035
  • Figure 2: Global Market Value (USD Million) by Product Type, 2025-2035
  • Figure 3: Global Market Value (USD Million) by Channel, 2025-2035
  • Figure 4: Global Market Value (USD Million) by Claim, 2025-2035
  • Figure 5: Global Market Value (USD Million) by End User, 2025-2035
  • Figure 6: Global Market Value (USD Million) by Active Ingredient, 2025-2035
  • Figure 7: Global Market Value (USD Million) by Region, 2025-2035
  • Figure 8: Global Market Value (USD Million) Analysis by Region, 2020-2035
  • Figure 9: Global Market Volume (Units) Analysis by Region, 2020-2035
  • Figure 10: Global Market Value Share (%) and BPS Analysis by Region, 2025-2035
  • Figure 11: Global Market Y-o-Y Growth (%) Projections by Region, 2025-2035
  • Figure 12: Global Market Value (USD Million) Analysis by Condition Target, 2020-2035
  • Figure 13: Global Market Volume (Units) Analysis by Condition Target, 2020-2035
  • Figure 14: Global Market Value Share (%) and BPS Analysis by Condition Target, 2025-2035
  • Figure 15: Global Market Y-o-Y Growth (%) Projections by Condition Target, 2025-2035
  • Figure 16: Global Market Value (USD Million) Analysis by Product Type, 2020-2035
  • Figure 17: Global Market Volume (Units) Analysis by Product Type, 2020-2035
  • Figure 18: Global Market Value Share (%) and BPS Analysis by Product Type, 2025-2035
  • Figure 19: Global Market Y-o-Y Growth (%) Projections by Product Type, 2025-2035
  • Figure 20: Global Market Value (USD Million) Analysis by Channel, 2020-2035
  • Figure 21: Global Market Volume (Units) Analysis by Channel, 2020-2035
  • Figure 22: Global Market Value Share (%) and BPS Analysis by Channel, 2025-2035
  • Figure 23: Global Market Y-o-Y Growth (%) Projections by Channel, 2025-2035
  • Figure 24: Global Market Value (USD Million) Analysis by Claim, 2020-2035
  • Figure 25: Global Market Volume (Units) Analysis by Claim, 2020-2035
  • Figure 26: Global Market Value Share (%) and BPS Analysis by Claim, 2025-2035
  • Figure 27: Global Market Y-o-Y Growth (%) Projections by Claim, 2025-2035
  • Figure 28: Global Market Value (USD Million) Analysis by End User, 2020-2035
  • Figure 29: Global Market Volume (Units) Analysis by End User, 2020-2035
  • Figure 30: Global Market Value Share (%) and BPS Analysis by End User, 2025-2035
  • Figure 31: Global Market Y-o-Y Growth (%) Projections by End User, 2025-2035
  • Figure 32: Global Market Value (USD Million) Analysis by Active Ingredient, 2020-2035
  • Figure 33: Global Market Volume (Units) Analysis by Active Ingredient, 2020-2035
  • Figure 34: Global Market Value Share (%) and BPS Analysis by Active Ingredient, 2025-2035
  • Figure 35: Global Market Y-o-Y Growth (%) Projections by Active Ingredient, 2025-2035
  • Figure 36: Global Market Attractiveness by Condition Target, 2025-2035
  • Figure 37: Global Market Attractiveness by Product Type, 2025-2035
  • Figure 38: Global Market Attractiveness by Channel, 2025-2035
  • Figure 39: Global Market Attractiveness by Claim, 2025-2035
  • Figure 40: Global Market Attractiveness by End User, 2025-2035
  • Figure 41: Global Market Attractiveness by Active Ingredient, 2025-2035
  • Figure 42: Global Market Attractiveness by Region, 2025-2035
  • Figure 43: North America Market Value (USD Million) by Condition Target, 2025-2035
  • Figure 44: North America Market Value (USD Million) by Product Type, 2025-2035
  • Figure 45: North America Market Value (USD Million) by Channel, 2025-2035
  • Figure 46: North America Market Value (USD Million) by Claim, 2025-2035
  • Figure 47: North America Market Value (USD Million) by End User, 2025-2035
  • Figure 48: North America Market Value (USD Million) by Active Ingredient, 2025-2035
  • Figure 49: North America Market Value (USD Million) by Country, 2025-2035
  • Figure 50: North America Market Value (USD Million) Analysis by Country, 2020-2035
  • Figure 51: North America Market Volume (Units) Analysis by Country, 2020-2035
  • Figure 52: North America Market Value Share (%) and BPS Analysis by Country, 2025-2035
  • Figure 53: North America Market Y-o-Y Growth (%) Projections by Country, 2025-2035
  • Figure 54: North America Market Value (USD Million) Analysis by Condition Target, 2020-2035
  • Figure 55: North America Market Volume (Units) Analysis by Condition Target, 2020-2035
  • Figure 56: North America Market Value Share (%) and BPS Analysis by Condition Target, 2025-2035
  • Figure 57: North America Market Y-o-Y Growth (%) Projections by Condition Target, 2025-2035
  • Figure 58: North America Market Value (USD Million) Analysis by Product Type, 2020-2035
  • Figure 59: North America Market Volume (Units) Analysis by Product Type, 2020-2035
  • Figure 60: North America Market Value Share (%) and BPS Analysis by Product Type, 2025-2035
  • Figure 61: North America Market Y-o-Y Growth (%) Projections by Product Type, 2025-2035
  • Figure 62: North America Market Value (USD Million) Analysis by Channel, 2020-2035
  • Figure 63: North America Market Volume (Units) Analysis by Channel, 2020-2035
  • Figure 64: North America Market Value Share (%) and BPS Analysis by Channel, 2025-2035
  • Figure 65: North America Market Y-o-Y Growth (%) Projections by Channel, 2025-2035
  • Figure 66: North America Market Value (USD Million) Analysis by Claim, 2020-2035
  • Figure 67: North America Market Volume (Units) Analysis by Claim, 2020-2035
  • Figure 68: North America Market Value Share (%) and BPS Analysis by Claim, 2025-2035
  • Figure 69: North America Market Y-o-Y Growth (%) Projections by Claim, 2025-2035
  • Figure 70: North America Market Value (USD Million) Analysis by End User, 2020-2035
  • Figure 71: North America Market Volume (Units) Analysis by End User, 2020-2035
  • Figure 72: North America Market Value Share (%) and BPS Analysis by End User, 2025-2035
  • Figure 73: North America Market Y-o-Y Growth (%) Projections by End User, 2025-2035
  • Figure 74: North America Market Value (USD Million) Analysis by Active Ingredient, 2020-2035
  • Figure 75: North America Market Volume (Units) Analysis by Active Ingredient, 2020-2035
  • Figure 76: North America Market Value Share (%) and BPS Analysis by Active Ingredient, 2025-2035
  • Figure 77: North America Market Y-o-Y Growth (%) Projections by Active Ingredient, 2025-2035
  • Figure 78: North America Market Attractiveness by Condition Target, 2025-2035
  • Figure 79: North America Market Attractiveness by Product Type, 2025-2035
  • Figure 80: North America Market Attractiveness by Channel, 2025-2035
  • Figure 81: North America Market Attractiveness by Claim, 2025-2035
  • Figure 82: North America Market Attractiveness by End User, 2025-2035
  • Figure 83: North America Market Attractiveness by Active Ingredient, 2025-2035
  • Figure 84: North America Market Attractiveness by Country, 2025-2035
  • Figure 85: Latin America Market Value (USD Million) by Condition Target, 2025-2035
  • Figure 86: Latin America Market Value (USD Million) by Product Type, 2025-2035
  • Figure 87: Latin America Market Value (USD Million) by Channel, 2025-2035
  • Figure 88: Latin America Market Value (USD Million) by Claim, 2025-2035
  • Figure 89: Latin America Market Value (USD Million) by End User, 2025-2035
  • Figure 90: Latin America Market Value (USD Million) by Active Ingredient, 2025-2035
  • Figure 91: Latin America Market Value (USD Million) by Country, 2025-2035
  • Figure 92: Latin America Market Value (USD Million) Analysis by Country, 2020-2035
  • Figure 93: Latin America Market Volume (Units) Analysis by Country, 2020-2035
  • Figure 94: Latin America Market Value Share (%) and BPS Analysis by Country, 2025-2035
  • Figure 95: Latin America Market Y-o-Y Growth (%) Projections by Country, 2025-2035
  • Figure 96: Latin America Market Value (USD Million) Analysis by Condition Target, 2020-2035
  • Figure 97: Latin America Market Volume (Units) Analysis by Condition Target, 2020-2035
  • Figure 98: Latin America Market Value Share (%) and BPS Analysis by Condition Target, 2025-2035
  • Figure 99: Latin America Market Y-o-Y Growth (%) Projections by Condition Target, 2025-2035
  • Figure 100: Latin America Market Value (USD Million) Analysis by Product Type, 2020-2035
  • Figure 101: Latin America Market Volume (Units) Analysis by Product Type, 2020-2035
  • Figure 102: Latin America Market Value Share (%) and BPS Analysis by Product Type, 2025-2035
  • Figure 103: Latin America Market Y-o-Y Growth (%) Projections by Product Type, 2025-2035
  • Figure 104: Latin America Market Value (USD Million) Analysis by Channel, 2020-2035
  • Figure 105: Latin America Market Volume (Units) Analysis by Channel, 2020-2035
  • Figure 106: Latin America Market Value Share (%) and BPS Analysis by Channel, 2025-2035
  • Figure 107: Latin America Market Y-o-Y Growth (%) Projections by Channel, 2025-2035
  • Figure 108: Latin America Market Value (USD Million) Analysis by Claim, 2020-2035
  • Figure 109: Latin America Market Volume (Units) Analysis by Claim, 2020-2035
  • Figure 110: Latin America Market Value Share (%) and BPS Analysis by Claim, 2025-2035
  • Figure 111: Latin America Market Y-o-Y Growth (%) Projections by Claim, 2025-2035
  • Figure 112: Latin America Market Value (USD Million) Analysis by End User, 2020-2035
  • Figure 113: Latin America Market Volume (Units) Analysis by End User, 2020-2035
  • Figure 114: Latin America Market Value Share (%) and BPS Analysis by End User, 2025-2035
  • Figure 115: Latin America Market Y-o-Y Growth (%) Projections by End User, 2025-2035
  • Figure 116: Latin America Market Value (USD Million) Analysis by Active Ingredient, 2020-2035
  • Figure 117: Latin America Market Volume (Units) Analysis by Active Ingredient, 2020-2035
  • Figure 118: Latin America Market Value Share (%) and BPS Analysis by Active Ingredient, 2025-2035
  • Figure 119: Latin America Market Y-o-Y Growth (%) Projections by Active Ingredient, 2025-2035
  • Figure 120: Latin America Market Attractiveness by Condition Target, 2025-2035
  • Figure 121: Latin America Market Attractiveness by Product Type, 2025-2035
  • Figure 122: Latin America Market Attractiveness by Channel, 2025-2035
  • Figure 123: Latin America Market Attractiveness by Claim, 2025-2035
  • Figure 124: Latin America Market Attractiveness by End User, 2025-2035
  • Figure 125: Latin America Market Attractiveness by Active Ingredient, 2025-2035
  • Figure 126: Latin America Market Attractiveness by Country, 2025-2035
  • Figure 127: Europe Market Value (USD Million) by Condition Target, 2025-2035
  • Figure 128: Europe Market Value (USD Million) by Product Type, 2025-2035
  • Figure 129: Europe Market Value (USD Million) by Channel, 2025-2035
  • Figure 130: Europe Market Value (USD Million) by Claim, 2025-2035
  • Figure 131: Europe Market Value (USD Million) by End User, 2025-2035
  • Figure 132: Europe Market Value (USD Million) by Active Ingredient, 2025-2035
  • Figure 133: Europe Market Value (USD Million) by Country, 2025-2035
  • Figure 134: Europe Market Value (USD Million) Analysis by Country, 2020-2035
  • Figure 135: Europe Market Volume (Units) Analysis by Country, 2020-2035
  • Figure 136: Europe Market Value Share (%) and BPS Analysis by Country, 2025-2035
  • Figure 137: Europe Market Y-o-Y Growth (%) Projections by Country, 2025-2035
  • Figure 138: Europe Market Value (USD Million) Analysis by Condition Target, 2020-2035
  • Figure 139: Europe Market Volume (Units) Analysis by Condition Target, 2020-2035
  • Figure 140: Europe Market Value Share (%) and BPS Analysis by Condition Target, 2025-2035
  • Figure 141: Europe Market Y-o-Y Growth (%) Projections by Condition Target, 2025-2035
  • Figure 142: Europe Market Value (USD Million) Analysis by Product Type, 2020-2035
  • Figure 143: Europe Market Volume (Units) Analysis by Product Type, 2020-2035
  • Figure 144: Europe Market Value Share (%) and BPS Analysis by Product Type, 2025-2035
  • Figure 145: Europe Market Y-o-Y Growth (%) Projections by Product Type, 2025-2035
  • Figure 146: Europe Market Value (USD Million) Analysis by Channel, 2020-2035
  • Figure 147: Europe Market Volume (Units) Analysis by Channel, 2020-2035
  • Figure 148: Europe Market Value Share (%) and BPS Analysis by Channel, 2025-2035
  • Figure 149: Europe Market Y-o-Y Growth (%) Projections by Channel, 2025-2035
  • Figure 150: Europe Market Value (USD Million) Analysis by Claim, 2020-2035
  • Figure 151: Europe Market Volume (Units) Analysis by Claim, 2020-2035
  • Figure 152: Europe Market Value Share (%) and BPS Analysis by Claim, 2025-2035
  • Figure 153: Europe Market Y-o-Y Growth (%) Projections by Claim, 2025-2035
  • Figure 154: Europe Market Value (USD Million) Analysis by End User, 2020-2035
  • Figure 155: Europe Market Volume (Units) Analysis by End User, 2020-2035
  • Figure 156: Europe Market Value Share (%) and BPS Analysis by End User, 2025-2035
  • Figure 157: Europe Market Y-o-Y Growth (%) Projections by End User, 2025-2035
  • Figure 158: Europe Market Value (USD Million) Analysis by Active Ingredient, 2020-2035
  • Figure 159: Europe Market Volume (Units) Analysis by Active Ingredient, 2020-2035
  • Figure 160: Europe Market Value Share (%) and BPS Analysis by Active Ingredient, 2025-2035
  • Figure 161: Europe Market Y-o-Y Growth (%) Projections by Active Ingredient, 2025-2035
  • Figure 162: Europe Market Attractiveness by Condition Target, 2025-2035
  • Figure 163: Europe Market Attractiveness by Product Type, 2025-2035
  • Figure 164: Europe Market Attractiveness by Channel, 2025-2035
  • Figure 165: Europe Market Attractiveness by Claim, 2025-2035
  • Figure 166: Europe Market Attractiveness by End User, 2025-2035
  • Figure 167: Europe Market Attractiveness by Active Ingredient, 2025-2035
  • Figure 168: Europe Market Attractiveness by Country, 2025-2035
  • Figure 169: East Asia Market Value (USD Million) by Condition Target, 2025-2035
  • Figure 170: East Asia Market Value (USD Million) by Product Type, 2025-2035
  • Figure 171: East Asia Market Value (USD Million) by Channel, 2025-2035
  • Figure 172: East Asia Market Value (USD Million) by Claim, 2025-2035
  • Figure 173: East Asia Market Value (USD Million) by End User, 2025-2035
  • Figure 174: East Asia Market Value (USD Million) by Active Ingredient, 2025-2035
  • Figure 175: East Asia Market Value (USD Million) by Country, 2025-2035
  • Figure 176: East Asia Market Value (USD Million) Analysis by Country, 2020-2035
  • Figure 177: East Asia Market Volume (Units) Analysis by Country, 2020-2035
  • Figure 178: East Asia Market Value Share (%) and BPS Analysis by Country, 2025-2035
  • Figure 179: East Asia Market Y-o-Y Growth (%) Projections by Country, 2025-2035
  • Figure 180: East Asia Market Value (USD Million) Analysis by Condition Target, 2020-2035
  • Figure 181: East Asia Market Volume (Units) Analysis by Condition Target, 2020-2035
  • Figure 182: East Asia Market Value Share (%) and BPS Analysis by Condition Target, 2025-2035
  • Figure 183: East Asia Market Y-o-Y Growth (%) Projections by Condition Target, 2025-2035
  • Figure 184: East Asia Market Value (USD Million) Analysis by Product Type, 2020-2035
  • Figure 185: East Asia Market Volume (Units) Analysis by Product Type, 2020-2035
  • Figure 186: East Asia Market Value Share (%) and BPS Analysis by Product Type, 2025-2035
  • Figure 187: East Asia Market Y-o-Y Growth (%) Projections by Product Type, 2025-2035
  • Figure 188: East Asia Market Value (USD Million) Analysis by Channel, 2020-2035
  • Figure 189: East Asia Market Volume (Units) Analysis by Channel, 2020-2035
  • Figure 190: East Asia Market Value Share (%) and BPS Analysis by Channel, 2025-2035
  • Figure 191: East Asia Market Y-o-Y Growth (%) Projections by Channel, 2025-2035
  • Figure 192: East Asia Market Value (USD Million) Analysis by Claim, 2020-2035
  • Figure 193: East Asia Market Volume (Units) Analysis by Claim, 2020-2035
  • Figure 194: East Asia Market Value Share (%) and BPS Analysis by Claim, 2025-2035
  • Figure 195: East Asia Market Y-o-Y Growth (%) Projections by Claim, 2025-2035
  • Figure 196: East Asia Market Value (USD Million) Analysis by End User, 2020-2035
  • Figure 197: East Asia Market Volume (Units) Analysis by End User, 2020-2035
  • Figure 198: East Asia Market Value Share (%) and BPS Analysis by End User, 2025-2035
  • Figure 199: East Asia Market Y-o-Y Growth (%) Projections by End User, 2025-2035
  • Figure 200: East Asia Market Value (USD Million) Analysis by Active Ingredient, 2020-2035
  • Figure 201: East Asia Market Volume (Units) Analysis by Active Ingredient, 2020-2035
  • Figure 202: East Asia Market Value Share (%) and BPS Analysis by Active Ingredient, 2025-2035
  • Figure 203: East Asia Market Y-o-Y Growth (%) Projections by Active Ingredient, 2025-2035
  • Figure 204: East Asia Market Attractiveness by Condition Target, 2025-2035
  • Figure 205: East Asia Market Attractiveness by Product Type, 2025-2035
  • Figure 206: East Asia Market Attractiveness by Channel, 2025-2035
  • Figure 207: East Asia Market Attractiveness by Claim, 2025-2035
  • Figure 208: East Asia Market Attractiveness by End User, 2025-2035
  • Figure 209: East Asia Market Attractiveness by Active Ingredient, 2025-2035
  • Figure 210: East Asia Market Attractiveness by Country, 2025-2035
  • Figure 211: South Asia & Pacific Market Value (USD Million) by Condition Target, 2025-2035
  • Figure 212: South Asia & Pacific Market Value (USD Million) by Product Type, 2025-2035
  • Figure 213: South Asia & Pacific Market Value (USD Million) by Channel, 2025-2035
  • Figure 214: South Asia & Pacific Market Value (USD Million) by Claim, 2025-2035
  • Figure 215: South Asia & Pacific Market Value (USD Million) by End User, 2025-2035
  • Figure 216: South Asia & Pacific Market Value (USD Million) by Active Ingredient, 2025-2035
  • Figure 217: South Asia & Pacific Market Value (USD Million) by Country, 2025-2035
  • Figure 218: South Asia & Pacific Market Value (USD Million) Analysis by Country, 2020-2035
  • Figure 219: South Asia & Pacific Market Volume (Units) Analysis by Country, 2020-2035
  • Figure 220: South Asia & Pacific Market Value Share (%) and BPS Analysis by Country, 2025-2035
  • Figure 221: South Asia & Pacific Market Y-o-Y Growth (%) Projections by Country, 2025-2035
  • Figure 222: South Asia & Pacific Market Value (USD Million) Analysis by Condition Target, 2020-2035
  • Figure 223: South Asia & Pacific Market Volume (Units) Analysis by Condition Target, 2020-2035
  • Figure 224: South Asia & Pacific Market Value Share (%) and BPS Analysis by Condition Target, 2025-2035
  • Figure 225: South Asia & Pacific Market Y-o-Y Growth (%) Projections by Condition Target, 2025-2035
  • Figure 226: South Asia & Pacific Market Value (USD Million) Analysis by Product Type, 2020-2035
  • Figure 227: South Asia & Pacific Market Volume (Units) Analysis by Product Type, 2020-2035
  • Figure 228: South Asia & Pacific Market Value Share (%) and BPS Analysis by Product Type, 2025-2035
  • Figure 229: South Asia & Pacific Market Y-o-Y Growth (%) Projections by Product Type, 2025-2035
  • Figure 230: South Asia & Pacific Market Value (USD Million) Analysis by Channel, 2020-2035
  • Figure 231: South Asia & Pacific Market Volume (Units) Analysis by Channel, 2020-2035
  • Figure 232: South Asia & Pacific Market Value Share (%) and BPS Analysis by Channel, 2025-2035
  • Figure 233: South Asia & Pacific Market Y-o-Y Growth (%) Projections by Channel, 2025-2035
  • Figure 234: South Asia & Pacific Market Value (USD Million) Analysis by Claim, 2020-2035
  • Figure 235: South Asia & Pacific Market Volume (Units) Analysis by Claim, 2020-2035
  • Figure 236: South Asia & Pacific Market Value Share (%) and BPS Analysis by Claim, 2025-2035
  • Figure 237: South Asia & Pacific Market Y-o-Y Growth (%) Projections by Claim, 2025-2035
  • Figure 238: South Asia & Pacific Market Value (USD Million) Analysis by End User, 2020-2035
  • Figure 239: South Asia & Pacific Market Volume (Units) Analysis by End User, 2020-2035
  • Figure 240: South Asia & Pacific Market Value Share (%) and BPS Analysis by End User, 2025-2035
  • Figure 241: South Asia & Pacific Market Y-o-Y Growth (%) Projections by End User, 2025-2035
  • Figure 242: South Asia & Pacific Market Value (USD Million) Analysis by Active Ingredient, 2020-2035
  • Figure 243: South Asia & Pacific Market Volume (Units) Analysis by Active Ingredient, 2020-2035
  • Figure 244: South Asia & Pacific Market Value Share (%) and BPS Analysis by Active Ingredient, 2025-2035
  • Figure 245: South Asia & Pacific Market Y-o-Y Growth (%) Projections by Active Ingredient, 2025-2035
  • Figure 246: South Asia & Pacific Market Attractiveness by Condition Target, 2025-2035
  • Figure 247: South Asia & Pacific Market Attractiveness by Product Type, 2025-2035
  • Figure 248: South Asia & Pacific Market Attractiveness by Channel, 2025-2035
  • Figure 249: South Asia & Pacific Market Attractiveness by Claim, 2025-2035
  • Figure 250: South Asia & Pacific Market Attractiveness by End User, 2025-2035
  • Figure 251: South Asia & Pacific Market Attractiveness by Active Ingredient, 2025-2035
  • Figure 252: South Asia & Pacific Market Attractiveness by Country, 2025-2035
  • Figure 253: Middle East and Africa Market Value (USD Million) by Condition Target, 2025-2035
  • Figure 254: Middle East and Africa Market Value (USD Million) by Product Type, 2025-2035
  • Figure 255: Middle East and Africa Market Value (USD Million) by Channel, 2025-2035
  • Figure 256: Middle East and Africa Market Value (USD Million) by Claim, 2025-2035
  • Figure 257: Middle East and Africa Market Value (USD Million) by End User, 2025-2035
  • Figure 258: Middle East and Africa Market Value (USD Million) by Active Ingredient, 2025-2035
  • Figure 259: Middle East and Africa Market Value (USD Million) by Country, 2025-2035
  • Figure 260: Middle East and Africa Market Value (USD Million) Analysis by Country, 2020-2035
  • Figure 261: Middle East and Africa Market Volume (Units) Analysis by Country, 2020-2035
  • Figure 262: Middle East and Africa Market Value Share (%) and BPS Analysis by Country, 2025-2035
  • Figure 263: Middle East and Africa Market Y-o-Y Growth (%) Projections by Country, 2025-2035
  • Figure 264: Middle East and Africa Market Value (USD Million) Analysis by Condition Target, 2020-2035
  • Figure 265: Middle East and Africa Market Volume (Units) Analysis by Condition Target, 2020-2035
  • Figure 266: Middle East and Africa Market Value Share (%) and BPS Analysis by Condition Target, 2025-2035
  • Figure 267: Middle East and Africa Market Y-o-Y Growth (%) Projections by Condition Target, 2025-2035
  • Figure 268: Middle East and Africa Market Value (USD Million) Analysis by Product Type, 2020-2035
  • Figure 269: Middle East and Africa Market Volume (Units) Analysis by Product Type, 2020-2035
  • Figure 270: Middle East and Africa Market Value Share (%) and BPS Analysis by Product Type, 2025-2035
  • Figure 271: Middle East and Africa Market Y-o-Y Growth (%) Projections by Product Type, 2025-2035
  • Figure 272: Middle East and Africa Market Value (USD Million) Analysis by Channel, 2020-2035
  • Figure 273: Middle East and Africa Market Volume (Units) Analysis by Channel, 2020-2035
  • Figure 274: Middle East and Africa Market Value Share (%) and BPS Analysis by Channel, 2025-2035
  • Figure 275: Middle East and Africa Market Y-o-Y Growth (%) Projections by Channel, 2025-2035
  • Figure 276: Middle East and Africa Market Value (USD Million) Analysis by Claim, 2020-2035
  • Figure 277: Middle East and Africa Market Volume (Units) Analysis by Claim, 2020-2035
  • Figure 278: Middle East and Africa Market Value Share (%) and BPS Analysis by Claim, 2025-2035
  • Figure 279: Middle East and Africa Market Y-o-Y Growth (%) Projections by Claim, 2025-2035
  • Figure 280: Middle East and Africa Market Value (USD Million) Analysis by End User, 2020-2035
  • Figure 281: Middle East and Africa Market Volume (Units) Analysis by End User, 2020-2035
  • Figure 282: Middle East and Africa Market Value Share (%) and BPS Analysis by End User, 2025-2035
  • Figure 283: Middle East and Africa Market Y-o-Y Growth (%) Projections by End User, 2025-2035
  • Figure 284: Middle East and Africa Market Value (USD Million) Analysis by Active Ingredient, 2020-2035
  • Figure 285: Middle East and Africa Market Volume (Units) Analysis by Active Ingredient, 2020-2035
  • Figure 286: Middle East and Africa Market Value Share (%) and BPS Analysis by Active Ingredient, 2025-2035
  • Figure 287: Middle East and Africa Market Y-o-Y Growth (%) Projections by Active Ingredient, 2025-2035
  • Figure 288: Middle East and Africa Market Attractiveness by Condition Target, 2025-2035
  • Figure 289: Middle East and Africa Market Attractiveness by Product Type, 2025-2035
  • Figure 290: Middle East and Africa Market Attractiveness by Channel, 2025-2035
  • Figure 291: Middle East and Africa Market Attractiveness by Claim, 2025-2035
  • Figure 292: Middle East and Africa Market Attractiveness by End User, 2025-2035
  • Figure 293: Middle East and Africa Market Attractiveness by Active Ingredient, 2025-2035
  • Figure 294: Middle East and Africa Market Attractiveness by Country, 2025-2035
Dashboard
Dashboard
Dashboard
Dashboard
Dashboard
Dashboard

Full Research Suite comprises of:

Market outlook & trends analysis

Market outlook & trends analysis

Interviews & case studies

Interviews & case studies

Strategic recommendations

Strategic recommendations

Vendor profiles & capabilities analysis

Vendor profiles & capabilities analysis

5-year forecasts

5-year forecasts

8 regions and 60+ country-level data splits

8 regions and 60+ country-level data splits

Market segment data splits

Market segment data splits

12 months of continuous data updates

12 months of continuous data updates

DELIVERED AS:

PDF EXCEL ONLINE

Full Research Suite


$2000

$3500

$5000

Buy Report Now
Similar Industry Reports

Similar Industry Reports

Skin Lightening Product Market

Skin Lightening Product Market Size and Share Forecast Outlook 2025 to 2035

Skincare Supplement Market

Skincare Supplement Market Size and Share Forecast Outlook 2025 to 2035

Skin Tightening Device Market

Skin Tightening Device Market Size and Share Forecast Outlook 2025 to 2035

Skincare Oil Market
Skincare Oil Market

Skincare Oil Market Size and Share Forecast Outlook 2025 to 2035

Skin-Barrier Strengthening Phospholipids Market

Skin-Barrier Strengthening Phospholipids Market Size and Share Forecast Outlook 2025 to 2035

Skin Toner Market
Skin Toner Market

Skin Toner Market Size and Share Forecast Outlook 2025 to 2035

Skin Cancer Detection Devices Market

Skin Cancer Detection Devices Market Size and Share Forecast Outlook 2025 to 2035

Skincare Nutritional Serum Market

Skincare Nutritional Serum Market Size and Share Forecast Outlook 2025 to 2035

Skincare Products Market

Skincare Products Market Size and Share Forecast Outlook 2025 to 2035

Skin Sensors Market
Skin Sensors Market

Skin Sensors Market Size, Growth, and Forecast for 2025 to 2035

Skin Grafting System Market

Skin Grafting System Market Size and Share Forecast Outlook 2025 to 2035

Skincare Market
Skincare Market

Skincare Market Analysis - Size, Share, and Forecast Outlook 2025 to 2035

Skincare Packaging Market

Skincare Packaging Market Size, Share & Forecast 2025 to 2035

Skin Perfusion Pressure Testing Devices Market

Skin Perfusion Pressure Testing Devices Market Size and Share Forecast Outlook 2025 to 2035

Skin Care Devices Market

Skin Care Devices Market Analysis - Trends & Forecast 2025 to 2035

Skin Antiseptic Market

Skin Antiseptic Market - Demand, Growth & Forecast 2025 to 2035

Skin Bioactive Market

Skin Bioactive Market Analysis - Trends, Growth & Forecast 2025 to 2035

Skin Replacement Market

Skin Replacement Market Growth - Trends & Forecast 2024 to 2034

Skin Lightening Lip Balm Market

Skin Lightening Lip Balm Market Trends – Demand & Forecast 2024-2034

Skincare Industry Analysis in India

Skincare Industry in India – Trends & Growth Forecast 2024-2034

Future Market Insights

Flaky Skin Treatment Market

Chat With MaRIA

Chat With

MaRIA

Hi There, I am MaRIA, Your Market Research Intelligence Assistant. How may I help you?