
- Market Size (2026)
- USD 896.8 Mn
- Forecast (2036)
- USD 1575.9 Mn
- CAGR (2026 to 2036)
- 5.8%
How Big Is the Gamma Butyrolactone Market in 2026?
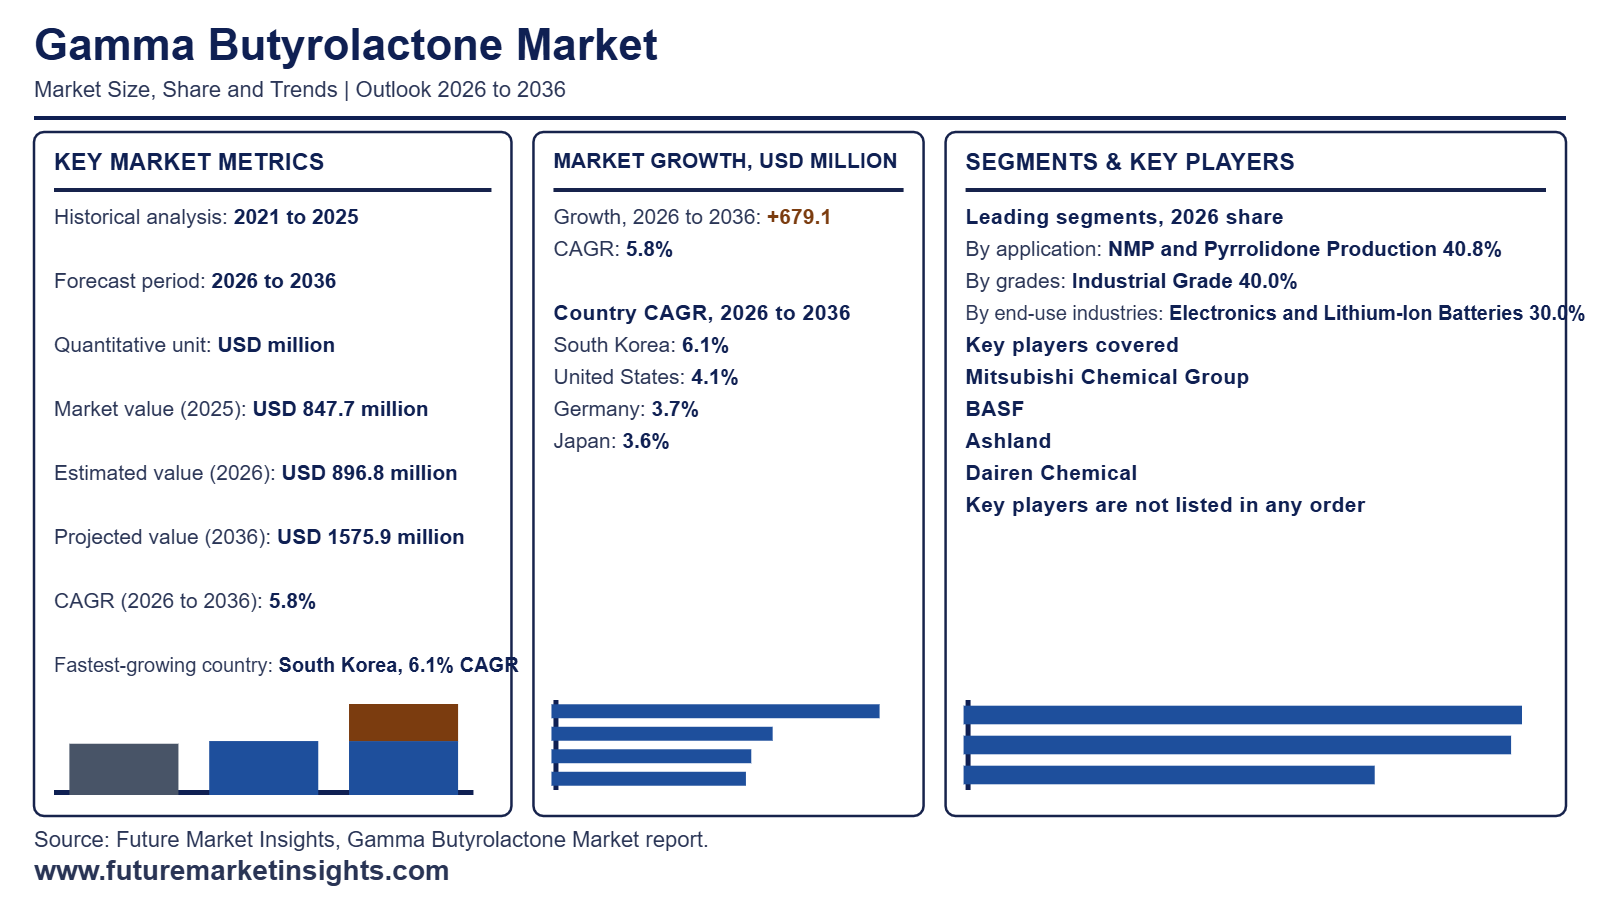
The global gamma butyrolactone market is valued at USD 896.8 million in 2026, up from USD 847.7 million in 2025, and is projected by Future Market Insights (FMI) to reach USD 1,575.9 million by 2036, expanding at a 5.8% CAGR to generate USD 679.1 million in incremental revenue over the forecast decade.
| Market Metric | Valuation / Share / Forecast Benchmark |
|---|---|
| 2025 Market Size (Historical) | USD 847.7 million |
| 2026 Market Size (Estimated) | USD 896.8 million |
| 2036 Market Size (Projected) | USD 1,575.9 million |
| Compound Annual Growth Rate (2026 to 2036) | 5.8% CAGR |
| Incremental Dollar Opportunity (2026 to 2036) | USD 679.1 million |
| Dominant Application (2026 to 2036 Share) | NMP and Pyrrolidone Production (40.8% in 2026, rising to 42.1% by 2036) |
| Leading & Fastest-Growing Grades | Industrial Grade (40.0% share in 2026; 4.9% CAGR) | Electronic Grade (7.6% CAGR) |
| Leading & Fastest-Growing End-Use Industries | Electronics and Lithium-Ion Batteries (30.0% share in 2026; 7.0% CAGR) |
| Largest Country Markets (2026 Global Share) | USA (14.0%), Japan (13.0%) |
| Fastest-Growing Country Market (2026 to 2036) | South Korea (6.1% CAGR) |
| Leading Tier-1 Companies | Mitsubishi Chemical Group, BASF, Ashland, Dairen Chemical |
Source: Future Market Insights analysis of the gamma butyrolactone market, 2026.
Executive Market Overview
Global demand for gamma butyrolactone rests on its role as the intermediate that converters turn into NMP and other pyrrolidones, so buyers qualify supply on synthesis yield, assay and multi-batch consistency rather than spot solvent quotes. East Asia leads because Japan and Taiwan run integrated C4 chains, from 1,4-butanediol to pyrrolidones, that consume GBL close to where it is made, while South Asia is emerging as agrochemical and pharmaceutical producers localize intermediates. The USA is the largest country market at a 14.0% share, driven by pharmaceutical and coatings converters, with Japan at 13.0% on Okayama output. South Korea is the fastest-growing country at a 6.1% CAGR, as cell makers expand lithium-ion battery electrolytes capacity.
Regulatory and substitution risk is the main brake on revenue. GBL is a List I chemical in the USA, so every shipment carries documentation and customer-screening cost, and battery electrode dry coating materials could replace NMP-based slurry routes, trimming pyrrolidone demand. Suppliers are shifting volume to qualified Electronic and Pharmaceutical Grade lots, adding ISO tank and intermediate bulk container supply, and locking in converters through multi-batch contracts and forward integration into N-methyl-2-pyrrolidone. FMI projects Electronic Grade at a 7.6% CAGR and Electronics and Lithium-Ion Batteries at a 7.0% CAGR, ahead of the 5.8% market rate. Market sizing covers GBL sold as industrial, technical solvent, electronic and pharmaceutical grades, while excluding finished NMP, 2-pyrrolidone, other downstream derivatives and 1,4-butanediol feedstock.
Analyst Perspective
“I expect value in gamma butyrolactone to build faster than tonnage, because buyers in electronics, agrochemicals and pyrrolidone derivatives pay for purity and secure supply, not just volume. The main risk is feedstock: GBL margins follow butanediol, and a swing in butanediol pricing or Asian supplier concentration can squeeze converters within one quarter. I have seen this category punish buyers who treated supply as a commodity.”
- Nikhil Kaitwade, Principal Consultant, Future Market Insights (FMI)
Major Market Trends and Insights
- Electronic Grade Purity Premiums Shift Revenue Away from Commodity Volumes: Battery and semiconductor buyers approve solvent lots against tight impurity limits, which locks in qualified suppliers and supports price premiums over bulk material. FMI projects electronic grade at a 7.6% CAGR against 4.9% for industrial grade, which still holds a 40.0% share in 2026. Peer-reviewed work in Battery Energy (March 2026) shows lactone electrolytes based on GBL and γ-valerolactone retaining over 80% capacity after 200 cycles in full cells, supporting further qualification trials.
- Energy Storage Build-Out in China Anchors Battery-Linked Solvent Demand: Each gigawatt-hour of storage output adds electrode and electrolyte solvent use, so cell growth passes straight into solvent offtake for suppliers near Chinese cell clusters. FMI projects electronics and lithium-ion batteries, at 30.0% of 2026 demand, to grow at 7.0% CAGR. CGTN (October 2026) reports that the Ministry of Industry and Information Technology put H1 2026 energy storage battery output above 420 GWh, up 110% year on year.
- Low-Carbon NMP Variants Turn Solvent Supply into a Footprint Contest: Buyers tracking supply chain emissions favour suppliers that cut carbon without forcing formulation requalification. FMI shows NMP and pyrrolidone production at 40.8% of 2026 demand, rising to 42.1% by 2036. BASF (March 2026) launched reduced product carbon footprint variants of BDO, THF, PolyTHF and NMP from Ludwigshafen, at least 10% below standard grades and usable without adapting formulations. TÜV Rheinland certification is pending, so rivals such as Mitsubishi Chemical Group, Ashland and Dairen Chemical can still respond.
What Are the Main Drivers, Restraints, and Opportunities?
Battery-linked demand for N-methyl-2-pyrrolidone pulls GBL into conversion chains, while List I diversion controls and NMP exposure rules raise the cost of every transaction, which leaves validated high-purity grades for electronics as the clearest route to higher revenue per tonne.
Driver: Battery Electrode NMP Demand Feeding GBL Conversion
Conventional wet cathode lines dissolve PVDF binder in NMP, so each new coating line creates make-up solvent demand for N-methyl-2-pyrrolidone producers and, where they take GBL as feedstock, for GBL converters. Argonne National Laboratory (February 2025) notes that wet processing relies on NMP and must recover it after coating, at added equipment and operating cost. Mitsubishi Chemical Group (August 2023) confirms GBL is a raw material for NMP used in lithium-ion batteries. The commercial gain goes to suppliers with conversion-grade product, dependable tank logistics and technical coordination with pyrrolidone producers, not to those inferring volume from announced cell capacity.
Restraint: GBL Diversion Controls, NMP Exposure Rules and Dry-Electrode Substitution
Dry-electrode lines need no NMP handling or solvent recovery, which erodes the pull-through that GBL conversion depends on, as tracked in battery electrode dry coating materials. Argonne National Laboratory (February 2025) puts dry processing at 11% lower manufacturing cost and 46% lower energy use than wet coating. Compliance adds friction: GBL is a List I chemical (Drug Enforcement Administration, November 2026), REACH Entry 71 caps NMP worker exposure at 14.4 mg/m³ by inhalation (European Chemicals Agency, July 2019), and the US EPA found unreasonable risk under 29 of 37 NMP conditions of use (US Environmental Protection Agency, May 2026). Distributors and small converters absorb the onboarding delay, while integrated producers carry it more easily.
Opportunity: Validated High-Purity GBL for Electronics Qualification
Capacitor-electrolyte and semiconductor-cleaning buyers pay for impurity control, which lifts realized price per tonne above industrial GBL and ties suppliers into qualified electronic materials and chemicals chains. Mitsubishi Chemical Group (August 2023) is raising Okayama GBL capacity by 2,000 tonnes a year from July 2024, citing capacitor electrolytes and semiconductor parts cleaning. Dairen Chemical Corporation (November 2026) lists minimum 99.7% and 99.9% grades. FMI projects the minimum 99.9% purity grade at a 6.4% CAGR and electronics applications at 6.9% through 2036. Suppliers that can evidence impurities, batch traceability and packaging compatibility can turn pilot orders into recurring sales, though each qualification stays customer-specific.
How Is the Gamma Butyrolactone Market Segmented?
The global gamma butyrolactone market is segmented by application, grade, end-use industry, supply form, and region, with all volumes standardized to metric tonnes of GBL.
| Segmentation Axis | Sub-Segments Covered | 2026 Leading Segment & Share | Main Growth Benchmark (2026 to 2036) |
|---|---|---|---|
| Application | NMP and Pyrrolidone Production, Solvent for Coatings and Paint Removers, Pharmaceutical Intermediates, Electronics and Battery Materials, Agrochemical Intermediates | NMP and Pyrrolidone Production (40.8% revenue share) | NMP and Pyrrolidone Production share rises to 42.1% by 2036; Electronics and Battery Materials leads growth at 7.5% CAGR |
| Grade | Industrial Grade, Technical Solvent Grade, Electronic Grade, Pharmaceutical Grade | Industrial Grade (40.0% revenue share) | Electronic Grade (7.6% CAGR) vs. Industrial Grade (4.9% CAGR) |
| End-Use Industry | Electronics and Lithium-Ion Batteries, Pharmaceuticals, Agrochemicals, Paints and Coatings, Polymers and Plastics | Electronics and Lithium-Ion Batteries (30.0% revenue share) | Electronics and Lithium-Ion Batteries lead growth at 7.0% CAGR |
| Supply Form | Bulk Tanker, ISO Tank and Intermediate Bulk Container, Drums, Small Packs | Bulk Tanker (52.0% revenue share) | ISO Tank and Intermediate Bulk Container leads growth at 6.5% CAGR |
| Region | East Asia, South Asia & Pacific, North America, Europe, Latin America, Middle East & Africa | China (28.0% global share), followed by USA (14.0%) and Japan (13.0%) | South Korea leads national growth at 6.1% CAGR. |
Source: Future Market Insights analysis of the gamma butyrolactone market, 2026.
Why Does the NMP and Pyrrolidone Production Segment Lead by Application?
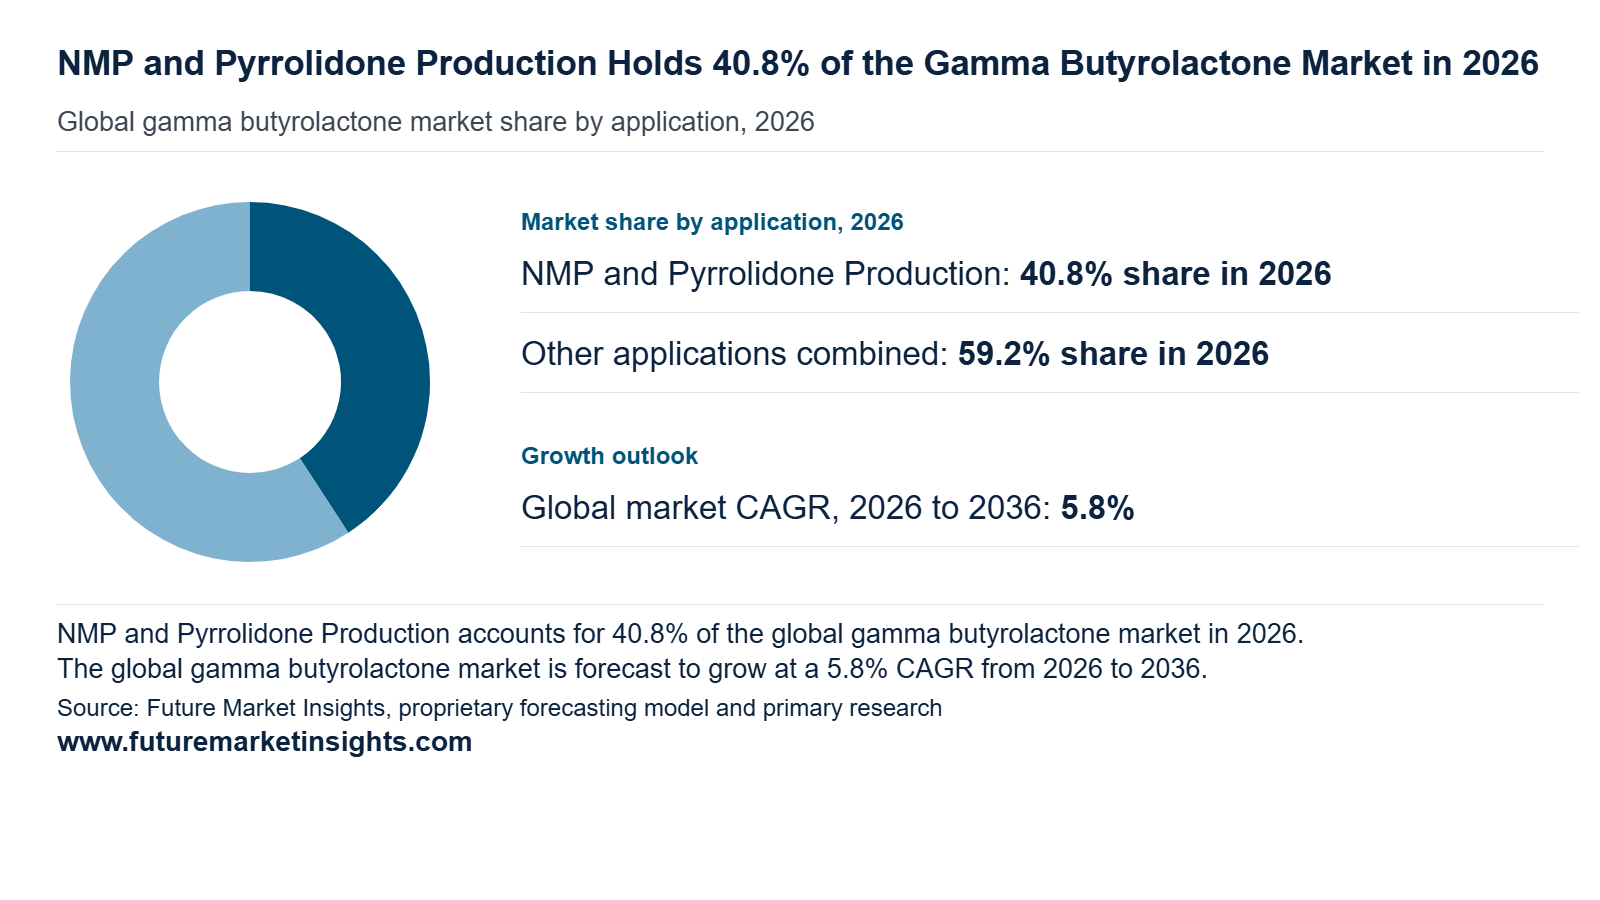
Converters buy GBL against synthesis yield, feedstock assay and multi-batch reliability, so contracts run on recurring volumes rather than spot solvent price. That pull is strongest where n-methyl pyrrolidone feeds battery and semiconductor customers. NMP and Pyrrolidone Production holds 40.8% of application revenue in 2026 and rises to 42.1% by 2036, a 6.1% CAGR against the market’s 5.8%. Mitsubishi Chemical Group (August 2023) decided to increase GBL capacity at its Okayama Plant by 2,000 tons/year against current capacity of 18,000 tons/year, citing lithium-ion battery and semiconductor demand. Electronics and Battery Materials is the fastest-growing application at 7.5% CAGR.
Why Does the Industrial Grade Segment Lead by Grade?
Producers selling into high purity solvents channels must prove metals control. Hefei TNJ Chemical Industry (December 2016) specifies electronic grade at a minimum 99.9% assay against 99.5% for technical grade, and limits each listed metal to 50 ppb or less. Industrial Grade represents 40.0% of grade revenue in 2026 and eases to 36.7% by 2036 at a 4.9% CAGR, while Electronic Grade grows fastest at 7.6% CAGR. Industrial buyers run their own conversion or purification, so they pay for acceptable composition and delivery reliability, not for ultra-low impurities. Higher specifications add testing and documentation cost without lifting tonnage, which keeps volume with the lower grade even as value shifts.
Why Does the Electronics and Lithium-Ion Batteries Segment Lead by End-Use Industry?
Electronics and Lithium-Ion Batteries accounts for 30.0% of end-use revenue in 2026 and reaches 33.6% by 2036 at a 7.0% CAGR, the fastest of any end use. Battery makers consume GBL directly and through NMP, and semiconductor and capacitor buyers add contamination limits that support premium pricing. The IEA (May 2026) reported that nameplate lithium-ion cell manufacturing capacity reached more than 4 TWh by the end of 2025, up roughly 30% from 2024, widening the lithium-ion battery solvent base. The risk is dry electrode coating: Argonne National Laboratory (February 2025) reported dry processing cuts energy use by 46% against conventional wet processing.
Why Does the Bulk Tanker Segment Lead by Supply Form?
Buyers carry the burden of tank preparation, transfer procedures and records, because the US Drug Enforcement Administration (October 2026) states that GBL is a list I chemical under the Controlled Substances Act. ISO tank and IBC loads serve export and uneven site demand, and ISO tank container availability sets their freight cost. ISO Tank and Intermediate. Bulk Tanker accounts for 52.0% of supply form revenue in 2026 and slips to 50.1% by 2036 at a 5.4% CAGR. Integrated converters and battery-solvent plants take repeated large lots into dedicated tanks, which cuts packaging cost per tonne and handling events.
Gamma Butyrolactone Market by Region and Country (2026 to 2036)
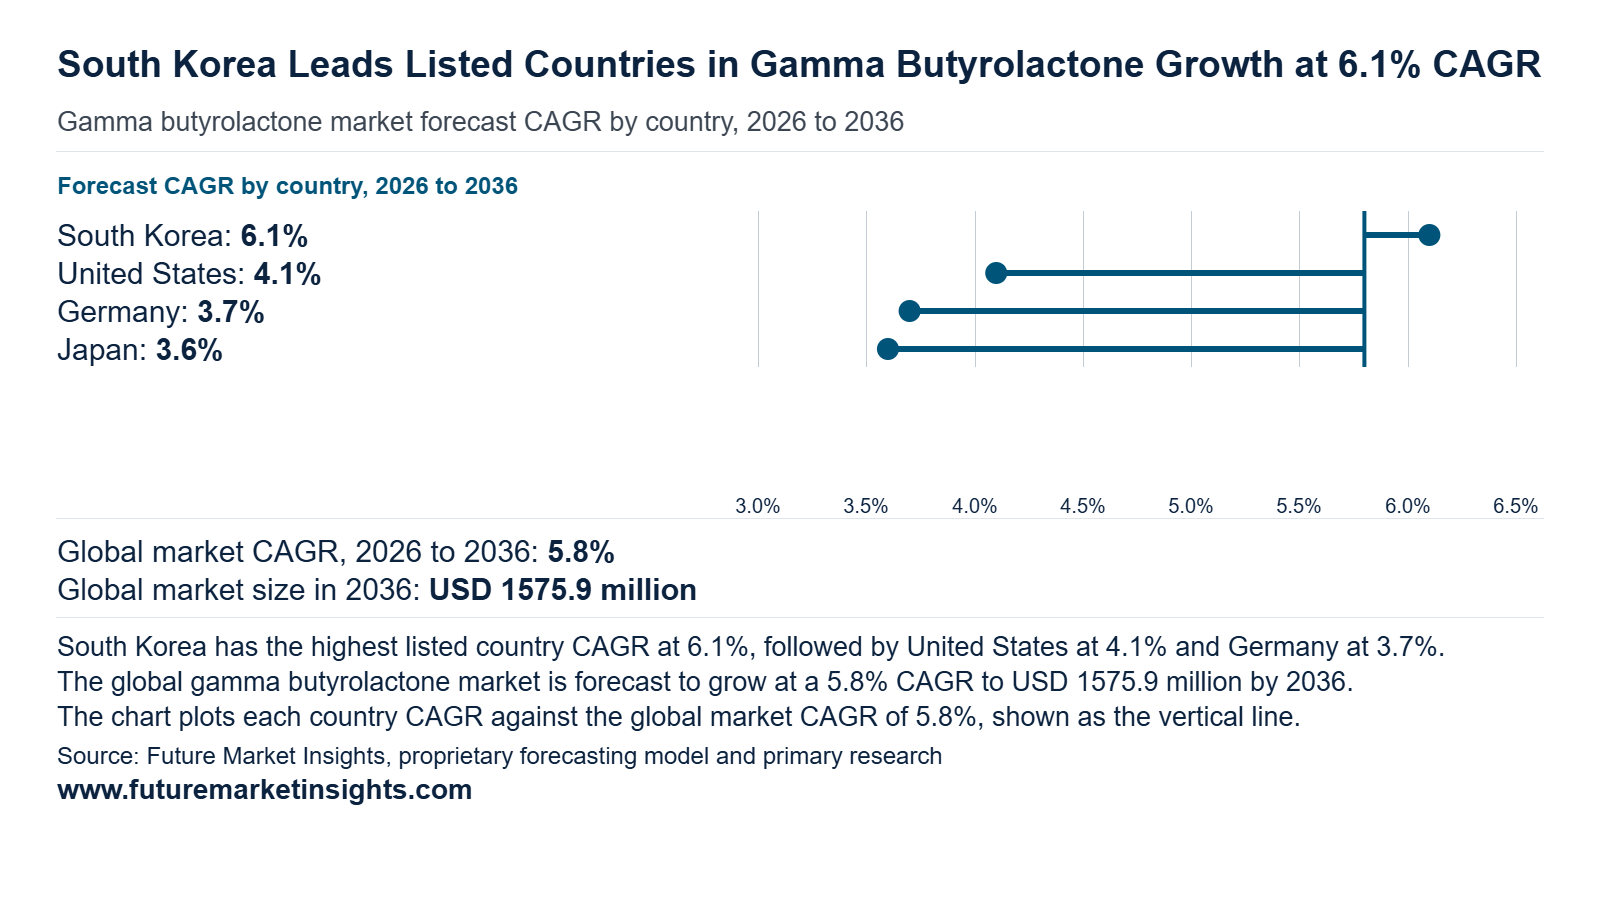
The five tracked countries hold 45.0% of global gamma butyrolactone revenue in 2026 and 44.4% in 2036, so concentration narrows as untracked markets take more of the gain. The three tracked Asian economies (Japan, South Korea, Taiwan) edge up from 23.0% to 23.4%. The United States, the largest country market, slips from 14.0% to 13.6% yet adds USD 138 million, the biggest dollar gain of the five. South Korea and Taiwan form the emerging cluster, rising from USD 200 million to USD 349 million (+USD 149 million) on battery and semiconductor solvent demand.
| Country | 2026 Revenue | 2036 Revenue | 10-Year Addition | 2026 to 2036 CAGR | Global Share (2026 → 2036) |
|---|---|---|---|---|---|
| South Korea | USD 120 million | USD 217 million | +USD 97 million | 6.1% | 6.0% → 7.1% |
| Taiwan | USD 80 million | USD 132 million | +USD 52 million | 5.1% | 4.0% → 4.3% |
| United States | USD 280 million | USD 418 million | +USD 138 million | 4.1% | 14.0% → 13.6% |
| Germany | USD 160 million | USD 230 million | +USD 70 million | 3.7% | 8.0% → 7.5% |
| Japan | USD 260 million | USD 370 million | +USD 110 million | 3.6% | 13.0% → 12.0% |
Source: Future Market Insights analysis of the gamma butyrolactone market, 2026.
United States
Demand rests on pharmaceutical intermediates, electronics cleaning and battery-solvent chains, but the product is tightly controlled. GBL is a List I chemical under 21 CFR 1310.02, with DEA chemical code 2011 (US Drug Enforcement Administration, April 2026). The United States is the largest gamma butyrolactone market, rising 1.49-fold from USD 280 million in 2026 to USD 418 million by 2036 (4.1% CAGR). It adds USD 138 million, the largest dollar gain among tracked countries, while its share eases from 14.0% to 13.6%. Compliance duties usually push merchant buyers toward licensed, documented suppliers, which favours established distributors over spot traders.
Japan
Japan grows at a 3.6% CAGR from USD 260 million to USD 370 million, adding USD 110 million. Its share falls from 13.0% to 12.0%, the largest share loss among tracked countries. Demand is anchored in capacitor electrolytes, semiconductor cleaning and NMP, so growth follows purity-grade mix more than volume. Mitsubishi Chemical Group (August 2023) states it is the only GBL and NMP manufacturer in Japan and added 2,000 tonnes a year of GBL capacity at Okayama from July 2024. A single domestic producer gives it pricing leverage with capacitor and chip-cleaning buyers, while small capacity steps cap volume upside.
Germany
Germany expands at a 3.7% CAGR from USD 160 million to USD 230 million, adding USD 70 million while its share slips from 8.0% to 7.5%. Demand centres on pharmaceutical-grade GBL made from integrated butanediol chains, with battery solvent demand a smaller pull than in Asia. BASF (March 2026) states BDO is used to manufacture THF and GBL for pharmaceutical applications, and it reports BDO capacity of 350,000 tonnes a year across two production plants. Integration lets BASF control feedstock cost, which protects margin against imported GBL when Asian prices fall.
South Korea
LG Energy Solution’s ESG Report 2025 (Digital Today, June 2026) shows NMP recycling rising from about 80% to 97%, with rollout to its Ochang plant in South Korea. Higher recycling cuts virgin solvent bought per cell, so suppliers must win on purity grade and take-back services. South Korea is the fastest-growing market, rising 1.81-fold at a 6.1% CAGR from USD 120 million to USD 217 million. It adds USD 97 million and gains the most share, from 6.0% to 7.1%. Cathode slurry solvent demand from LG Energy Solution, SK On and Samsung SDI drives consumption, and cell output decides volume.
Taiwan
ITRI (October 2025) forecasts Taiwan semiconductor output of NT$7.13 trillion in 2026, up 10%, with IC manufacturing growing 12%. Fab qualification cycles are long, so incumbent suppliers holding approved purity grades keep share and new entrants face a multi-year wait. Taiwan grows at a 5.1% CAGR, rising 1.65-fold from USD 80 million to USD 132 million. It adds USD 52 million and lifts its share from 4.0% to 4.3%. Fab expansion for AI chips lifts demand for high-purity cleaning solvents, while a small domestic base keeps volumes modest.
Competitive Environment and Notable Companies
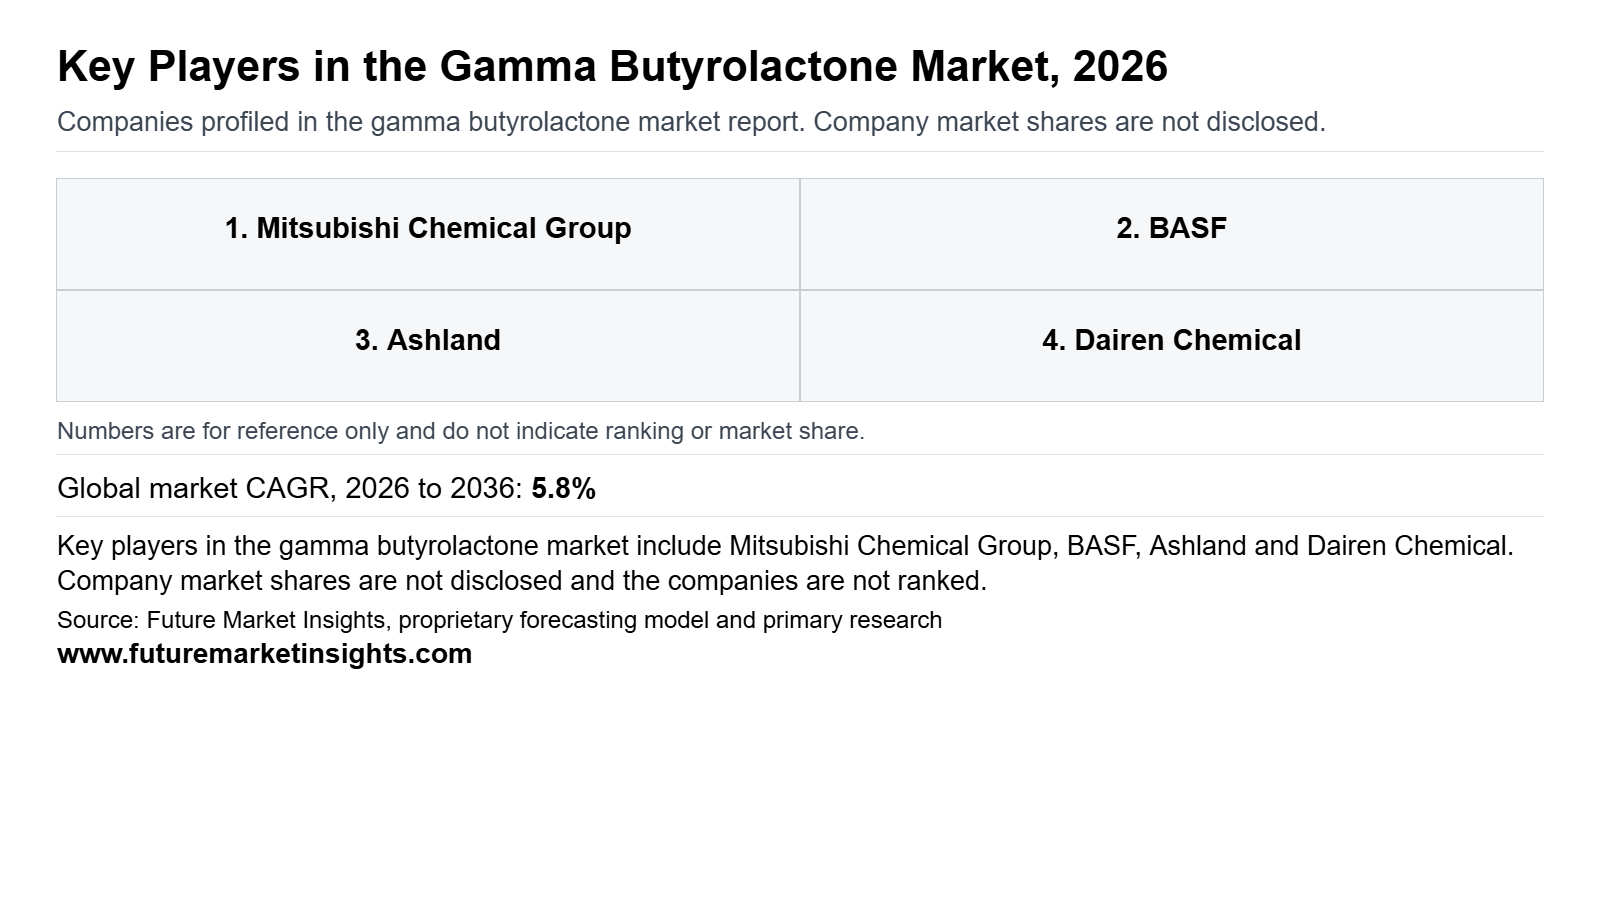
Notable companies operating in the global gamma butyrolactone market include BASF, Mitsubishi Chemical Group, Ashland, Dairen Chemical, Chang Chun Group, and BASF PETRONAS Chemicals. Competition runs across three positions. Integrated C4 and pyrrolidone manufacturers (BASF, Ashland) compete on butanediol access and NMP conversion. High-purity GBL specialists (Mitsubishi Chemical Group, Dairen Chemical) compete on purity documentation and electronics-grade qualification. Affiliated and legacy footprints (Chang Chun Group, BASF PETRONAS Chemicals) carry little proven current output. Because European anti-dumping duties are reshaping BDO imports, supply partnerships and toll conversion offer the clearest route into markets beyond the core producing countries.
How Are Companies Positioned in the Gamma Butyrolactone Market?
Ashland’s Intermediates unit grew merchant sales 4% to USD 24 million in the fourth quarter of fiscal 2026, as higher NMP sales offset lower merchant BDO volumes (Ashland, November 2026). Mitsubishi Chemical Group is described as Japan’s only GBL and NMP maker, with a plan to reach 20,000 tonnes a year at Okayama (Nikkan Kogyo Shimbun, August 2023); Positioning follows butanediol access. BASF runs BDO plants at Ludwigshafen and Geismar with 350,000 tonnes of combined capacity (BASF, March 2026) and has lifted Ludwigshafen output (BASF, February 2026).
What Matters When a Buyer Selects a Gamma Butyrolactone Supplier?
Buyers weigh purity documentation and licence readiness alongside price. The UK Home Office consultation, open from 19 August 2026 to 11 November 2026, proposes Schedule 1 control of GBL and 1,4-BD, with a Home Office license needed to import, produce, supply or possess grades of 70% purity or more (Home Office, August 2026). Suppliers able to evidence grade, end use and traceability per shipment hold an advantage over distributors without that paper trail, and a response is due by 8 February 2027.
Which Capabilities Distinguish Product Offers?
Offers differ on NMP integration, purity and carbon documentation. Mitsubishi Chemical Group links GBL to capacitor electrolytes, semiconductor cleaning agents and NMP raw material (Nikkan Kogyo Shimbun, August 2023). BASF launched BDO, THF, PolyTHF and NMP variants with a product carbon footprint at least 10% lower, calculated to ISO 14067:2018, but names no GBL grade (BASF, March 2026). Ashland expects new energy storage customer volumes in fiscal 2027 (Ashland, November 2026). Buyers qualifying GBL for electronics should therefore request grade-level data, not portfolio-level claims.
How Does Geographic Reach Affect Competition?
Regional policy decides who ships where. BASF raised Ludwigshafen BDO output after the European Commission’s 8 January 2026 pre-disclosure of provisional anti-dumping duties on BDO from China, Saudi Arabia and the United States (BASF, February 2026). Dairen Chemical, part of Chang Chun Group, reported first-four-month revenue above NT$13.5 billion, up nearly 10%, while its chairman warned that China’s integrated refining and chemicals model will make Taiwanese producers harder to sustain (Business Today, June 2026). BASF PETRONAS Chemicals closed its Kuantan BDO and derivatives plant in March 2021 (BASF, November 2020).
| Verified Company Evidence (2026) | Commercial Effect | Buyer Action |
|---|---|---|
| 16 February 2026: BASF began gradually raising BDO output at Ludwigshafen after the European Commission’s pre-disclosure of provisional anti-dumping duties on BDO from China, Saudi Arabia and the United States (BASF, February 2026). | Secures a regional BDO base for THF, PolyTHF and NMP buyers, but the release does not name GBL. | Confirm GBL grade availability and BDO origin before moving European contracts. |
| 9 March 2026: BASF introduced reduced product carbon footprint variants of BDO, THF, PolyTHF and NMP, each at least 10% below the standard product (BASF, March 2026). | Makes footprint a contract attribute on neighboring derivatives; no certified low-carbon GBL grade is claimed. | Ask whether a footprint-documented GBL grade exists and request the ISO 14067 calculation. |
| 3 November 2026: Ashland reported Intermediates sales flat at USD 33 million, merchant sales up 4%, higher NMP sales offsetting lower merchant BDO volumes, and adjusted EBITDA up 20% to USD 6 million, and expects new energy storage volumes in fiscal 2027 (Ashland, November 2026). | Flat sales with a 20% EBITDA gain show mix and pricing, not volume, driving margin, while NMP-led energy storage demand pulls on the BDO chain. | Test NMP and BDO contract pricing against Ashland’s merchant mix shift; no GBL tonnage is disclosed. |
Source: Verified corporate disclosures and Future Market Insights analysis, 2026.
| Company | Core Positioning | Verified Activity & Source Attribution |
|---|---|---|
| BASF | Integrated BDO and NMP chain at Ludwigshafen and Geismar | Raised Ludwigshafen BDO output in February 2026 and launched lower-footprint BDO, THF, PolyTHF and NMP variants in March 2026 (BASF, February and March 2026); its release states BDO is used to make THF and GBL. |
| Mitsubishi Chemical Group | High-purity GBL and NMP at Okayama | Planned a 2,000-tonne increase to 20,000 tonnes a year with a July 2024 start (Nikkan Kogyo Shimbun, August 2023) |
| Ashland | Intermediates unit supplying BDO and NMP | Fourth-quarter fiscal 2026 Intermediates adjusted EBITDA of USD 6 million, up 20% (Ashland, November 2026). |
| Dairen Chemical | Taiwan-based chemical producer within Chang Chun Group, GBL positioning | First-four-month revenue above NT$13.5 billion, up nearly 10%, with profit more than doubling (Business Today, June 2026) |
| Chang Chun Group | Parent of Dairen Chemical | Positioning only: Dairen Chemical is its subsidiary |
| BASF PETRONAS Chemicals | Historic BDO and derivatives operation at Kuantan | Plant closure announced for March 2021 (BASF, November 2020) |
Source: Verified corporate disclosures and Future Market Insights analysis, 2026.
Gamma Butyrolactone Market Report Scope and Research Methodology
FMI sizes the global gamma butyrolactone (GBL) market from the revenue earned on GBL sold as an intermediate or solvent, cross-checked against wider national C4 chemical and specialty solvent industry totals. Sales into NMP and pyrrolidone production, coatings and paint removers, pharmaceutical and agrochemical intermediates, and electronics and battery materials anchor the model because they account for the majority of global revenue. Revenue is counted at the point of sale of GBL itself, with downstream NMP and other pyrrolidones, finished batteries, pharmaceuticals and coatings excluded so that conversion value is not double counted. Primary interviews with manufacturers, distributors, end users and procurement teams are combined with desk research on trade data, regulatory publications, standards and company filings. Segment and national figures are reconciled to sum to the global market total in every year. Company disclosures are used strictly to verify product positioning, grades and production footprints rather than to estimate proprietary company revenues.
| Coverage Field | Report Scope |
|---|---|
| Market definition | Revenue from gamma butyrolactone sold as an intermediate or solvent in the stated segments. |
| Applications | NMP and pyrrolidone production, solvent for coatings and paint removers, pharmaceutical intermediates, electronics and battery materials, and agrochemical intermediates. |
| Grades | Industrial grade, technical solvent grade, electronic grade, and pharmaceutical grade. |
| End-use industries | Electronics and lithium-ion batteries, pharmaceuticals, agrochemicals, paints and coatings, and polymers and plastics. |
| Supply forms | Bulk tanker, ISO tank and intermediate bulk container, drums, and small packs. |
| Exclusions | Downstream NMP and other pyrrolidones after conversion, finished batteries, pharmaceuticals, coatings and other finished products, substitute solvents, and separately billed services. |
| Quantitative units | USD million for value. |
| Value basis | Revenue from GBL sales to buyers in each country, counted where the product is sold. |
| Regions covered | North America, Latin America, Western Europe, Eastern Europe, East Asia, South Asia and Pacific, and Middle East and Africa. |
| National coverage | USA, China, Japan, Germany, India, South Korea, and Taiwan. |
| Companies covered | BASF, Mitsubishi Chemical Group, Ashland, Dairen Chemical, Chang Chun Group, and BASF PETRONAS Chemicals. |
| Forecast period | 2026 to 2036. |
| Approach | Primary and secondary research with market triangulation, followed by data validation against independent indicators to avoid double counting. |
Source: Future Market Insights analysis of the gamma butyrolactone market, 2026.
Research Sources and Bibliography
- Ashland (November 2026). Ashland reports fourth quarter and full-year fiscal 2026 results and issues outlook for fiscal 2027. https://investor.ashland.com/news-releases/news-release-details/ashland-reports-fourth-quarter-and-full-year-fiscal-2026-results
- Ashland (July 2026). Ashland reports third quarter 2026 results and reaffirms full-year sales & Adjusted EBITDA outlook. https://investor.ashland.com/news-releases/news-release-details/ashland-reports-third-quarter-2026-results-and-reaffirms-full
- Ashland (n.d.). Intermediates: GBL and pyrrolidone product portfolio. https://origin-www.ashland.com/industries/performance-specialties/intermediates
- BASF (March 2026). BASF introduces BDO, THF, PolyTHF® and NMP product variants with reduced product carbon footprint (rPCF) [company trade news, 9 March 2026]. https://www.basf.com/global/en/media/news-releases/2026/03/p-26-035
- BASF (November 2020). BASF PETRONAS Chemicals realigns its portfolio for growth. https://www.basf.com/se/en/media/news-releases/2020/11/p-20-368
- BASF (February 2026). BASF supports European BDO supply security through increased production in Ludwigshafen [company news release, 16 February 2026]. https://www.basf.com/global/en/media/news-releases/2026/02/p-26-023
- BASF (December 2017). BASF to increase price for diols and derivatives in North America. https://www.basf.com/us/en/media/news-releases/2017/12/P-US-17-134
- BASF (May 2026). Factbook: Intermediates. https://www.basf.com/global/en/investors/calendar-and-publications/factbook/segments/chemicals/intermediates
- BASF PETRONAS Chemicals (July 2015). Technical Information: gamma-Butyrolactone. https://www.basf-petronas.com.my/sites/default/files/Gamma-Butyrolactone.pdf
- Chang Chun Group (n.d.). Affiliates: Dairen Chemical (Jiangsu) Co., Ltd. https://www.ccpgp.com/en/CP/2431/1308/
- Chang Chun Group (April 2025). CCPG Recognized with EcoVadis Platinum and Gold Medals in 2025. https://www.ccpgp.com/en/News_Content/2427/100698/
- Chang Chun Group (November 2025). CCPG’s Products Achieve Annual ISCC PLUS Certification. https://www.ccpgp.com/en/News_Content/2427/100776/
- Dairen Chemical (June 2026). gamma-BUTYROLACTONE: Product applications and specifications. https://www.dcc.com.tw/en/News_Prt_Content/2599/81195
- Dairen Chemical and DNV (February 2024). ISO 50001:2018 management system certificate and site scope. https://www.dcc.com.tw/ccpweb.nsf/0/99B6F5F2D9273B824825878E001D2D43/%24FILE/%E6%AF%8D%E8%AD%89-50001%28%E8%8B%B1%29.002.pdf
- Drug Enforcement Administration, Diversion Control Division (October 2026). Gamma-Butyrolactone: Drug and Chemical Evaluation. https://www.deadiversion.usdoj.gov/drug_chem_info/gbl.pdf
- Drug Enforcement Administration, Diversion Control Division (November 2026). List I and II Regulated Chemicals, Alphabetical Order [regulatory list, footer dated 12 November 2026]. https://www.deadiversion.usdoj.gov/schedules/orangebook/f_chemlist_alpha.pdf
- European Chemicals Agency (July 2026). How to comply with REACH Restriction 71, 76, 80 and 81; guideline for users of the aprotic solvents NMP, DMF, DMAC, and NEP (March 2026 edition). https://op.europa.eu/en/publication-detail/-/publication/4ad84faf-7b56-11f1-bf5e-01aa75ed71a1/language-en
- European Commission (June 2026). Commission Implementing Regulation (EU) 2026/1373 imposing a definitive anti-dumping duty on imports of 1,4-Butanediol originating in China, Saudi Arabia and the United States [Official Journal regulation, adopted 22 June 2026, published 24 June 2026]. https://eur-lex.europa.eu/eli/reg_impl/2026/1373/oj/eng
- European Commission (April 2018). Commission Regulation (EU) 2018/588 on NMP under REACH. https://eur-lex.europa.eu/legal-content/EN/TXT/?uri=CELEX:32018R0588
- European Commission, Directorate-General for Climate Action (June 2026). New Battery Booster set to inject €1.5 billion into the European battery industry. https://climate.ec.europa.eu/news-other-reads/news/new-battery-booster-set-inject-eu15-billion-european-battery-industry-2026-06-09_en
- Government of India, Ministry of Heavy Industries (March 2026). ACC Battery Production-Linked Incentive (PLI) Scheme. https://www.pib.gov.in/PressReleasePage.aspx?PRID=2246037&lang=2®=48
- Home Office (August 2026). Control of Gamma-Butyrolactone and 1,4-Butanediol [government consultation, 19 August 2026]. https://www.gov.uk/government/consultations/control-of-gamma-butyrolactone-and-14-butanediol
- International Energy Agency (May 2026). Global EV Outlook 2026: Electric vehicle batteries. https://www.iea.org/reports/global-ev-outlook-2026/electric-vehicle-batteries
- International Energy Agency (May 2026). Global EV Outlook 2026: Manufacturing and trade. https://www.iea.org/reports/global-ev-outlook-2026/manufacturing-and-trade
- Invest Taiwan (September 2026). Taiwan commits major funding to semiconductor facilities and chip design software. https://investtaiwan.nat.gov.tw/newsPage62741eng?lang=eng&search=62741
- Ministry of Trade, Industry and Resources, Korea (December 2025). K-Battery to Power Korea’s Future Industries. https://english.motir.go.kr/eng/article/EATCLdfa319ada/2432/view
- Mitsubishi Chemical Corporation (n.d.). Gamma-Butyrolactone: GBL/Gamma-Butyrolactone. https://www.m-chemical.co.jp/en/products/departments/mcc/c4/product/1201004_7922.html
- Mitsubishi Chemical Group (August 2023). Expansion of Gamma-Butyrolactone (GBL) Production Capacity [company news release, 3 August 2023]. https://www.mcgc.com/english/news_release/01684.html
- U.S. Department of Energy (August 2022). Environmental Assessment: Construction and Tooling of Battery Cell Manufacturing Plants. https://www.energy.gov/sites/default/files/2022-08/LPO_Ultium_Lordstown-SpringHill_EA_FONSI_August2022.pdf
- U.S. Environmental Protection Agency (July 2026). Final Risk Evaluation for n-Methylpyrrolidone (NMP). https://www.epa.gov/assessing-and-managing-chemicals-under-tsca/final-risk-evaluation-n-methylpyrrolidone-nmp
Table of Content
- Key Takeaways
- Market Size and CAGR
- Top Growth Driver
- Fastest Growing Segment
- Leading Region
- Key Companies
- Emerging Opportunities
- Executive Summary
- Global Market Outlook
- Demand-side Trends
- Supply-side Trends
- Technology Roadmap Analysis
- Analysis and Recommendations
- Analyst Perspective (What is happening? Why now? What should investors know?)
- Key Questions Answered
- How large is the market?
- What is the CAGR?
- What are key trends?
- Which region dominates?
- Who are the leaders?
Read More...
- Market Overview
- Market Coverage / Taxonomy
- Market Definition / Scope / Limitations
- Research Methodology
- Chapter Orientation
- Analytical Lens and Working Hypotheses
- Market Structure, Signals, and Trend Drivers
- Benchmarking and Cross-market Comparability
- Market Sizing, Forecasting, and Opportunity Mapping
- Research Design and Evidence Framework
- Desk Research Programme (Secondary Evidence)
- Expert Input and Fieldwork (Primary Evidence)
- Tooling, Models, and Reference Databases
- Data Engineering and Model Build
- Quality Assurance and Audit Trail
- Market Background
- Market Dynamics (Drivers, Restraints, Opportunity, Trends)
- Scenario Forecast (Optimistic, Likely, Conservative)
- Impact Analysis
- AI Impact
- Sustainability Impact
- Regulatory Impact
- Technology Impact
- Consumer / Buyer Analysis
- Purchase Drivers
- Adoption Barriers
- Buyer Journey
- Opportunity Map Analysis
- Product Life Cycle Analysis
- Supply Chain Analysis
- Investment Feasibility Matrix
- Value Chain Analysis
- PESTLE and Porter's Analysis
- Regulatory Landscape
- Regional Parent Market Outlook
- Production and Consumption Statistics
- Import and Export Statistics
- Global Market Analysis and Forecast, 2021 to 2036
- Historical Market Size Value (USD Million) Analysis, 2021 to 2025
- Current and Future Market Size Value (USD Million) Projections, 2026 to 2036
- Y-o-Y Growth Trend Analysis
- Absolute $ Opportunity Analysis
- Global Market Pricing Analysis, 2021 to 2036
- Global Market Analysis and Forecast, By Application, 2021 to 2036
- Introduction / Key Findings
- Historical Market Size Value (USD Million) Analysis By Application, 2021 to 2025
- Current and Future Market Size Value (USD Million) Analysis and Forecast By Application, 2026 to 2036
- NMP and Pyrrolidone Production
- Solvent for Coatings and Paint Removers
- Pharmaceutical Intermediates
- Electronics and Battery Materials
- Agrochemical Intermediates
- Y-o-Y Growth Trend Analysis By Application, 2021 to 2025
- Absolute $ Opportunity Analysis By Application, 2026 to 2036
- Global Market Analysis and Forecast, By Grade, 2021 to 2036
- Introduction / Key Findings
- Historical Market Size Value (USD Million) Analysis By Grade, 2021 to 2025
- Current and Future Market Size Value (USD Million) Analysis and Forecast By Grade, 2026 to 2036
- Industrial Grade
- Technical Solvent Grade
- Electronic Grade
- Pharmaceutical Grade
- Y-o-Y Growth Trend Analysis By Grade, 2021 to 2025
- Absolute $ Opportunity Analysis By Grade, 2026 to 2036
- Global Market Analysis and Forecast, By End-Use Industry, 2021 to 2036
- Introduction / Key Findings
- Historical Market Size Value (USD Million) Analysis By End-Use Industry, 2021 to 2025
- Current and Future Market Size Value (USD Million) Analysis and Forecast By End-Use Industry, 2026 to 2036
- Electronics and Lithium-Ion Batteries
- Pharmaceuticals
- Agrochemicals
- Paints and Coatings
- Polymers and Plastics
- Y-o-Y Growth Trend Analysis By End-Use Industry, 2021 to 2025
- Absolute $ Opportunity Analysis By End-Use Industry, 2026 to 2036
- Global Market Analysis and Forecast, By Supply Form, 2021 to 2036
- Introduction / Key Findings
- Historical Market Size Value (USD Million) Analysis By Supply Form, 2021 to 2025
- Current and Future Market Size Value (USD Million) Analysis and Forecast By Supply Form, 2026 to 2036
- Bulk Tanker
- ISO Tank and Intermediate Bulk Container
- Drums
- Small Packs
- Y-o-Y Growth Trend Analysis By Supply Form, 2021 to 2025
- Absolute $ Opportunity Analysis By Supply Form, 2026 to 2036
- Global Market Analysis and Forecast, By Region, 2021 to 2036
- Introduction
- Historical Market Size Value (USD Million) Analysis By Region, 2021 to 2025
- Current Market Size Value (USD Million) Analysis and Forecast By Region, 2026 to 2036
- North America
- Latin America
- Western Europe
- Eastern Europe
- East Asia
- South Asia and Pacific
- Middle East and Africa
- Market Attractiveness Analysis By Region
- North America Market Analysis and Forecast, By Country, 2021 to 2036
- Historical Market Size Value (USD Million) Trend Analysis By Market Taxonomy, 2021 to 2025
- Market Size Value (USD Million) Forecast By Market Taxonomy, 2026 to 2036
- By Country
- United States
- Canada
- By Application
- By Grade
- By End-Use Industry
- By Supply Form
- By Country
- Market Attractiveness Analysis
- By Country
- By Application
- By Grade
- By End-Use Industry
- By Supply Form
- Key Takeaways
- Latin America Market Analysis and Forecast, By Country, 2021 to 2036
- Historical Market Size Value (USD Million) Trend Analysis By Market Taxonomy, 2021 to 2025
- Market Size Value (USD Million) Forecast By Market Taxonomy, 2026 to 2036
- By Country
- Brazil
- Mexico
- Argentina
- Chile
- By Application
- By Grade
- By End-Use Industry
- By Supply Form
- By Country
- Market Attractiveness Analysis
- By Country
- By Application
- By Grade
- By End-Use Industry
- By Supply Form
- Key Takeaways
- Western Europe Market Analysis and Forecast, By Country, 2021 to 2036
- Historical Market Size Value (USD Million) Trend Analysis By Market Taxonomy, 2021 to 2025
- Market Size Value (USD Million) Forecast By Market Taxonomy, 2026 to 2036
- By Country
- Germany
- France
- United Kingdom
- Italy
- Spain
- Benelux
- Nordics
- By Application
- By Grade
- By End-Use Industry
- By Supply Form
- By Country
- Market Attractiveness Analysis
- By Country
- By Application
- By Grade
- By End-Use Industry
- By Supply Form
- Key Takeaways
- Eastern Europe Market Analysis and Forecast, By Country, 2021 to 2036
- Historical Market Size Value (USD Million) Trend Analysis By Market Taxonomy, 2021 to 2025
- Market Size Value (USD Million) Forecast By Market Taxonomy, 2026 to 2036
- By Country
- Poland
- Czech Republic
- Romania
- Hungary
- By Application
- By Grade
- By End-Use Industry
- By Supply Form
- By Country
- Market Attractiveness Analysis
- By Country
- By Application
- By Grade
- By End-Use Industry
- By Supply Form
- Key Takeaways
- East Asia Market Analysis and Forecast, By Country, 2021 to 2036
- Historical Market Size Value (USD Million) Trend Analysis By Market Taxonomy, 2021 to 2025
- Market Size Value (USD Million) Forecast By Market Taxonomy, 2026 to 2036
- By Country
- China
- Japan
- South Korea
- By Application
- By Grade
- By End-Use Industry
- By Supply Form
- By Country
- Market Attractiveness Analysis
- By Country
- By Application
- By Grade
- By End-Use Industry
- By Supply Form
- Key Takeaways
- South Asia and Pacific Market Analysis and Forecast, By Country, 2021 to 2036
- Historical Market Size Value (USD Million) Trend Analysis By Market Taxonomy, 2021 to 2025
- Market Size Value (USD Million) Forecast By Market Taxonomy, 2026 to 2036
- By Country
- India
- ASEAN
- Australia and New Zealand
- By Application
- By Grade
- By End-Use Industry
- By Supply Form
- By Country
- Market Attractiveness Analysis
- By Country
- By Application
- By Grade
- By End-Use Industry
- By Supply Form
- Key Takeaways
- Middle East and Africa Market Analysis and Forecast, By Country, 2021 to 2036
- Historical Market Size Value (USD Million) Trend Analysis By Market Taxonomy, 2021 to 2025
- Market Size Value (USD Million) Forecast By Market Taxonomy, 2026 to 2036
- By Country
- GCC Countries
- South Africa
- Türkiye
- Israel
- By Application
- By Grade
- By End-Use Industry
- By Supply Form
- By Country
- Market Attractiveness Analysis
- By Country
- By Application
- By Grade
- By End-Use Industry
- By Supply Form
- Key Takeaways
- Key Countries Market Analysis
- United States
- Pricing Analysis
- Market Share Analysis, 2025
- By Application
- By Grade
- By End-Use Industry
- By Supply Form
- Canada
- Pricing Analysis
- Market Share Analysis, 2025
- By Application
- By Grade
- By End-Use Industry
- By Supply Form
- Brazil
- Pricing Analysis
- Market Share Analysis, 2025
- By Application
- By Grade
- By End-Use Industry
- By Supply Form
- Mexico
- Pricing Analysis
- Market Share Analysis, 2025
- By Application
- By Grade
- By End-Use Industry
- By Supply Form
- Argentina
- Pricing Analysis
- Market Share Analysis, 2025
- By Application
- By Grade
- By End-Use Industry
- By Supply Form
- Chile
- Pricing Analysis
- Market Share Analysis, 2025
- By Application
- By Grade
- By End-Use Industry
- By Supply Form
- Germany
- Pricing Analysis
- Market Share Analysis, 2025
- By Application
- By Grade
- By End-Use Industry
- By Supply Form
- France
- Pricing Analysis
- Market Share Analysis, 2025
- By Application
- By Grade
- By End-Use Industry
- By Supply Form
- United Kingdom
- Pricing Analysis
- Market Share Analysis, 2025
- By Application
- By Grade
- By End-Use Industry
- By Supply Form
- Italy
- Pricing Analysis
- Market Share Analysis, 2025
- By Application
- By Grade
- By End-Use Industry
- By Supply Form
- Spain
- Pricing Analysis
- Market Share Analysis, 2025
- By Application
- By Grade
- By End-Use Industry
- By Supply Form
- Benelux
- Pricing Analysis
- Market Share Analysis, 2025
- By Application
- By Grade
- By End-Use Industry
- By Supply Form
- Nordics
- Pricing Analysis
- Market Share Analysis, 2025
- By Application
- By Grade
- By End-Use Industry
- By Supply Form
- Poland
- Pricing Analysis
- Market Share Analysis, 2025
- By Application
- By Grade
- By End-Use Industry
- By Supply Form
- Czech Republic
- Pricing Analysis
- Market Share Analysis, 2025
- By Application
- By Grade
- By End-Use Industry
- By Supply Form
- Romania
- Pricing Analysis
- Market Share Analysis, 2025
- By Application
- By Grade
- By End-Use Industry
- By Supply Form
- Hungary
- Pricing Analysis
- Market Share Analysis, 2025
- By Application
- By Grade
- By End-Use Industry
- By Supply Form
- China
- Pricing Analysis
- Market Share Analysis, 2025
- By Application
- By Grade
- By End-Use Industry
- By Supply Form
- Japan
- Pricing Analysis
- Market Share Analysis, 2025
- By Application
- By Grade
- By End-Use Industry
- By Supply Form
- South Korea
- Pricing Analysis
- Market Share Analysis, 2025
- By Application
- By Grade
- By End-Use Industry
- By Supply Form
- India
- Pricing Analysis
- Market Share Analysis, 2025
- By Application
- By Grade
- By End-Use Industry
- By Supply Form
- ASEAN
- Pricing Analysis
- Market Share Analysis, 2025
- By Application
- By Grade
- By End-Use Industry
- By Supply Form
- Australia and New Zealand
- Pricing Analysis
- Market Share Analysis, 2025
- By Application
- By Grade
- By End-Use Industry
- By Supply Form
- GCC Countries
- Pricing Analysis
- Market Share Analysis, 2025
- By Application
- By Grade
- By End-Use Industry
- By Supply Form
- South Africa
- Pricing Analysis
- Market Share Analysis, 2025
- By Application
- By Grade
- By End-Use Industry
- By Supply Form
- Türkiye
- Pricing Analysis
- Market Share Analysis, 2025
- By Application
- By Grade
- By End-Use Industry
- By Supply Form
- Israel
- Pricing Analysis
- Market Share Analysis, 2025
- By Application
- By Grade
- By End-Use Industry
- By Supply Form
- United States
- Market Structure Analysis
- Competition Dashboard
- Competition Benchmarking
- Market Share Analysis of Top Players
- By Region
- By Application
- By Grade
- By End-Use Industry
- By Supply Form
- Emerging Startups
- Innovation Benchmarking
- Competition Analysis
- Competition Deep Dive
- BASF
- Overview
- Product Portfolio
- Profitability by Market Segments
- Sales Footprint
- Strategy Overview
- Marketing Strategy
- Product Strategy
- Channel Strategy
- Ashland
- Mitsubishi Chemical Group
- Dairen Chemical
- Chang Chun Group
- BASF PETRONAS Chemicals
- BASF
- Case Studies
- Success Stories
- Recent Developments
- Competition Deep Dive
- Assumptions & Acronyms Used
List of Tables
- Table 1: Global Market Value (USD Million) Forecast by Region, 2021 to 2036
- Table 2: Global Market Value (USD Million) Forecast by Application, 2021 to 2036
- Table 3: Global Market Value (USD Million) Forecast by Grade, 2021 to 2036
- Table 4: Global Market Value (USD Million) Forecast by End-Use Industry, 2021 to 2036
- Table 5: Global Market Value (USD Million) Forecast by Supply Form, 2021 to 2036
- Table 6: North America Market Value (USD Million) Forecast by Country, 2021 to 2036
- Table 7: North America Market Value (USD Million) Forecast by Application, 2021 to 2036
- Table 8: North America Market Value (USD Million) Forecast by Grade, 2021 to 2036
- Table 9: North America Market Value (USD Million) Forecast by End-Use Industry, 2021 to 2036
- Table 10: North America Market Value (USD Million) Forecast by Supply Form, 2021 to 2036
- Table 11: Latin America Market Value (USD Million) Forecast by Country, 2021 to 2036
- Table 12: Latin America Market Value (USD Million) Forecast by Application, 2021 to 2036
- Table 13: Latin America Market Value (USD Million) Forecast by Grade, 2021 to 2036
- Table 14: Latin America Market Value (USD Million) Forecast by End-Use Industry, 2021 to 2036
- Table 15: Latin America Market Value (USD Million) Forecast by Supply Form, 2021 to 2036
- Table 16: Western Europe Market Value (USD Million) Forecast by Country, 2021 to 2036
- Table 17: Western Europe Market Value (USD Million) Forecast by Application, 2021 to 2036
- Table 18: Western Europe Market Value (USD Million) Forecast by Grade, 2021 to 2036
- Table 19: Western Europe Market Value (USD Million) Forecast by End-Use Industry, 2021 to 2036
- Table 20: Western Europe Market Value (USD Million) Forecast by Supply Form, 2021 to 2036
- Table 21: Eastern Europe Market Value (USD Million) Forecast by Country, 2021 to 2036
- Table 22: Eastern Europe Market Value (USD Million) Forecast by Application, 2021 to 2036
- Table 23: Eastern Europe Market Value (USD Million) Forecast by Grade, 2021 to 2036
- Table 24: Eastern Europe Market Value (USD Million) Forecast by End-Use Industry, 2021 to 2036
- Table 25: Eastern Europe Market Value (USD Million) Forecast by Supply Form, 2021 to 2036
- Table 26: East Asia Market Value (USD Million) Forecast by Country, 2021 to 2036
- Table 27: East Asia Market Value (USD Million) Forecast by Application, 2021 to 2036
- Table 28: East Asia Market Value (USD Million) Forecast by Grade, 2021 to 2036
- Table 29: East Asia Market Value (USD Million) Forecast by End-Use Industry, 2021 to 2036
- Table 30: East Asia Market Value (USD Million) Forecast by Supply Form, 2021 to 2036
- Table 31: South Asia and Pacific Market Value (USD Million) Forecast by Country, 2021 to 2036
- Table 32: South Asia and Pacific Market Value (USD Million) Forecast by Application, 2021 to 2036
- Table 33: South Asia and Pacific Market Value (USD Million) Forecast by Grade, 2021 to 2036
- Table 34: South Asia and Pacific Market Value (USD Million) Forecast by End-Use Industry, 2021 to 2036
- Table 35: South Asia and Pacific Market Value (USD Million) Forecast by Supply Form, 2021 to 2036
- Table 36: Middle East and Africa Market Value (USD Million) Forecast by Country, 2021 to 2036
- Table 37: Middle East and Africa Market Value (USD Million) Forecast by Application, 2021 to 2036
- Table 38: Middle East and Africa Market Value (USD Million) Forecast by Grade, 2021 to 2036
- Table 39: Middle East and Africa Market Value (USD Million) Forecast by End-Use Industry, 2021 to 2036
- Table 40: Middle East and Africa Market Value (USD Million) Forecast by Supply Form, 2021 to 2036
List of Figures
- Figure 1: Global Market Pricing Analysis
- Figure 2: Global Market Value (USD Million) Forecast 2021-2036
- Figure 3: Global Market Value Share and BPS Analysis by Application, 2026 and 2036
- Figure 4: Global Market Y-o-Y Growth Comparison by Application, 2026-2036
- Figure 5: Global Market Attractiveness Analysis by Application
- Figure 6: Global Market Value Share and BPS Analysis by Grade, 2026 and 2036
- Figure 7: Global Market Y-o-Y Growth Comparison by Grade, 2026-2036
- Figure 8: Global Market Attractiveness Analysis by Grade
- Figure 9: Global Market Value Share and BPS Analysis by End-Use Industry, 2026 and 2036
- Figure 10: Global Market Y-o-Y Growth Comparison by End-Use Industry, 2026-2036
- Figure 11: Global Market Attractiveness Analysis by End-Use Industry
- Figure 12: Global Market Value Share and BPS Analysis by Supply Form, 2026 and 2036
- Figure 13: Global Market Y-o-Y Growth Comparison by Supply Form, 2026-2036
- Figure 14: Global Market Attractiveness Analysis by Supply Form
- Figure 15: Global Market Value (USD Million) Share and BPS Analysis by Region, 2026 and 2036
- Figure 16: Global Market Y-o-Y Growth Comparison by Region, 2026-2036
- Figure 17: Global Market Attractiveness Analysis by Region
- Figure 18: North America Market Incremental Dollar Opportunity, 2026-2036
- Figure 19: Latin America Market Incremental Dollar Opportunity, 2026-2036
- Figure 20: Western Europe Market Incremental Dollar Opportunity, 2026-2036
- Figure 21: Eastern Europe Market Incremental Dollar Opportunity, 2026-2036
- Figure 22: East Asia Market Incremental Dollar Opportunity, 2026-2036
- Figure 23: South Asia and Pacific Market Incremental Dollar Opportunity, 2026-2036
- Figure 24: Middle East and Africa Market Incremental Dollar Opportunity, 2026-2036
- Figure 25: North America Market Value Share and BPS Analysis by Country, 2026 and 2036
- Figure 26: North America Market Value Share and BPS Analysis by Application, 2026 and 2036
- Figure 27: North America Market Y-o-Y Growth Comparison by Application, 2026-2036
- Figure 28: North America Market Attractiveness Analysis by Application
- Figure 29: North America Market Value Share and BPS Analysis by Grade, 2026 and 2036
- Figure 30: North America Market Y-o-Y Growth Comparison by Grade, 2026-2036
- Figure 31: North America Market Attractiveness Analysis by Grade
- Figure 32: North America Market Value Share and BPS Analysis by End-Use Industry, 2026 and 2036
- Figure 33: North America Market Y-o-Y Growth Comparison by End-Use Industry, 2026-2036
- Figure 34: North America Market Attractiveness Analysis by End-Use Industry
- Figure 35: North America Market Value Share and BPS Analysis by Supply Form, 2026 and 2036
- Figure 36: North America Market Y-o-Y Growth Comparison by Supply Form, 2026-2036
- Figure 37: North America Market Attractiveness Analysis by Supply Form
- Figure 38: Latin America Market Value Share and BPS Analysis by Country, 2026 and 2036
- Figure 39: Latin America Market Value Share and BPS Analysis by Application, 2026 and 2036
- Figure 40: Latin America Market Y-o-Y Growth Comparison by Application, 2026-2036
- Figure 41: Latin America Market Attractiveness Analysis by Application
- Figure 42: Latin America Market Value Share and BPS Analysis by Grade, 2026 and 2036
- Figure 43: Latin America Market Y-o-Y Growth Comparison by Grade, 2026-2036
- Figure 44: Latin America Market Attractiveness Analysis by Grade
- Figure 45: Latin America Market Value Share and BPS Analysis by End-Use Industry, 2026 and 2036
- Figure 46: Latin America Market Y-o-Y Growth Comparison by End-Use Industry, 2026-2036
- Figure 47: Latin America Market Attractiveness Analysis by End-Use Industry
- Figure 48: Latin America Market Value Share and BPS Analysis by Supply Form, 2026 and 2036
- Figure 49: Latin America Market Y-o-Y Growth Comparison by Supply Form, 2026-2036
- Figure 50: Latin America Market Attractiveness Analysis by Supply Form
- Figure 51: Western Europe Market Value Share and BPS Analysis by Country, 2026 and 2036
- Figure 52: Western Europe Market Value Share and BPS Analysis by Application, 2026 and 2036
- Figure 53: Western Europe Market Y-o-Y Growth Comparison by Application, 2026-2036
- Figure 54: Western Europe Market Attractiveness Analysis by Application
- Figure 55: Western Europe Market Value Share and BPS Analysis by Grade, 2026 and 2036
- Figure 56: Western Europe Market Y-o-Y Growth Comparison by Grade, 2026-2036
- Figure 57: Western Europe Market Attractiveness Analysis by Grade
- Figure 58: Western Europe Market Value Share and BPS Analysis by End-Use Industry, 2026 and 2036
- Figure 59: Western Europe Market Y-o-Y Growth Comparison by End-Use Industry, 2026-2036
- Figure 60: Western Europe Market Attractiveness Analysis by End-Use Industry
- Figure 61: Western Europe Market Value Share and BPS Analysis by Supply Form, 2026 and 2036
- Figure 62: Western Europe Market Y-o-Y Growth Comparison by Supply Form, 2026-2036
- Figure 63: Western Europe Market Attractiveness Analysis by Supply Form
- Figure 64: Eastern Europe Market Value Share and BPS Analysis by Country, 2026 and 2036
- Figure 65: Eastern Europe Market Value Share and BPS Analysis by Application, 2026 and 2036
- Figure 66: Eastern Europe Market Y-o-Y Growth Comparison by Application, 2026-2036
- Figure 67: Eastern Europe Market Attractiveness Analysis by Application
- Figure 68: Eastern Europe Market Value Share and BPS Analysis by Grade, 2026 and 2036
- Figure 69: Eastern Europe Market Y-o-Y Growth Comparison by Grade, 2026-2036
- Figure 70: Eastern Europe Market Attractiveness Analysis by Grade
- Figure 71: Eastern Europe Market Value Share and BPS Analysis by End-Use Industry, 2026 and 2036
- Figure 72: Eastern Europe Market Y-o-Y Growth Comparison by End-Use Industry, 2026-2036
- Figure 73: Eastern Europe Market Attractiveness Analysis by End-Use Industry
- Figure 74: Eastern Europe Market Value Share and BPS Analysis by Supply Form, 2026 and 2036
- Figure 75: Eastern Europe Market Y-o-Y Growth Comparison by Supply Form, 2026-2036
- Figure 76: Eastern Europe Market Attractiveness Analysis by Supply Form
- Figure 77: East Asia Market Value Share and BPS Analysis by Country, 2026 and 2036
- Figure 78: East Asia Market Value Share and BPS Analysis by Application, 2026 and 2036
- Figure 79: East Asia Market Y-o-Y Growth Comparison by Application, 2026-2036
- Figure 80: East Asia Market Attractiveness Analysis by Application
- Figure 81: East Asia Market Value Share and BPS Analysis by Grade, 2026 and 2036
- Figure 82: East Asia Market Y-o-Y Growth Comparison by Grade, 2026-2036
- Figure 83: East Asia Market Attractiveness Analysis by Grade
- Figure 84: East Asia Market Value Share and BPS Analysis by End-Use Industry, 2026 and 2036
- Figure 85: East Asia Market Y-o-Y Growth Comparison by End-Use Industry, 2026-2036
- Figure 86: East Asia Market Attractiveness Analysis by End-Use Industry
- Figure 87: East Asia Market Value Share and BPS Analysis by Supply Form, 2026 and 2036
- Figure 88: East Asia Market Y-o-Y Growth Comparison by Supply Form, 2026-2036
- Figure 89: East Asia Market Attractiveness Analysis by Supply Form
- Figure 90: South Asia and Pacific Market Value Share and BPS Analysis by Country, 2026 and 2036
- Figure 91: South Asia and Pacific Market Value Share and BPS Analysis by Application, 2026 and 2036
- Figure 92: South Asia and Pacific Market Y-o-Y Growth Comparison by Application, 2026-2036
- Figure 93: South Asia and Pacific Market Attractiveness Analysis by Application
- Figure 94: South Asia and Pacific Market Value Share and BPS Analysis by Grade, 2026 and 2036
- Figure 95: South Asia and Pacific Market Y-o-Y Growth Comparison by Grade, 2026-2036
- Figure 96: South Asia and Pacific Market Attractiveness Analysis by Grade
- Figure 97: South Asia and Pacific Market Value Share and BPS Analysis by End-Use Industry, 2026 and 2036
- Figure 98: South Asia and Pacific Market Y-o-Y Growth Comparison by End-Use Industry, 2026-2036
- Figure 99: South Asia and Pacific Market Attractiveness Analysis by End-Use Industry
- Figure 100: South Asia and Pacific Market Value Share and BPS Analysis by Supply Form, 2026 and 2036
- Figure 101: South Asia and Pacific Market Y-o-Y Growth Comparison by Supply Form, 2026-2036
- Figure 102: South Asia and Pacific Market Attractiveness Analysis by Supply Form
- Figure 103: Middle East and Africa Market Value Share and BPS Analysis by Country, 2026 and 2036
- Figure 104: Middle East and Africa Market Value Share and BPS Analysis by Application, 2026 and 2036
- Figure 105: Middle East and Africa Market Y-o-Y Growth Comparison by Application, 2026-2036
- Figure 106: Middle East and Africa Market Attractiveness Analysis by Application
- Figure 107: Middle East and Africa Market Value Share and BPS Analysis by Grade, 2026 and 2036
- Figure 108: Middle East and Africa Market Y-o-Y Growth Comparison by Grade, 2026-2036
- Figure 109: Middle East and Africa Market Attractiveness Analysis by Grade
- Figure 110: Middle East and Africa Market Value Share and BPS Analysis by End-Use Industry, 2026 and 2036
- Figure 111: Middle East and Africa Market Y-o-Y Growth Comparison by End-Use Industry, 2026-2036
- Figure 112: Middle East and Africa Market Attractiveness Analysis by End-Use Industry
- Figure 113: Middle East and Africa Market Value Share and BPS Analysis by Supply Form, 2026 and 2036
- Figure 114: Middle East and Africa Market Y-o-Y Growth Comparison by Supply Form, 2026-2036
- Figure 115: Middle East and Africa Market Attractiveness Analysis by Supply Form
- Figure 116: Global Market - Tier Structure Analysis
- Figure 117: Global Market - Company Share Analysis
Frequently Asked Questions
How big is the Gamma Butyrolactone Market in 2026?
Future Market Insights estimates the global gamma butyrolactone market at USD 896.8 million in 2026, projected to reach USD 1,575.9 million by 2036.
How fast is the Gamma Butyrolactone Market expected to grow through 2036?
FMI projects a 5.8% CAGR from 2026 to 2036, taking the global market from USD 896.8 million in 2026 to USD 1,575.9 million by 2036.
Which application segment leads the Gamma Butyrolactone Market?
NMP and pyrrolidone production leads the application segment with a 40.8% share of 2026 revenue, supported by GBL's role as a feedstock for downstream chemical intermediates.
Which grade leads the Gamma Butyrolactone Market?
Industrial grade accounts for 40.0% of 2026 revenue, driven by large-scale industrial processing requirements and the importance of reliable product assay and conversion economics.
Which companies are profiled in the Gamma Butyrolactone Market?
The key companies profiled in the gamma butyrolactone market include BASF, Mitsubishi Chemical Group, Ashland, Dairen Chemical, Chang Chun Group, and BASF PETRONAS Chemicals. The analysis distinguishes direct product evidence from affiliate relationships and historical assets.
Preview the report firsthand - request a free sample
Get SampleGet the brochure for pricing and purchase details.
Get PDF
