Grating Indicator Calibrator Market Forecast and Outlook (2025–2035)

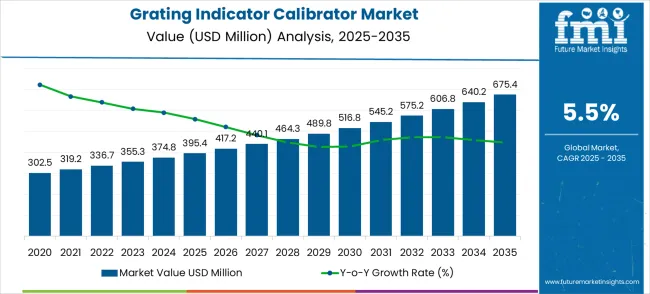
The grating indicator calibrator market is valued at USD 395.4 million in 2025 and is expected to reach USD 675.4 million by 2035, with a CAGR of 5.5%. From 2021 to 2025, the market grows from USD 302.5 million to USD 395.4 million, passing through intermediate values of USD 319.2 million, USD 336.7 million, USD 355.3 million, and USD 374.8 million. This early growth is primarily driven by the increasing adoption of grating indicator calibrators across industries such as aerospace, automotive, and manufacturing, where accurate calibration of optical instruments and systems is essential for ensuring high precision in measurements. The market sees steady growth as industries continue to prioritize quality control and the need for reliable calibration tools to maintain operational efficiency.
Quick Stats for Grating Indicator Calibrator Market

  • Grating Indicator Calibrator Market Value (2025): USD 395.4 million
  • Grating Indicator Calibrator Market Forecast Value (2035): USD 675.4 million
  • Grating Indicator Calibrator Market Forecast CAGR: 5.5%
  • Leading Segment in Grating Indicator Calibrator Market: Fully Automatic (48.0%)
  • Top Growth Regions in Grating Indicator Calibrator Market: China, India, Germany
  • Key Players in Grating Indicator Calibrator Market: Mitutoyo Corporation, HEIDENHAIN GmbH, Mahr GmbH

Grating Indicator Calibrator Market Market Value Analysis

Between 2026 and 2030, the market is expected to continue its expansion, growing from USD 395.4 million to USD 516.8 million, with values passing through USD 417.2 million, USD 440.1 million, and USD 464.3 million. During this period, the market witnesses an inflection point, where growth accelerates due to increased demand for advanced calibration solutions, particularly in industries that rely on high-precision equipment, such as telecommunications, semiconductors, and research laboratories. By 2030, the market is expected to reach USD 545.2 million, and from 2031 to 2035, it is projected to progress towards USD 675.4 million, with intermediate values of USD 575.2 million, USD 606.8 million, and USD 640.2 million.

Grating Indicator Calibrator Market Key Takeaways

Metric Value
Estimated Value in (2025E) USD 395.4 million
Forecast Value in (2035F) USD 675.4 million
Forecast CAGR (2025 to 2035) 5.5%

Why is the Grating Indicator Calibrator Market Growing?

Market expansion is being supported by the increasing demand for precision measurement and calibration equipment that ensures accuracy and traceability in manufacturing processes. Modern industrial applications require sophisticated measurement systems that can deliver consistent and reliable results while maintaining compliance with international quality standards. Advances in digital technology and automation have significantly improved calibration accuracy, measurement speed, and data management capabilities, making grating indicator calibrators essential tools for quality control operations across diverse industries.

The growing emphasis on quality assurance and regulatory compliance is driving demand for certified calibration equipment that enables manufacturers to maintain measurement traceability and meet stringent accuracy requirements. Rising manufacturing complexity, increased precision requirements, and growing adoption of lean manufacturing principles are contributing to expanded use of calibration equipment in production environments. The automotive, aerospace, and electronics industries are increasingly requiring precise measurement capabilities that support product development, quality control, and manufacturing process optimization.

Opportunity Pathway – Grating Indicator Calibrator Market

The grating indicator calibrator market (USD 395.4M → 675.4M by 2035, CAGR ~5.5%) is being driven by rising demand for high-precision metrology systems, automation in quality control, and expansion of aerospace and automotive manufacturing. Together, operation-type innovation and application specialization unlock USD 260–285M in incremental revenue opportunities by 2035 (aligned with the ~USD 280M market expansion).

Pathway A – Fully Automatic Calibrators for Precision Metrology

Growing need for automated calibration in metrology labs and production lines to ensure accuracy and reduce manual errors.

Largest near-term pool: USD 80–90M

Pathway B – Semi-automatic Solutions for Automotive & Parts Manufacturing

Semi-automatic calibrators balance cost efficiency with precision, addressing automotive component makers and tier-1 suppliers.

Incremental Pool: USD 55–65M

Pathway C – Manual Systems for Aerospace & Specialized Testing

Niche demand in aerospace R&D and specialized labs where manual oversight is critical for experimental reliability.

Opportunity Pool: USD 35–40M

Pathway D – Digital Integration & Smart Calibration Platforms

Integration with Industry 4.0, IoT, and digital twin platforms enhances predictive maintenance and calibration traceability.

Expected Pool: USD 40–45M

Pathway E – Emerging Asia-Pacific Local Manufacturing & Calibration Services

China, India, and Japan driving local calibrator manufacturing, supported by regional metrology standards and industrial automation.

Regional Pool: USD 30–35M

Pathway F – Aerospace & Defense Precision Calibration

Expanding defense and aerospace programs in the USA, Europe, and Asia require ultra-precise calibrators for mission-critical components.

Specialized Pool: USD 20–25M

Segmental Analysis

The market is segmented by operation type, end-use industry, and region. By operation type, the market is divided into fully automatic, semi-automatic, manual, and others. Based on end-use industry, the market is categorized into metrology and testing, automobile and parts manufacturing, aerospace, and others. Regionally, the market is divided into North America, Europe, East Asia, South Asia & Pacific, Latin America, and Middle East & Africa.
By Operation Type, Fully Automatic Segment Accounts for 48% Market Share

Grating Indicator Calibrator Market Analysis By Classification

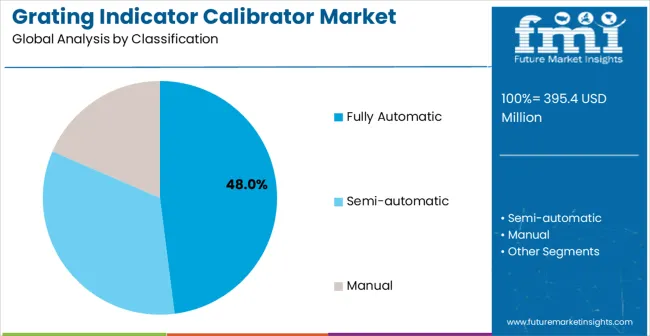
Fully automatic grating indicator calibrators are projected to account for 48% of the market in 2025. This leading share is supported by the widespread adoption of automated calibration systems that provide enhanced accuracy and reduced operational time. Fully automatic systems offer consistent measurement results while minimizing human error and improving overall calibration efficiency. The segment benefits from technological advancements in automation and comprehensive integration capabilities with existing manufacturing systems. Manufacturing facilities are increasingly adopting fully automatic calibrators to streamline quality control processes and reduce dependency on skilled operators.

The segment growth is further supported by declining equipment costs and improved reliability of automated measurement systems across diverse industrial applications. Modern fully automatic systems incorporate artificial intelligence algorithms that enable predictive maintenance scheduling and optimize calibration procedures based on historical performance data. These calibrators feature integrated environmental compensation systems that automatically adjust for temperature, humidity, and vibration effects on measurement accuracy. Advanced automation capabilities include automatic tool recognition, measurement sequence optimization, and real-time quality control feedback that enhances operational efficiency.
By End-Use Industry, Metrology and Testing Segment Accounts for 42% Market Share

Grating Indicator Calibrator Market Analysis By Application

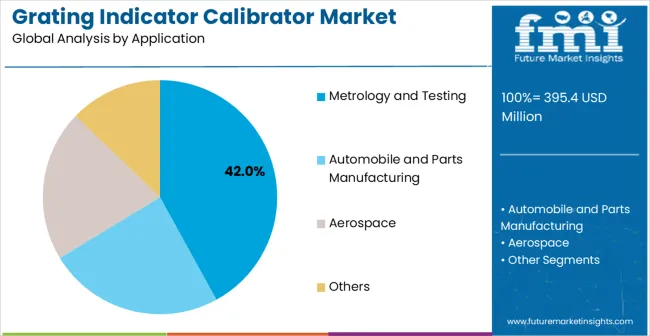
Metrology and testing applications are expected to represent 42% of grating indicator calibrator demand in 2025. This dominant share reflects the critical role of precision measurement in quality control and calibration laboratories. Modern metrology facilities require sophisticated calibration equipment that can deliver traceable measurement results and maintain certification compliance. The segment benefits from growing quality assurance requirements and increasing demand for certified measurement standards across various industries. Metrology laboratories are expanding their calibration capabilities to serve multiple industry sectors including automotive, aerospace, electronics, and medical device manufacturing.

The segment is supported by increasing regulatory compliance requirements and international standardization initiatives that mandate regular calibration activities and certified measurement traceability. Primary metrology institutes and national laboratories are driving demand for ultra-precision calibrators that establish measurement standards and support international comparison programs. Secondary calibration facilities require equipment that maintains traceability chains while providing cost-effective services to industrial customers across diverse sectors. Advanced metrology applications incorporate statistical process control capabilities that monitor calibration stability and identify systematic measurement errors.

What are the Drivers, Restraints, and Key Trends of the Grating Indicator Calibrator Market?

The grating indicator calibrator market is advancing steadily due to increasing precision manufacturing requirements and growing recognition of calibration importance in quality control processes. The market faces challenges including high equipment costs, need for specialized technical expertise, and varying calibration standards across different industries. Technological advancement and certification programs continue to influence equipment development and market growth patterns.

Integration of Digital Technologies and Smart Measurement Systems

The growing implementation of digital measurement technologies and automated calibration processes is enabling improved accuracy and reduced measurement time. Advanced calibration equipment incorporating digital displays, automated measurement cycles, and comprehensive data logging capabilities provide enhanced precision and operational efficiency. Smart measurement systems are particularly valuable for high-volume manufacturing operations that require frequent calibration activities and detailed measurement documentation while supporting predictive maintenance and quality management initiatives.

Development of Industry 4.0 Integration and Connectivity Solutions

Calibration equipment manufacturers are developing advanced connectivity features and digital integration capabilities that support smart manufacturing initiatives and comprehensive quality management systems. Integration of IoT sensors, cloud-based data management, and real-time monitoring systems enables automated calibration scheduling, predictive maintenance, and comprehensive measurement data analytics. These technological advances support integration with manufacturing execution systems and enable advanced quality control protocols that improve operational efficiency and measurement traceability.
Key Country Analysis of Grating Indicator Calibrator Market

Grating Indicator Calibrator Market Cagr Analysis By Country

Country CAGR (2025-2035)
China 7.4%
India 6.9%
Germany 6.3%
Brazil 5.8%
United States 5.2%
United Kingdom 4.7%
Japan 4.1%

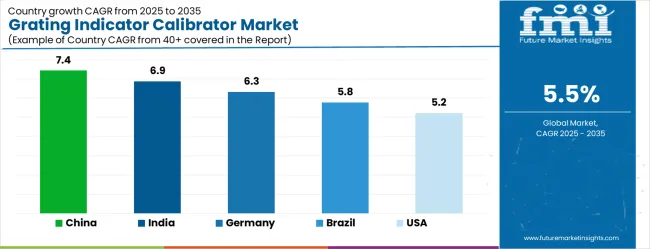
The grating indicator calibrator market demonstrates varied growth patterns across key countries, with China leading at a 7.4% CAGR through 2035, driven by expanding manufacturing capabilities, growing precision requirements, and increasing adoption of quality control systems across diverse industrial applications. India follows at 6.9%, supported by rising manufacturing activities, expanding automotive and aerospace sectors, and growing emphasis on quality certification. Germany records 6.3% growth, emphasizing precision engineering excellence, advanced manufacturing capabilities, and strong metrology infrastructure development. Brazil shows steady growth at 5.8%, driven by expanding industrial sector and increasing quality control awareness. The United States maintains 5.2% growth, focusing on technological innovation and advanced manufacturing applications. The United Kingdom demonstrates 4.7% expansion, supported by aerospace and automotive industry requirements. Japan records 4.1% growth, leveraging technological innovation and precision manufacturing expertise.

The report covers an in-depth analysis of 40+ countries with top-performing countries are highlighted below.

Demand Forecast for Grating Indicator Calibrator Market in China

The grating indicator calibrator market in China is projected to expand at the highest growth rate with a CAGR of 7.4% through 2035, driven by massive manufacturing sector expansion, growing precision requirements, and increasing adoption of quality control systems across automotive, aerospace, and electronics industries. The country's comprehensive manufacturing strategy includes significant investments in precision measurement equipment, calibration laboratories, and quality control infrastructure that require advanced calibration solutions. Major manufacturing companies and metrology facilities are implementing sophisticated calibration systems to improve measurement accuracy and maintain international certification standards while supporting growing domestic and export production requirements.

  • Manufacturing sector development is supporting grating indicator calibrator adoption through industrial modernization programs, quality assurance initiatives, and comprehensive technology advancement that enhances domestic precision manufacturing capabilities across automotive, aerospace, and electronics industries.
  • Quality control infrastructure expansion is creating demand for advanced calibration equipment that supports measurement traceability, certification compliance, and comprehensive quality management systems while meeting growing domestic and international quality standards and regulatory requirements.

Growth Analysis of Grating Indicator Calibrator Market in India

Revenue from grating indicator calibrators in India is projected to grow at a CAGR of 6.9%, supported by expanding manufacturing industries, growing automotive and aerospace sectors, and increasing adoption of quality control systems across diverse applications. The country's emphasis on industrial development and manufacturing excellence is driving demand for precision measurement equipment that supports product quality, process optimization, and certification compliance requirements. Government programs promoting manufacturing development and skill enhancement are creating favorable conditions for calibration equipment adoption across precision manufacturing and quality control applications. Educational initiatives and technical training programs are developing workforce capabilities that support advanced calibration equipment operation and maintenance requirements.

  • Industrial development growth is supporting grating indicator calibrator adoption through manufacturing expansion projects, quality improvement initiatives, and comprehensive workforce development programs that enhance domestic precision manufacturing and metrology capabilities.
  • Quality certification requirements are creating opportunities for calibration equipment suppliers that can provide comprehensive solutions including technical support, training services, and ongoing maintenance assistance for diverse manufacturing and testing applications.

Sales Outlook for Grating Indicator Calibrator Market in Germany

Demand for grating indicator calibrators in Germany is projected to expand at a CAGR of 6.3%, supported by the country's leadership in precision engineering, advanced manufacturing capabilities, and comprehensive quality management systems across diverse industrial sectors. German manufacturers and metrology facilities are implementing sophisticated calibration solutions that meet stringent quality standards while supporting advanced manufacturing operations and precision measurement requirements. The country's extensive automotive, aerospace, and machinery manufacturing industries are driving significant calibrator demand for precision work and quality assurance operations. Advanced engineering partnerships are facilitating technology development and knowledge sharing across calibration equipment manufacturing and precision measurement sectors.

  • Precision engineering capabilities are supporting development of advanced grating indicator calibrators that incorporate sophisticated measurement technologies, automated calibration systems, and comprehensive data management features while meeting rigorous German quality and performance standards.
  • Manufacturing excellence initiatives are driving calibration equipment demand through continuous improvement programs, quality management system development, and comprehensive technical training that facilitates widespread adoption of precision measurement tools for advanced manufacturing applications.

Opportunity Assessment for Grating Indicator Calibrator Market in Brazil

Revenue from grating indicator calibrators in Brazil is projected to grow at a CAGR of 5.8%, driven by expanding manufacturing industries, growing automotive sector, and increasing quality control awareness across diverse applications. Brazilian manufacturers and quality control facilities are investing in calibration solutions to enhance measurement accuracy and compliance while supporting domestic industrial development and export competitiveness. Government programs supporting industrial development are facilitating access to modern calibration equipment and technical expertise. Regional manufacturing centers are developing specialized capabilities that support calibration equipment distribution and technical support across diverse geographic markets. Economic development initiatives are creating opportunities for both professional and industrial calibration equipment adoption across expanding manufacturing and quality control sectors.

  • Industrial manufacturing expansion is supporting grating indicator calibrator adoption through modernization programs, quality improvement initiatives, and comprehensive technology advancement that enhances domestic production capabilities and international competitiveness.
  • Quality control infrastructure development is creating demand for reliable calibration equipment that supports measurement accuracy, certification compliance, and comprehensive quality management systems for diverse manufacturing and testing applications.

Market Demand Insights for Grating Indicator Calibrator Market in the United States

The sale for grating indicator calibrators in the United States is projected to expand at a CAGR of 5.2%, driven by technological innovation, advanced manufacturing applications, and ongoing quality control advancement initiatives across aerospace, automotive, and electronics sectors. American manufacturers and metrology facilities are implementing sophisticated calibration solutions to maintain measurement accuracy and compliance while supporting diverse precision manufacturing and quality control applications. The aerospace and defense industries are driving significant calibrator demand for precision measurement, quality assurance, and certification compliance requirements. Government initiatives supporting domestic manufacturing are creating opportunities for advanced calibration equipment development and production.

  • Technological innovation programs are supporting advanced grating indicator calibrator development through research funding, industry partnerships, and comprehensive performance testing that addresses demanding precision manufacturing applications and emerging measurement requirements.
  • Advanced manufacturing initiatives are driving calibration equipment demand through modernization programs, quality system development, and comprehensive technical support that facilitates broader adoption of precision measurement technologies and quality control systems.

Growth Prospects for Grating Indicator Calibrator Market in the United Kingdom

Demand for grating indicator calibrators in the United Kingdom is projected to grow at a CAGR of 4.7%, supported by strong aerospace and automotive industries, expanding precision manufacturing capabilities, and increasing quality control requirements across diverse applications. British manufacturers and metrology facilities are investing in calibration solutions to support advanced manufacturing projects, quality assurance operations, and certification compliance requirements. The country's established aerospace and automotive sectors are facilitating calibration equipment adoption through comprehensive quality standards and precision measurement requirements. Advanced manufacturing initiatives and technology development programs are creating demand for precision measurement equipment that enables manufacturers to meet stringent quality and performance standards.
  • Aerospace industry requirements are supporting grating indicator calibrator adoption through precision measurement programs, quality assurance initiatives, and comprehensive certification compliance that enhances domestic manufacturing capabilities and international competitiveness.
  • Automotive sector development is creating opportunities for calibration equipment suppliers that can provide comprehensive solutions including precision measurement capabilities, quality control support, and ongoing technical assistance for diverse manufacturing and testing applications.

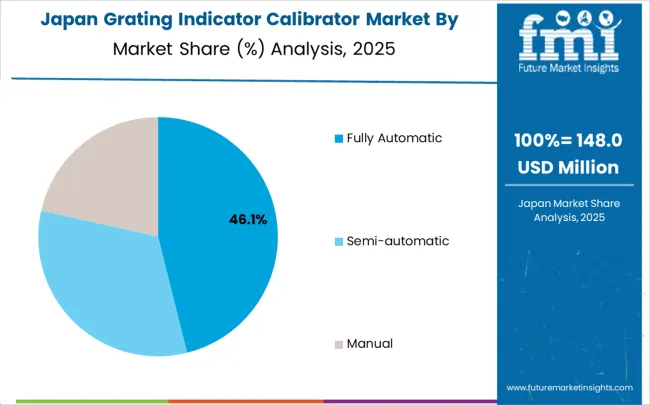
Future Outlook for Grating Indicator Calibrator Market in Japan

Grating Indicator Calibrator Market Japan Market Share Analysis By Classification

Revenue from grating indicator calibrators in Japan is projected to grow at a CAGR of 4.1%, supported by technological innovation capabilities, precision manufacturing expertise, and emphasis on quality excellence across professional and industrial markets. Japanese manufacturers and metrology facilities are implementing sophisticated calibration solutions that demonstrate superior performance characteristics while supporting diverse precision manufacturing applications requiring accuracy and reliability. The country's advanced automotive and electronics manufacturing sectors are driving demand for high-quality calibration equipment that supports precision operations and comprehensive quality management systems. Quality management principles and continuous improvement programs are driving adoption of calibration equipment that enhances operational excellence and measurement accuracy across diverse applications.

  • Technological innovation programs are supporting development of advanced grating indicator calibrators that incorporate cutting-edge measurement technologies, precision control systems, and comprehensive data management features while maintaining Japan's reputation for manufacturing excellence.
  • Precision manufacturing expertise is driving demand for high-performance calibration equipment that supports advanced measurement operations, specialty applications, and demanding quality standards for professional and industrial precision manufacturing projects requiring superior accuracy and reliability.

Europe Market Split by Country

The grating indicator calibrator market in Europe is projected to grow from USD 89.5 million in 2025 to USD 152.7 million by 2035, registering a CAGR of 5.5% over the forecast period. Germany is expected to maintain its leadership with 32.8% market share in 2025, projected to grow to 33.4% by 2035, supported by its strong manufacturing sector, advanced metrology infrastructure, and comprehensive quality control requirements. France follows with 19.2% market share in 2025, expected to reach 19.6% by 2035, driven by aerospace manufacturing activities and precision engineering applications.

The Rest of Europe region is projected to maintain stable share at 17.4% throughout the forecast period, attributed to growing manufacturing activities in Eastern European countries and expanding quality control requirements. United Kingdom contributes 15.8% in 2025, projected to reach 15.3% by 2035, supported by strong aerospace and automotive industries. Italy maintains 14.8% share in 2025, expected to grow to 15.7% by 2035, while other European countries demonstrate steady growth patterns reflecting regional manufacturing development and precision measurement adoption trends.

Competitive Landscape of Grating Indicator Calibrator Market

The grating indicator calibrator market is characterized by competition among established precision measurement equipment manufacturers, specialized metrology providers, and advanced technology companies. Companies are investing in digital calibration technologies, automated measurement systems, precision engineering improvements, and comprehensive calibration solutions to deliver accurate, reliable, and efficient measurement equipment. Strategic partnerships, technological innovation, and market expansion initiatives are central to strengthening product portfolios and market presence.

Mitutoyo Corporation, Japan-based, offers comprehensive precision measurement solutions with focus on accuracy, reliability, and advanced calibration capabilities across diverse measurement applications. HEIDENHAIN GmbH, Germany, provides sophisticated measurement technologies emphasizing precision, innovation, and digital integration for advanced manufacturing and metrology applications. Mahr GmbH, Germany, delivers precision measurement equipment with focus on quality, accuracy, and comprehensive calibration solutions for diverse industrial requirements.

Sylvac SA, Switzerland, emphasizes digital measurement technologies with focus on precision, user-friendly operation, and comprehensive data management capabilities. Renishaw plc, United Kingdom, provides advanced metrology solutions with focus on innovation, precision, and integrated measurement systems. Other key players including Suzhou Yuancheng, Jiangsu Tongheng, Beijing TIME High Technology, Dalian Zhonghe, Qingdao Rixin Metrology, Solartron Metrology, and Taian Demei Electromechanical Equipment contribute specialized expertise and diverse product offerings across global and regional markets.

Key Players in the Grating Indicator Calibrator Market

  • Mitutoyo Corporation
  • HEIDENHAIN GmbH
  • Mahr GmbH
  • Sylvac SA
  • Renishaw plc
  • Suzhou Yuancheng
  • Jiangsu Tongheng
  • Beijing TIME High Technology
  • Dalian Zhonghe
  • Qingdao Rixin Metrology
  • Solartron Metrology
  • Taian Demei Electromechanical Equipment Co., Ltd.

Scope of the Report

Item Value
Quantitative Units (2025) USD 395.4 million
Operation Type Fully Automatic, Semi-automatic, Manual
End-Use Industry Metrology and Testing, Automobile and Parts Manufacturing, Aerospace, and Others
Regions Covered North America, Europe, East Asia, South Asia & Pacific, Latin America, Middle East & Africa
Countries Covered United States, Canada, United Kingdom, Germany, France, China, Japan, South Korea, India, Brazil, Australia and 40+ countries
Key Companies Profiled Mitutoyo Corporation, HEIDENHAIN GmbH, Mahr GmbH, Sylvac SA, Renishaw plc, Solartron Metrology, Suzhou Yuancheng, Jiangsu Tongheng, Beijing TIME High Technology, Dalian Zhonghe, Qingdao Rixin Metrology, Taian Demei Electromechanical Equipment Co., Ltd.
Additional Attributes Dollar sales by operation type and end-use industry segments, regional demand trends across North America, Europe, and Asia-Pacific, competitive landscape with established precision measurement manufacturers and specialized metrology providers, buyer preferences for different automation levels and calibration systems, integration with comprehensive quality management systems and Industry 4.0 platforms, innovations in measurement accuracy and digital calibration features, and adoption of smart measurement technologies and advanced data management systems for enhanced precision and operational efficiency

Grating Indicator Calibrator Market by Segments

Operation Type:

  • Fully Automatic
  • Semi-automatic
  • Manual

End-Use Industry:

  • Metrology and Testing
  • Automobile and Parts Manufacturing
  • Aerospace
  • Others

Region:

  • North America
    • United States
    • Canada
    • Mexico
  • Europe
    • Germany
    • United Kingdom
    • France
    • Italy
    • Spain
    • Nordic
    • BENELUX
    • Rest of Europe
  • East Asia
    • China
    • Japan
    • South Korea
  • South Asia & Pacific
    • India
    • ASEAN
    • Australia & New Zealand
    • Rest of South Asia & Pacific
  • Latin America
    • Brazil
    • Chile
    • Rest of Latin America
  • Middle East & Africa
    • Kingdom of Saudi Arabia
    • Other GCC Countries
    • Turkiye
    • South Africa
    • Other African Union
    • Rest of Middle East & Africa

Table of Content

  1. Executive Summary
    • Global Market Outlook
    • Demand to side Trends
    • Supply to side Trends
    • Technology Roadmap Analysis
    • Analysis and Recommendations
  2. Market Overview
    • Market Coverage / Taxonomy
    • Market Definition / Scope / Limitations
  3. Market Background
    • Market Dynamics
      • Drivers
      • Restraints
      • Opportunity
      • Trends
    • Scenario Forecast
      • Demand in Optimistic Scenario
      • Demand in Likely Scenario
      • Demand in Conservative Scenario
    • Opportunity Map Analysis
    • Product Life Cycle Analysis
    • Supply Chain Analysis
    • Investment Feasibility Matrix
    • Value Chain Analysis
    • PESTLE and Porter’s Analysis
    • Regulatory Landscape
    • Regional Parent Market Outlook
    • Production and Consumption Statistics
    • Import and Export Statistics
  4. Global Market Analysis 2020 to 2024 and Forecast, 2025 to 2035
    • Historical Market Size Value (USD Million) Analysis, 2020 to 2024
    • Current and Future Market Size Value (USD Million) Projections, 2025 to 2035
      • Y to o to Y Growth Trend Analysis
      • Absolute $ Opportunity Analysis
  5. Global Market Pricing Analysis 2020 to 2024 and Forecast 2025 to 2035
  6. Global Market Analysis 2020 to 2024 and Forecast 2025 to 2035, By Classification
    • Introduction / Key Findings
    • Historical Market Size Value (USD Million) Analysis By Classification , 2020 to 2024
    • Current and Future Market Size Value (USD Million) Analysis and Forecast By Classification , 2025 to 2035
      • Fully Automatic
      • Semi-automatic
      • Manual
    • Y to o to Y Growth Trend Analysis By Classification , 2020 to 2024
    • Absolute $ Opportunity Analysis By Classification , 2025 to 2035
  7. Global Market Analysis 2020 to 2024 and Forecast 2025 to 2035, By Application
    • Introduction / Key Findings
    • Historical Market Size Value (USD Million) Analysis By Application, 2020 to 2024
    • Current and Future Market Size Value (USD Million) Analysis and Forecast By Application, 2025 to 2035
      • Metrology and Testing
      • Automobile and Parts Manufacturing
      • Aerospace
      • Others
    • Y to o to Y Growth Trend Analysis By Application, 2020 to 2024
    • Absolute $ Opportunity Analysis By Application, 2025 to 2035
  8. Global Market Analysis 2020 to 2024 and Forecast 2025 to 2035, By Region
    • Introduction
    • Historical Market Size Value (USD Million) Analysis By Region, 2020 to 2024
    • Current Market Size Value (USD Million) Analysis and Forecast By Region, 2025 to 2035
      • North America
      • Latin America
      • Western Europe
      • Eastern Europe
      • East Asia
      • South Asia and Pacific
      • Middle East & Africa
    • Market Attractiveness Analysis By Region
  9. North America Market Analysis 2020 to 2024 and Forecast 2025 to 2035, By Country
    • Historical Market Size Value (USD Million) Trend Analysis By Market Taxonomy, 2020 to 2024
    • Market Size Value (USD Million) Forecast By Market Taxonomy, 2025 to 2035
      • By Country
        • USA
        • Canada
        • Mexico
      • By Classification
      • By Application
    • Market Attractiveness Analysis
      • By Country
      • By Classification
      • By Application
    • Key Takeaways
  10. Latin America Market Analysis 2020 to 2024 and Forecast 2025 to 2035, By Country
    • Historical Market Size Value (USD Million) Trend Analysis By Market Taxonomy, 2020 to 2024
    • Market Size Value (USD Million) Forecast By Market Taxonomy, 2025 to 2035
      • By Country
        • Brazil
        • Chile
        • Rest of Latin America
      • By Classification
      • By Application
    • Market Attractiveness Analysis
      • By Country
      • By Classification
      • By Application
    • Key Takeaways
  11. Western Europe Market Analysis 2020 to 2024 and Forecast 2025 to 2035, By Country
    • Historical Market Size Value (USD Million) Trend Analysis By Market Taxonomy, 2020 to 2024
    • Market Size Value (USD Million) Forecast By Market Taxonomy, 2025 to 2035
      • By Country
        • Germany
        • UK
        • Italy
        • Spain
        • France
        • Nordic
        • BENELUX
        • Rest of Western Europe
      • By Classification
      • By Application
    • Market Attractiveness Analysis
      • By Country
      • By Classification
      • By Application
    • Key Takeaways
  12. Eastern Europe Market Analysis 2020 to 2024 and Forecast 2025 to 2035, By Country
    • Historical Market Size Value (USD Million) Trend Analysis By Market Taxonomy, 2020 to 2024
    • Market Size Value (USD Million) Forecast By Market Taxonomy, 2025 to 2035
      • By Country
        • Russia
        • Poland
        • Hungary
        • Balkan & Baltic
        • Rest of Eastern Europe
      • By Classification
      • By Application
    • Market Attractiveness Analysis
      • By Country
      • By Classification
      • By Application
    • Key Takeaways
  13. East Asia Market Analysis 2020 to 2024 and Forecast 2025 to 2035, By Country
    • Historical Market Size Value (USD Million) Trend Analysis By Market Taxonomy, 2020 to 2024
    • Market Size Value (USD Million) Forecast By Market Taxonomy, 2025 to 2035
      • By Country
        • China
        • Japan
        • South Korea
      • By Classification
      • By Application
    • Market Attractiveness Analysis
      • By Country
      • By Classification
      • By Application
    • Key Takeaways
  14. South Asia and Pacific Market Analysis 2020 to 2024 and Forecast 2025 to 2035, By Country
    • Historical Market Size Value (USD Million) Trend Analysis By Market Taxonomy, 2020 to 2024
    • Market Size Value (USD Million) Forecast By Market Taxonomy, 2025 to 2035
      • By Country
        • India
        • ASEAN
        • Australia & New Zealand
        • Rest of South Asia and Pacific
      • By Classification
      • By Application
    • Market Attractiveness Analysis
      • By Country
      • By Classification
      • By Application
    • Key Takeaways
  15. Middle East & Africa Market Analysis 2020 to 2024 and Forecast 2025 to 2035, By Country
    • Historical Market Size Value (USD Million) Trend Analysis By Market Taxonomy, 2020 to 2024
    • Market Size Value (USD Million) Forecast By Market Taxonomy, 2025 to 2035
      • By Country
        • Kingdom of Saudi Arabia
        • Other GCC Countries
        • Turkiye
        • South Africa
        • Other African Union
        • Rest of Middle East & Africa
      • By Classification
      • By Application
    • Market Attractiveness Analysis
      • By Country
      • By Classification
      • By Application
    • Key Takeaways
  16. Key Countries Market Analysis
    • USA
      • Pricing Analysis
      • Market Share Analysis, 2024
        • By Classification
        • By Application
    • Canada
      • Pricing Analysis
      • Market Share Analysis, 2024
        • By Classification
        • By Application
    • Mexico
      • Pricing Analysis
      • Market Share Analysis, 2024
        • By Classification
        • By Application
    • Brazil
      • Pricing Analysis
      • Market Share Analysis, 2024
        • By Classification
        • By Application
    • Chile
      • Pricing Analysis
      • Market Share Analysis, 2024
        • By Classification
        • By Application
    • Germany
      • Pricing Analysis
      • Market Share Analysis, 2024
        • By Classification
        • By Application
    • UK
      • Pricing Analysis
      • Market Share Analysis, 2024
        • By Classification
        • By Application
    • Italy
      • Pricing Analysis
      • Market Share Analysis, 2024
        • By Classification
        • By Application
    • Spain
      • Pricing Analysis
      • Market Share Analysis, 2024
        • By Classification
        • By Application
    • France
      • Pricing Analysis
      • Market Share Analysis, 2024
        • By Classification
        • By Application
    • India
      • Pricing Analysis
      • Market Share Analysis, 2024
        • By Classification
        • By Application
    • ASEAN
      • Pricing Analysis
      • Market Share Analysis, 2024
        • By Classification
        • By Application
    • Australia & New Zealand
      • Pricing Analysis
      • Market Share Analysis, 2024
        • By Classification
        • By Application
    • China
      • Pricing Analysis
      • Market Share Analysis, 2024
        • By Classification
        • By Application
    • Japan
      • Pricing Analysis
      • Market Share Analysis, 2024
        • By Classification
        • By Application
    • South Korea
      • Pricing Analysis
      • Market Share Analysis, 2024
        • By Classification
        • By Application
    • Russia
      • Pricing Analysis
      • Market Share Analysis, 2024
        • By Classification
        • By Application
    • Poland
      • Pricing Analysis
      • Market Share Analysis, 2024
        • By Classification
        • By Application
    • Hungary
      • Pricing Analysis
      • Market Share Analysis, 2024
        • By Classification
        • By Application
    • Kingdom of Saudi Arabia
      • Pricing Analysis
      • Market Share Analysis, 2024
        • By Classification
        • By Application
    • Turkiye
      • Pricing Analysis
      • Market Share Analysis, 2024
        • By Classification
        • By Application
    • South Africa
      • Pricing Analysis
      • Market Share Analysis, 2024
        • By Classification
        • By Application
  17. Market Structure Analysis
    • Competition Dashboard
    • Competition Benchmarking
    • Market Share Analysis of Top Players
      • By Regional
      • By Classification
      • By Application
  18. Competition Analysis
    • Competition Deep Dive
  19. Assumptions & Acronyms Used
  20. Research Methodology

List of Tables

  • Table 1: Global Market Value (USD Million) Forecast by Region, 2020 to 2035
  • Table 2: Global Market Value (USD Million) Forecast by Classification , 2020 to 2035
  • Table 3: Global Market Value (USD Million) Forecast by Application, 2020 to 2035
  • Table 4: North America Market Value (USD Million) Forecast by Country, 2020 to 2035
  • Table 5: North America Market Value (USD Million) Forecast by Classification , 2020 to 2035
  • Table 6: North America Market Value (USD Million) Forecast by Application, 2020 to 2035
  • Table 7: Latin America Market Value (USD Million) Forecast by Country, 2020 to 2035
  • Table 8: Latin America Market Value (USD Million) Forecast by Classification , 2020 to 2035
  • Table 9: Latin America Market Value (USD Million) Forecast by Application, 2020 to 2035
  • Table 10: Western Europe Market Value (USD Million) Forecast by Country, 2020 to 2035
  • Table 11: Western Europe Market Value (USD Million) Forecast by Classification , 2020 to 2035
  • Table 12: Western Europe Market Value (USD Million) Forecast by Application, 2020 to 2035
  • Table 13: Eastern Europe Market Value (USD Million) Forecast by Country, 2020 to 2035
  • Table 14: Eastern Europe Market Value (USD Million) Forecast by Classification , 2020 to 2035
  • Table 15: Eastern Europe Market Value (USD Million) Forecast by Application, 2020 to 2035
  • Table 16: East Asia Market Value (USD Million) Forecast by Country, 2020 to 2035
  • Table 17: East Asia Market Value (USD Million) Forecast by Classification , 2020 to 2035
  • Table 18: East Asia Market Value (USD Million) Forecast by Application, 2020 to 2035
  • Table 19: South Asia and Pacific Market Value (USD Million) Forecast by Country, 2020 to 2035
  • Table 20: South Asia and Pacific Market Value (USD Million) Forecast by Classification , 2020 to 2035
  • Table 21: South Asia and Pacific Market Value (USD Million) Forecast by Application, 2020 to 2035
  • Table 22: Middle East & Africa Market Value (USD Million) Forecast by Country, 2020 to 2035
  • Table 23: Middle East & Africa Market Value (USD Million) Forecast by Classification , 2020 to 2035
  • Table 24: Middle East & Africa Market Value (USD Million) Forecast by Application, 2020 to 2035

List of Figures

  • Figure 1: Global Market Pricing Analysis
  • Figure 2: Global Market Value (USD Million) Forecast 2020-2035
  • Figure 3: Global Market Value Share and BPS Analysis by Classification , 2025 and 2035
  • Figure 4: Global Market Y to o to Y Growth Comparison by Classification , 2025-2035
  • Figure 5: Global Market Attractiveness Analysis by Classification
  • Figure 6: Global Market Value Share and BPS Analysis by Application, 2025 and 2035
  • Figure 7: Global Market Y to o to Y Growth Comparison by Application, 2025-2035
  • Figure 8: Global Market Attractiveness Analysis by Application
  • Figure 9: Global Market Value (USD Million) Share and BPS Analysis by Region, 2025 and 2035
  • Figure 10: Global Market Y to o to Y Growth Comparison by Region, 2025-2035
  • Figure 11: Global Market Attractiveness Analysis by Region
  • Figure 12: North America Market Incremental Dollar Opportunity, 2025-2035
  • Figure 13: Latin America Market Incremental Dollar Opportunity, 2025-2035
  • Figure 14: Western Europe Market Incremental Dollar Opportunity, 2025-2035
  • Figure 15: Eastern Europe Market Incremental Dollar Opportunity, 2025-2035
  • Figure 16: East Asia Market Incremental Dollar Opportunity, 2025-2035
  • Figure 17: South Asia and Pacific Market Incremental Dollar Opportunity, 2025-2035
  • Figure 18: Middle East & Africa Market Incremental Dollar Opportunity, 2025-2035
  • Figure 19: North America Market Value Share and BPS Analysis by Country, 2025 and 2035
  • Figure 20: North America Market Value Share and BPS Analysis by Classification , 2025 and 2035
  • Figure 21: North America Market Y to o to Y Growth Comparison by Classification , 2025-2035
  • Figure 22: North America Market Attractiveness Analysis by Classification
  • Figure 23: North America Market Value Share and BPS Analysis by Application, 2025 and 2035
  • Figure 24: North America Market Y to o to Y Growth Comparison by Application, 2025-2035
  • Figure 25: North America Market Attractiveness Analysis by Application
  • Figure 26: Latin America Market Value Share and BPS Analysis by Country, 2025 and 2035
  • Figure 27: Latin America Market Value Share and BPS Analysis by Classification , 2025 and 2035
  • Figure 28: Latin America Market Y to o to Y Growth Comparison by Classification , 2025-2035
  • Figure 29: Latin America Market Attractiveness Analysis by Classification
  • Figure 30: Latin America Market Value Share and BPS Analysis by Application, 2025 and 2035
  • Figure 31: Latin America Market Y to o to Y Growth Comparison by Application, 2025-2035
  • Figure 32: Latin America Market Attractiveness Analysis by Application
  • Figure 33: Western Europe Market Value Share and BPS Analysis by Country, 2025 and 2035
  • Figure 34: Western Europe Market Value Share and BPS Analysis by Classification , 2025 and 2035
  • Figure 35: Western Europe Market Y to o to Y Growth Comparison by Classification , 2025-2035
  • Figure 36: Western Europe Market Attractiveness Analysis by Classification
  • Figure 37: Western Europe Market Value Share and BPS Analysis by Application, 2025 and 2035
  • Figure 38: Western Europe Market Y to o to Y Growth Comparison by Application, 2025-2035
  • Figure 39: Western Europe Market Attractiveness Analysis by Application
  • Figure 40: Eastern Europe Market Value Share and BPS Analysis by Country, 2025 and 2035
  • Figure 41: Eastern Europe Market Value Share and BPS Analysis by Classification , 2025 and 2035
  • Figure 42: Eastern Europe Market Y to o to Y Growth Comparison by Classification , 2025-2035
  • Figure 43: Eastern Europe Market Attractiveness Analysis by Classification
  • Figure 44: Eastern Europe Market Value Share and BPS Analysis by Application, 2025 and 2035
  • Figure 45: Eastern Europe Market Y to o to Y Growth Comparison by Application, 2025-2035
  • Figure 46: Eastern Europe Market Attractiveness Analysis by Application
  • Figure 47: East Asia Market Value Share and BPS Analysis by Country, 2025 and 2035
  • Figure 48: East Asia Market Value Share and BPS Analysis by Classification , 2025 and 2035
  • Figure 49: East Asia Market Y to o to Y Growth Comparison by Classification , 2025-2035
  • Figure 50: East Asia Market Attractiveness Analysis by Classification
  • Figure 51: East Asia Market Value Share and BPS Analysis by Application, 2025 and 2035
  • Figure 52: East Asia Market Y to o to Y Growth Comparison by Application, 2025-2035
  • Figure 53: East Asia Market Attractiveness Analysis by Application
  • Figure 54: South Asia and Pacific Market Value Share and BPS Analysis by Country, 2025 and 2035
  • Figure 55: South Asia and Pacific Market Value Share and BPS Analysis by Classification , 2025 and 2035
  • Figure 56: South Asia and Pacific Market Y to o to Y Growth Comparison by Classification , 2025-2035
  • Figure 57: South Asia and Pacific Market Attractiveness Analysis by Classification
  • Figure 58: South Asia and Pacific Market Value Share and BPS Analysis by Application, 2025 and 2035
  • Figure 59: South Asia and Pacific Market Y to o to Y Growth Comparison by Application, 2025-2035
  • Figure 60: South Asia and Pacific Market Attractiveness Analysis by Application
  • Figure 61: Middle East & Africa Market Value Share and BPS Analysis by Country, 2025 and 2035
  • Figure 62: Middle East & Africa Market Value Share and BPS Analysis by Classification , 2025 and 2035
  • Figure 63: Middle East & Africa Market Y to o to Y Growth Comparison by Classification , 2025-2035
  • Figure 64: Middle East & Africa Market Attractiveness Analysis by Classification
  • Figure 65: Middle East & Africa Market Value Share and BPS Analysis by Application, 2025 and 2035
  • Figure 66: Middle East & Africa Market Y to o to Y Growth Comparison by Application, 2025-2035
  • Figure 67: Middle East & Africa Market Attractiveness Analysis by Application
  • Figure 68: Global Market - Tier Structure Analysis
  • Figure 69: Global Market - Company Share Analysis

Frequently Asked Questions

How big is the grating indicator calibrator market in 2025?

The global grating indicator calibrator market is estimated to be valued at USD 395.4 million in 2025.

What will be the size of grating indicator calibrator market in 2035?

The market size for the grating indicator calibrator market is projected to reach USD 675.4 million by 2035.

How much will be the grating indicator calibrator market growth between 2025 and 2035?

The grating indicator calibrator market is expected to grow at a 5.5% CAGR between 2025 and 2035.

What are the key product types in the grating indicator calibrator market?

The key product types in grating indicator calibrator market are fully automatic, semi-automatic and manual.

Which application segment to contribute significant share in the grating indicator calibrator market in 2025?

In terms of application, metrology and testing segment to command 42.0% share in the grating indicator calibrator market in 2025.

Explore Similar Insights

Future Market Insights

Grating Indicator Calibrator Market

Chat With MaRIA

Chat With

MaRIA

Hi There, I am MaRIA, Your Market Research Intelligence Assistant. How may I help you?