

- Market Size (2026)
- USD 530.0 Mn
- Forecast (2036)
- USD 1154.9 Mn
- CAGR (2026 to 2036)
- 8.1%
How big is the Gut Barrier Additives Market in 2026?
USD 530.0 million in 2026 and USD 1,154.9 million by 2036 at an 8.1% CAGR.
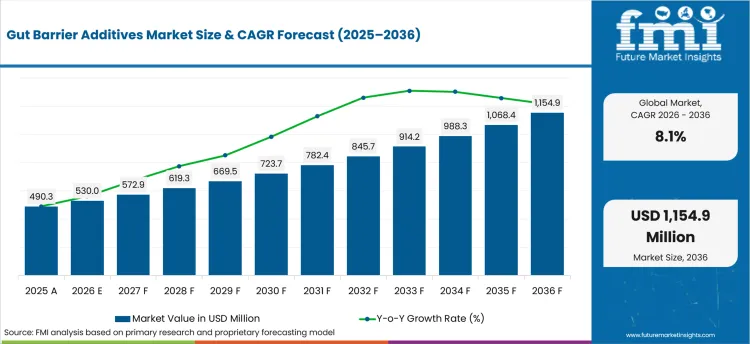
Demand for gut barrier additives is projected to expand at 8.1% CAGR between 2026 and 2036. Valuation is estimated to rise from USD 530.0 million in 2026 to USD 1,154.9 million by 2036. Feed formulators are expected to use gut-focused additives when variable grains disturb intake and nutrient use. The same pressure is visible across animal feed demand because diet efficiency carries more weight when ingredient costs move. FAO reported in July 2025 that 33% of cereals are projected to enter animal feed by 2034. A feed base of that scale is expected to keep gut stability tied to formulation economics.
China and India are projected to favor gut barrier programs that fit high-throughput poultry and dairy feeding because livestock output keeps expanding. United States and German feed formulators are expected to stress registration files and dose consistency during mill approval. Nutritionists compare strain identity and pelleting tolerance before routine use, while procurement teams review species evidence and shelf life across compound feed formulations. China’s State Council reported in March 2025 that grain output reached 706.5 million tonnes during 2024. The input base is expected to keep additive decisions tied to feed efficiency and ingredient risk. Approval is anticipated to turn on whether a product survives mill processing and produces repeatable species evidence.
| Metric | Value |
|---|---|
| 2025 Market Size | USD 490.3 million |
| 2026 Market Size | USD 530.0 million |
| 2036 Market Size | USD 1,154.9 million |
| Forecast CAGR (2026 to 2036) | 8.1% |
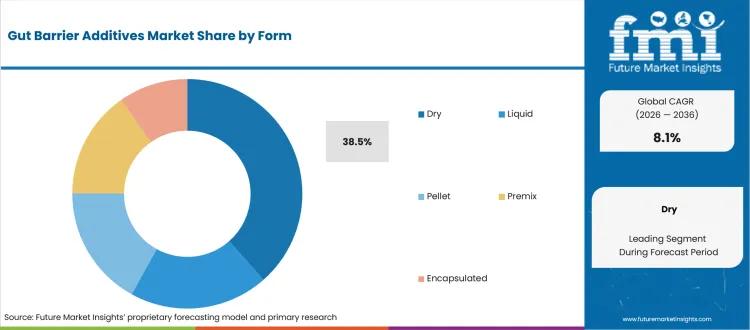
| Form Focus | Dry (38.5% share in 2026) |
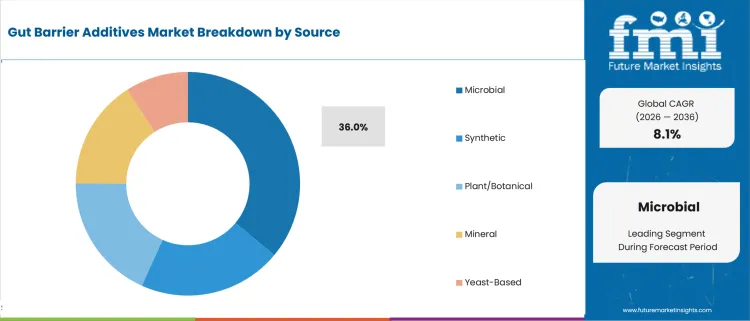
| Source Focus | Microbial (36.0% share in 2026) |
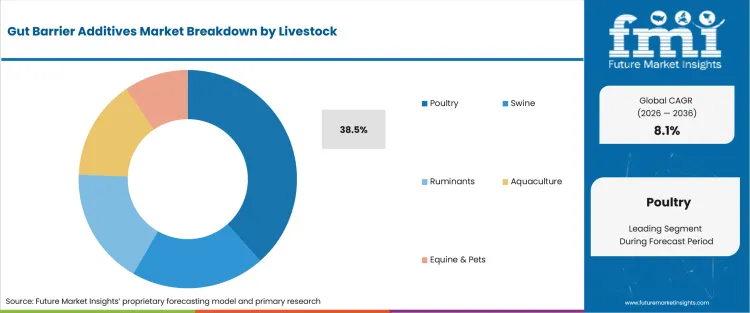
| Livestock Focus | Poultry (38.5% share in 2026) |
Summary of the Gut Barrier Additives Market
| Market Signal | Commercial Impact |
|---|---|
| Demand and Growth Drivers | Feed risk is expected to pull gut protection closer to routine diet design across commercial livestock programs. The commercial case starts with repeatable nutrient use when grain quality or mycotoxin pressure changes diet response.
|
| Product and Segment View | Dry formats are projected to remain practical for mills built around bagged micro-ingredients. Microbial sources and gut-health functions are expected to face closer proof requirements before routine commercial use.
|
| Geography and Growth Outlook | Asian feed systems are projected to emphasize production scale and nearby technical service. European and North American formulators are expected to place more weight on registration files and repeat dosing evidence.
|
| Competitive Landscape | Competition is projected to center on proof that survives feed processing and farm use. Portfolio breadth carries less weight when dose control or strain identity remains unclear during commercial review.
|
| Analyst Perspective | Pelleting is the first commercial gate for many gut barrier additives because an active that fails during processing cannot deliver the intended response in the animal. Commercial progress is expected to depend on process tolerance and species evidence that holds under routine feeding conditions.
|
Source: FMI's proprietary forecasting model and primary research
How is the gut barrier additives market segmented?
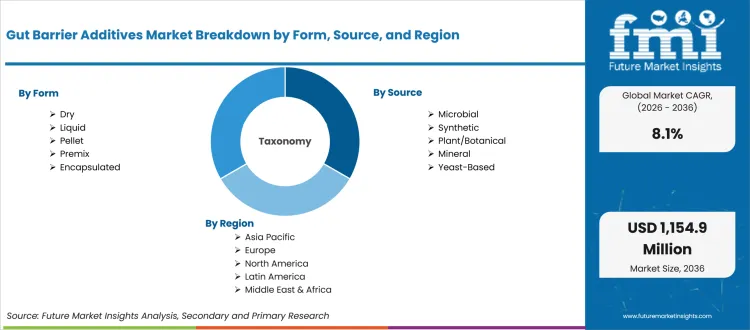
The gut barrier additives industry is segmented by form, source, livestock, function, and region.
The gut barrier additives industry is segmented by form, source, livestock, function, and region worldwide. Form covers dry, liquid, pellet, premix, and encapsulated products used across handling and dosing systems. Source includes synthetic, microbial, plant or botanical, mineral, and yeast-based additives that differ by origin and production route. Livestock coverage spans poultry, swine, ruminants, aquaculture, and equine or pet diets used across commercial feeding systems. Function tracks gut health, growth performance, immunity, nutrient utilization, and stress management across nutrition programs. Regional coverage spans North America, Europe, East Asia, South Asia, and Latin America while related feed premix categories show how formulators combine gut-focused inputs.
How does dry form shape demand within the form category?
Feed mills choose additive form around dosing equipment and storage practice because liquid handling adds cleaning work. Evonik added BoruCare Capsin to its ruminant portfolio in September 2025 after developing a standardized plant-based delivery format. The product is encapsulated in a fatty matrix after capsaicinoid content is standardized to at least 0.5%. Dry gut barrier additives are expected to fit plants that need repeatable micro-dosing without adding liquid tanks or pump cleaning.
- Based on form, dry additives are projected to account for 38.5% in 2026 due to familiar handling across premix and complete-feed lines. Trouw Nutrition presented feed safety tools at VIV Asia in February 2025 for farms and feed mills. That program links additive use to routine quality control instead of a separate farm treatment step.
- Dry formats are expected to draw demand from premix manufacturers due to easier storage and controlled addition at the mixer. Adisseo launched Sanion Tetra 50 in March 2026 as a protected sodium butyrate format for commercial feed applications. Comparable handling needs are visible in livestock programs that depend on natural additive formats during commercial mixed-feed production.
What supports demand for microbial sources within the source category?
Microbial additives enter procurement reviews through strain identity and process survival because commercial feed handling sometimes reduces biological activity. EFSA issued updated microorganism characterization guidance in November 2025 for products assessed across the food chain. Feed formulators therefore need a clear strain record before they compare dose or farm response. Microbial sources are expected to benefit when technical files show how viable cells withstand storage and feed processing.
- By source, microbial additives are estimated to hold 36.0% in 2026 due to targeted use of defined strains in species diets. EFSA’s July 2025 QPS update identified 25 microorganism notifications that related to feed additives during review. The review workload reinforces the need for strain-level evidence and clear production records during approval.
- Demand for microbial additives is expected to grow among poultry nutrition teams supported by faster activation and clearer strain data. Evonik reported in November 2025 that its updated Ecobiol probiotic achieved 46% faster outgrowth than the comparison products tested. Feed teams use similar comparative proof when reviewing animal feed probiotics for commercial rations across poultry and swine programs.
What drives poultry demand within the livestock category?
Poultry diets expose additive performance to short production cycles and frequent feed changes across tightly managed commercial flocks. Cargill reported in March 2025 that its mycotoxin research drew on more than 400,000 global feed analyses. The work linked DON exposure with disrupted poultry gut health and higher pathogen risk under contaminated feed conditions. Poultry nutrition teams are therefore expected to screen gut additives against ingredient risk and flock records before changing a diet program.
- In 2026, poultry is expected to lead livestock with 38.5% share because integrators run frequent diet changes and track feed conversion closely. EFSA concluded in April 2025 that a Bacillus feed additive was safe for poultry species used for laying and breeding. Species-level assessment keeps safety and efficacy evidence close to the intended production system before feed formulators approve routine use.
- Demand for poultry-focused additives is projected to grow among integrators due to short feedback cycles and close control of feed use. Alltech published broiler efficiency guidance in February 2025 that linked microbiome support with gut integrity and nutrient absorption. Similar evaluation logic is expected across poultry feed programs that compare additive response against flock performance.
How is gut health positioned within the function category?
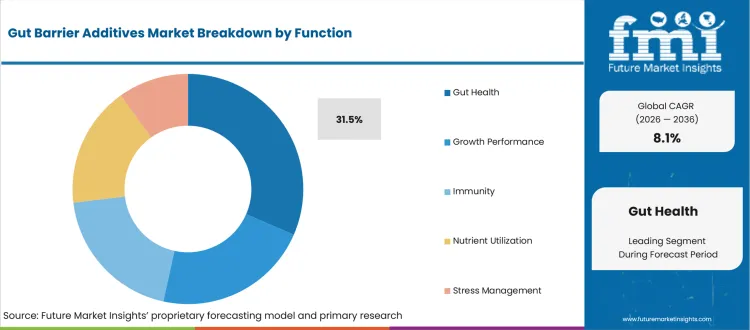
Gut health is the point where feed formulation meets barrier integrity and microbial balance inside commercial livestock diets. Cargill’s March 2026 Global Mycotoxin Report covered 389,926 analyses during its global feed risk review. The report kept feed contamination close to animal performance and intestinal risk during formulation planning across livestock species. Nutrition teams are expected to favor products that connect a clear active mechanism with feed conditions seen in commercial diets.
- By function, gut health is forecast to represent 31.5% in 2026 driven by the need to protect nutrient use during feed and environmental stress. Trouw Nutrition announced the launch of Presan Evolve at ICPIH in April 2026 for commercial broiler production under stress. The product program keeps intestinal resilience close to routine formulation work for poultry nutrition teams.
- Gut health additives are drawing attention from swine and poultry nutrition teams supported by efforts to manage intestinal stress without routine antibiotic reliance. Kemin’s May 2025 ESPHM program focused on microbiome management across pig production stages and practical intestinal health decisions. Formulators are expected to compare that evidence with feed phytogenic options and other gut-focused tools.
What are the drivers, restraints, and opportunities in the gut barrier additives market?
Feed-cost variability is projected to lift demand while inconsistent species evidence is anticipated to slow approval. Precision premix programs are expected to create expansion routes.
- Driver: Variable grain quality is expected to push feed formulators toward gut-focused additives that keep nutrient use more predictable across production cycles.
- Restraint: Inconsistent trial design across species is anticipated to slow approval because nutrition teams need repeatable endpoints before changing established diets.
- Opportunity: Precision premix programs are forecast to open feed-mill routes where additive dosing is tied to ingredient risk and species needs.
Contaminated or variable ingredients are expected to increase interest in additive tools among feed formulators facing repeated performance risk. Trouw Nutrition reported in February 2026 that zearalenone appeared in 62% of samples reviewed for its Global Mycotoxin Review. The exposure pattern is projected to keep gut barrier support close to feed safety planning. Formulators are expected to prefer products with clear dose guidance and a defined role inside the diet.
Regulatory review is anticipated to slow adoption when ingredient identity or production records remain incomplete during supplier approval. In January 2025, the USA FDA finalized Guidance for Industry #294 for its Animal Food Ingredient Consultation process. The interim consultation route keeps novel animal food ingredients tied to structured safety information before wider commercial use. Premix teams are expected to delay broad adoption when a product file does not match the organism or active format supplied.
Precision premix work is expected to turn the evidence burden into a service opportunity for feed mills and integrators. ADM and Alltech announced a North American animal feed joint venture in September 2025 across their regional feed businesses. The planned combination brings feed-mill networks and nutrition expertise into one operating platform for commercial customers. Similar integration is expected to influence novel feed additives when formulators need technical support beside the product. Feed companies are projected to reward clear testing plans and practical mill support during supplier review and scale-up.
Which country CAGRs are profiled in the gut barrier additives market?
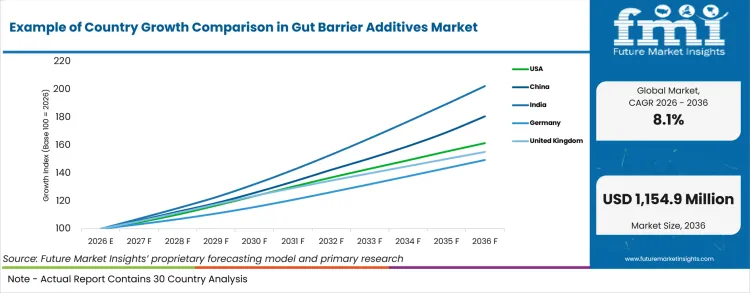
| Country | CAGR |
|---|---|
| United States | 4.9% |
| China | 6.1% |
| India | 7.3% |
| Germany | 4.1% |
| United Kingdom | 4.5% |
| Japan | 3.5% |
| South Korea | 4.7% |
Source: FMI's proprietary forecasting model and primary research
How do country-level CAGRs compare in the gut barrier additives market?
Country growth is expected to reflect livestock intensity and the way feed additives are approved inside each production system. India and China are projected to favor scale-ready products with local technical access near major livestock production clusters. United States and European formulators are anticipated to stress records that support repeat dosing and species claims. The OECD’s July 2025 outlook projected Asia to account for 55% of global meat production growth through 2034. The regional shift is expected to raise formulation work near poultry and swine production centers while documentation remains central elsewhere.
- United States broiler integrators entered 2026 with close feed-cost scrutiny and another year of heavy production. The United States is projected to grow at 4.9% CAGR through 2036 due to recurring poultry trials and strict feed documentation. USDA NASS reported live-weight broiler production of 62.2 billion pounds during 2025 in its April 2026 summary. Feed-mill teams are expected to connect additive trials with farm records across integrated complexes before wider product scale-up. The FDA Center for Veterinary Medicine remains a local reference point for feed additive submissions and label controls. Formulators are expected to keep switching decisions tied to pelleting stability and repeatable farm evidence before scaling a new additive.
- Data released by China’s National Bureau of Statistics in February 2025 placed poultry output at 26.60 million tons during 2024. Gut barrier additive demand in China is forecast to rise at 6.1% CAGR through 2036 supported by intensive poultry production and large feed runs. The production base is expected to create recurring needs for ingredient screening and stable dosing. The Ministry of Agriculture and Rural Affairs shapes feed policy while local integrators control large commercial trials. Domestic feed groups are projected to value technical support near production clusters because process changes need quick mill feedback. The commercial question is expected to center on whether local service keeps batch quality stable during scale-up.
- Official November 2025 data from India’s Department of Animal Husbandry and Dairying put egg production at 149.11 billion units during 2024-25. The scale is expected to keep poultry nutrition teams focused on feed conversion and flock resilience. India is estimated to post 7.3% CAGR over the forecast period due to expanding commercial poultry and dairy nutrition programs. Integrators in Andhra Pradesh and Telangana are projected to compare strain evidence with farm service reach. Product teams are also expected to review animal feed prebiotics beside microbial and acid-based tools during formulation work. Vendor selection is anticipated to reward companies that support field trials without adding complex data capture.
- Germany entered 2026 with feed-input wholesale prices below their year-earlier level, changing the cost baseline for ration planning. Feed formulators are expected to recalculate additive returns when ingredient prices change commercial diet economics. Germany is projected to record 4.1% CAGR during the assessment period supported by strict feed documentation and established compound-feed use. Destatis reported in March 2026 that the wholesale category covering grain and animal feeds was 7.4% below the February 2025 level. Evonik and German feed associations keep technical debate close to feed efficiency and product evidence. Formulators are expected to compare dose cost against measurable response instead of relying on broad gut-health claims across commercial accounts.
- United Kingdom feed mills increased compound feed output while input prices moved in different directions during 2025. Defra reported in June 2026 that Great Britain’s compound feed output increased by 221 kilotonnes during 2025. United Kingdom nutrition teams are expected to use that operating base for repeatable trials across poultry and pig diets. The United Kingdom is anticipated to advance at 4.5% CAGR over the assessment period supported by feed safety controls and active premix channels. The Food Standards Agency remains central to feed regulation and business guidance across feed manufacturers and importers. Additive companies are projected to gain account access when technical files are clear and local service fits mill audit routines.
- MAFF data published in June 2026 showed feed crop planting area at 905 thousand hectares for 2025. The domestic feed base is expected to keep nutrition teams sensitive to imported ingredient quality and ration cost. MAFF remains the central local actor for feed policy and livestock supply conditions across the country’s production systems. Adoption of gut barrier additives in Japan is estimated to expand at 3.5% CAGR through 2036 supported by careful diet validation and established feed manufacturing practice. Japanese formulators are projected to favor products with stable shelf life and clear species evidence. Commercial progress in Japan is expected to depend on patient technical support during controlled feeding trials and supplier qualification.
- South Korea’s food export program is expanding the commercial context around poultry production and veterinary inputs. MAFRA recorded chicken meat product exports of USD 26.7 million during the first quarter of 2025 in its April 2025 release. Export-oriented processors are expected to keep quality consistency close to feed and farm management under commercial export contracts. The ministry also shapes livestock and agri-food policy through national programs that affect feed businesses and processors. South Korea is forecast to post 4.7% CAGR over the forecast period supported by concentrated poultry networks and quick technical feedback. Feed companies are projected to favor additive partners that combine strain evidence with local troubleshooting across integrated production systems.
Who are the notable companies in the gut barrier additives market?
Cargill, ADM, Evonik, Kemin Industries, Alltech, Novonesis, Adisseo, and Trouw Nutrition (Nutreco) are the notable companies shaping this market.
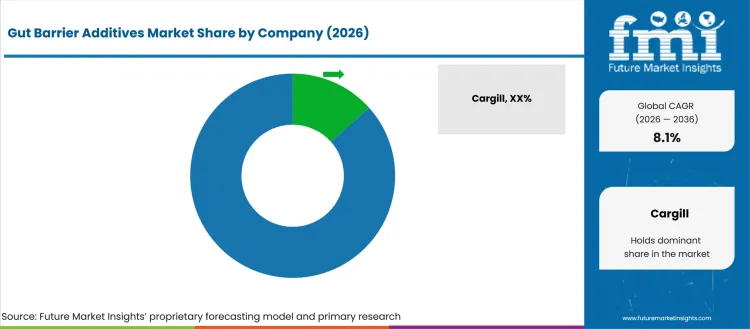
Competition is projected to center on evidence that survives mill processing and farm conditions across repeat commercial production cycles. Feed formulators compare strain identity and active dose before looking at service reach and support for commercial use. Process tolerance is expected to separate products that perform after pelleting from claims based only on laboratory work. EFSA updated its administrative guidance for feed additive applications in November 2025, keeping dossier preparation and review steps visible during supplier comparison. Integrated groups are anticipated to compete through premix access while specialists build depth around gut function. Related eubiotic solution portfolios are expected to keep the competitive focus on defined mechanisms and practical formulation support.
Cargill and ADM compete from integrated nutrition positions that connect formulation work with feed manufacturing and research. Cargill brings broad premix access while ADM adds fermentation-derived biotics and microbiome research for livestock nutrition programs. Commercial differentiation is expected to come from mill-ready use instructions that turn science into consistent production practice.
Biological depth gives Evonik and Novonesis a different route into feed accounts across poultry and swine systems. Evonik combines probiotics with poultry nutrition services while Novonesis controls enzyme and microbial development platforms. Both are projected to compete through strain evidence and technical support across species and regions.
Kemin Industries and Alltech compete through gut health programs that reach poultry and swine production teams. Their portfolios include microbial and yeast-based approaches beside feed safety tools for commercial livestock production systems. Account progress is expected to rely on trial support that links diet changes with farm records.
Adisseo and Trouw Nutrition combine functional additives with close access to feed formulation teams across commercial livestock programs. Adisseo brings protected butyrate formats while Trouw links premix service with feed safety programs for commercial customers. Both are anticipated to compete where customers need product support across mill and farm workflows.
Competitive Benchmarking: Gut Barrier Additives Market
| Company | Gut-Health Portfolio Fit | Species Coverage | Specification Support | Service Reach |
|---|---|---|---|---|
| Cargill | High | Global | High | Global |
| ADM | High | Global | High | Global |
| Evonik | High | Global | High | Global |
| Kemin Industries | High | Global | High | Global |
| Alltech | High | Global | High | Global |
| Novonesis | Strong | Global | High | Global |
| Adisseo | High | Global | High | Global |
| Trouw Nutrition (Nutreco) | High | Global | High | Global |
Source: Future Market Insights competitive analysis, 2026. Ratings reflect relative portfolio relevance and workflow fit. Service capability and geographic reach shape the remaining comparison.
Key Developments in the Gut Barrier Additives Market
- In June 2025, ADM opened a research center in Lausanne dedicated to animal health and microbiome work. The site supports pre-clinical research using biotics and fermentation-derived ingredients for livestock and companion animals.
- In June 2025, Novonesis completed the acquisition of dsm-firmenich’s share of the Feed Enzyme Alliance after receiving regulatory approvals. The transaction gave Novonesis control across development and delivery of feed enzyme products for customers in worldwide feed markets.
- In November 2025, Cargill expanded micronutrition production at its Engerwitzdorf site in Austria to serve European feed customers. The project added silo capacity and raised the plant’s ability to serve premix and feed customers.
- In September 2025, Kemin Industries obtained an enzymes and fermentation facility in Jining through a strategic acquisition. Kemin later described the site during its June 2026 Global Feed Enzymes Internal Summit report.
Key Players in the Gut Barrier Additives Market
Integrated Feed and Nutrition Groups
- Cargill
- ADM
- Trouw Nutrition (Nutreco)
Biological and Functional Additive Specialists
- Evonik
- Kemin Industries
- Alltech
- Novonesis
- Adisseo
Gut Barrier Additives Market - Report Scope
| Coverage field | Report scope |
|---|---|
| Market breakdown | By Form, Source, Livestock, Function, and Region |
| Market Definition | Feed additives formulated to support intestinal barrier integrity and microbial balance across livestock and aquaculture diets. |
| Regions Covered | North America, Europe, East Asia, South Asia, Latin America, Oceania, and Middle East and Africa |
| Countries Covered | United States, China, India, Germany, United Kingdom, Japan, South Korea, and 30+ countries |
| Key Companies Profiled | Cargill, ADM, Evonik, Kemin Industries, Alltech, Novonesis, Adisseo, and Trouw Nutrition (Nutreco) |
| Forecast Period | 2026 to 2036 |
| Approach | Hybrid methodology using bottom-up demand checks and top-down reconciliation across segments and countries |
Source: Future Market Insights - analysis driven by proprietary forecasting models and primary research
Gut Barrier Additives Market - Research Methodology
| Method | Approach |
|---|---|
| Primary Research | FMI analysts interview feed formulators and premix manufacturers who evaluate gut-focused additives in commercial diets. Discussions cover dosing practice and species evidence before wider purchasing decisions. Analysts compare responses across technical roles and commercial feed uses to test whether stated adoption barriers reflect routine mill and farm work. |
| Desk Research | Desk research reviews feed regulation and livestock production conditions that shape the use of gut-focused additives. Analysts examine official product portfolios and company disclosures beside country feed indicators. Findings are used to test sourcing pressure and documentation needs without replacing primary interviews or internal demand checks. |
| Market Sizing and Forecasting | The model starts with a validated value baseline and applies bottom-up demand checks across form and source categories. Livestock use and function categories are reconciled against country growth assumptions. Analysts test the result against supplier reach and feed production signals before accepting the final market path. |
| Data Validation | FMI validates the forecast through triangulation between primary interviews and official evidence. Segment shares are checked against formulation practice and company portfolio fit. Country growth patterns are reviewed beside separate feed and livestock indicators before final values are reconciled for mathematical consistency and direct market relevance. |
Source: Future Market Insights (FMI) analysis, based on proprietary forecasting model and primary research
Gut Barrier Additives Market by Segments
Gut Barrier Additives Market segmented by Form:
- Dry
- Liquid
- Pellet
- Premix
- Encapsulated
Gut Barrier Additives Market segmented by Source:
- Synthetic
- Microbial
- Plant/Botanical
- Mineral
- Yeast-Based
Gut Barrier Additives Market segmented by Livestock:
- Poultry
- Swine
- Ruminants
- Aquaculture
- Equine & Pets
Gut Barrier Additives Market segmented by Function:
- Gut Health
- Growth Performance
- Immunity
- Nutrient Utilization
- Stress Management
Gut Barrier Additives Market by Region:
- North America
- United States
- Canada
- Latin America
- Brazil
- Mexico
- Argentina
- Europe
- Germany
- United Kingdom
- France
- Italy
- Spain
- East Asia
- China
- Japan
- South Korea
- South Asia
- India
- Bangladesh
- Sri Lanka
- Oceania
- Australia
- New Zealand
- Middle East and Africa
- GCC Countries
- South Africa
- Türkiye
Research Sources and Bibliography
- Food and Agriculture Organization of the United Nations. (2025, July 15). OECD-FAO Agricultural Outlook 2025-2034: Emerging economies will drive growth in animal-source food consumption and production. FAO.
- Organisation for Economic Co-operation and Development. (2025, July). Meat: OECD-FAO Agricultural Outlook 2025-2034. OECD.
- International Feed Industry Federation. (2025, September). IFIF Fact Sheet. IFIF.
- European Food Safety Authority. (2025, April 16). Safety and efficacy of a feed additive consisting of Bacillus velezensis ATCC PTA-6737 for laying hens and other birds kept for egg production or breeding. EFSA Journal.
- European Food Safety Authority. (2025, July 7). Update of the list of qualified presumption of safety recommended microbiological agents intentionally added to food or feed as notified to EFSA 22: Suitability of taxonomic units notified to EFSA until March 2025. EFSA Journal.
- European Food Safety Authority. (2025, November 4). Guidance on the characterisation of microorganisms in products subject to assessment by EFSA. EFSA Journal.
- USA Food and Drug Administration. (2025, January 6). CVM GFI #294 - Animal Food Ingredient Consultation (AFIC). FDA.
- European Food Safety Authority. (2025, November 27). Feed additives application procedure. EFSA.
- State Council of the People’s Republic of China. (2025, March 30). China unveils plan to turn permanent basic farmland into high-standard farmland. State Council.
- USA Department of Agriculture National Agricultural Statistics Service. (2026, April 30). Poultry - Production and Value 2025 Summary. USDA.
- National Bureau of Statistics of China. (2025, February 28). Statistical communiqué of the People’s Republic of China on the 2024 national economic and social development. NBS.
- Press Information Bureau, Government of India. (2025, November 26). Release of Basic Animal Husbandry Statistics 2025 on the Occasion of National Milk Day 2025. PIB.
- Federal Statistical Office of Germany. (2026, March 13). Wholesale prices in February 2026: +1.2% on February 2025. Destatis.
- Department for Environment, Food & Rural Affairs. (2026, June 30). Total income from farming in the UK in 2025. GOV.UK.
- Ministry of Agriculture, Forestry and Fisheries. (2026, June 11). 飼料をめぐる情勢 [Situation surrounding feed]. MAFF.
- Ministry of Agriculture, Food and Rural Affairs. (2025, April 7). Exports of K-Food Plus in Q1 of 2025: USD 3.18 billion, up by 7.9% from the Previous Year. MAFRA.
- Cargill. (2025, March 24). Cargill Animal Nutrition & Health Presents New Insights on Mycotoxins and Poultry Gut Health. Cargill.
- Cargill. (2025, November 4). Cargill Animal Nutrition & Health Increases Micronutrition Production Capacity to Meet Growing Customer Demand. Cargill.
- Cargill. (2026, March 11). Cargill Micronutrition & Health Solutions Publishes 2025 Global Mycotoxin Report Highlighting Persistent Performance Risks in Animal Production. Cargill.
- ADM. (2025, June 19). ADM Opens Pioneering R&D Center Dedicated to Animal Health and Wellness. ADM.
- Novonesis. (2025, June 2). Deal to acquire dsm-firmenich’s share of the Feed Enzyme Alliance is completed, supporting Novonesis’ growth strategy. Novonesis.
- Evonik. (2025, November 24). Evonik to showcase enhanced Ecobiol® probiotic at Poultry India 2025. Evonik.
- Kemin Industries. (2025, May 12). Kemin, Gold Sponsor of ESPHM 2025. Kemin Industries.
- Alltech. (2025, February 4). Improving broiler poultry efficiency and driving sustainable chicken production. Alltech.
- Adisseo. (2026, March 2). Adisseo Expands Butyrate Portfolio with Sanion Tetra. Adisseo.
- Trouw Nutrition. (2025, February 18). Trouw Nutrition shares innovations for Feeding the Future sustainably and safely at VIV Asia. Trouw Nutrition.
- Trouw Nutrition. (2026, April). ICPIH 2026. Trouw Nutrition.
- Evonik. (2025, September 15). Evonik adds plant-based product BoruCare® Capsin to its portfolio for ruminants. Evonik.
- Alltech. (2025, September 23). ADM, Alltech to bring together unparalleled expertise and experience in new North American animal feed joint venture. Alltech.
- Kemin Industries. (2026, June 8). Global Feed Enzymes Internal Summit Showcases our One Kemin Approach. Kemin Industries.
- Trouw Nutrition. (2026, February 5). Global Mycotoxin Review 2026. Trouw Nutrition.
This bibliography is provided for reader reference and uses primary government, standards-body, official trade body, and company sources.
This Report Answers
- What is the estimated Gut Barrier Additives Market value in 2026 and 2036?
- What CAGR is projected for the Gut Barrier Additives Market from 2026 to 2036?
- Which form, source, livestock, and function segments are projected to shape demand?
- Which feed-cost pressures and raw-material risks are expected to support additive adoption?
- How are country CAGRs projected to differ across the profiled markets?
- Which companies compete across portfolio depth, species evidence, technical support, and service reach?
- How does FMI validate forecasts using bottom-up demand checks and top-down reconciliation?
- What should feed formulators and integrators address before broader sourcing commitments?
- How do claims review and feed regulation affect documentation demands during vendor selection?
Frequently Asked Questions
What is driving growth in the Gut Barrier Additives Market?
Demand is projected to rise as feed formulators manage grain variation and intestinal stress more closely. Species-level trials are expected to support broader commercial use.
Who are the key players in the Gut Barrier Additives Market?
Key players include Cargill, ADM, Evonik, Kemin Industries, Alltech, Novonesis, Adisseo, and Trouw Nutrition. Competition is projected to center on species evidence and mill-level technical support.
What is a significant restraint in the Gut Barrier Additives Market?
Adoption is anticipated to slow where feed trials use inconsistent endpoints across species. Long approval cycles are expected to delay supplier switching.
Why should executives track the Gut Barrier Additives Market?
Executives should track the category because gut-health programs affect feed efficiency and formulation risk. Product selection is expected to shape trial costs and repeat purchasing.
What business problem does the Gut Barrier Additives Market address?
The category addresses unstable nutrient use when feed quality or intestinal stress changes animal response. Products are expected to support more repeatable diet performance.
What should procurement leaders evaluate before selecting suppliers?
Procurement leaders should compare strain identity and processing tolerance before wider sourcing. They should also review species evidence and local technical support.
What limits return on investment for feed formulators?
Returns are estimated to weaken when trial design is unclear or processing damages the active ingredient. Poor dose control is expected to increase reformulation work.
How do suppliers build long-term account confidence?
Suppliers build confidence by connecting product evidence with feed-mill conditions and farm records. Repeat business is expected to depend on clear dosing and credible technical support.
Preview the report firsthand - request a free sample
Get SampleGet the brochure for pricing and purchase details.
Get PDFTable of Content
- Key Takeaways
- Market Size and CAGR
- Top Growth Driver
- Fastest Growing Segment
- Leading Region
- Key Companies
- Emerging Opportunities
- Executive Summary
- Global Market Outlook
- Demand-side Trends
- Supply-side Trends
- Technology Roadmap Analysis
- Analysis and Recommendations
- Analyst Perspective (What is happening? Why now? What should investors know?)
- Key Questions Answered
- How large is the market?
- What is the CAGR?
- What are key trends?
- Which region dominates?
- Who are the leaders?
- Market Overview
- Market Coverage / Taxonomy
- Market Definition / Scope / Limitations
- Research Methodology
- Chapter Orientation
- Analytical Lens and Working Hypotheses
- Market Structure, Signals, and Trend Drivers
- Benchmarking and Cross-market Comparability
- Market Sizing, Forecasting, and Opportunity Mapping
- Research Design and Evidence Framework
- Desk Research Programme (Secondary Evidence)
- Expert Input and Fieldwork (Primary Evidence)
- Tooling, Models, and Reference Databases
- Data Engineering and Model Build
- Quality Assurance and Audit Trail
- Market Background
- Market Dynamics (Drivers, Restraints, Opportunity, Trends)
- Scenario Forecast (Optimistic, Likely, Conservative)
- Impact Analysis
- AI Impact
- Sustainability Impact
- Regulatory Impact
- Technology Impact
- Consumer / Buyer Analysis
- Purchase Drivers
- Adoption Barriers
- Buyer Journey
- Opportunity Map Analysis
- Product Life Cycle Analysis
- Supply Chain Analysis
- Investment Feasibility Matrix
- Value Chain Analysis
- PESTLE and Porter's Analysis
- Regulatory Landscape
- Regional Parent Market Outlook
- Production and Consumption Statistics
- Import and Export Statistics
- Global Market Analysis and Forecast, 2021 to 2036
- Historical Market Size Value (USD Million) Analysis, 2021 to 2025
- Current and Future Market Size Value (USD Million) Projections, 2026 to 2036
- Y-o-Y Growth Trend Analysis
- Absolute $ Opportunity Analysis
- Global Market Pricing Analysis, 2021 to 2036
- Global Market Analysis and Forecast, By Form, 2021 to 2036
- Introduction / Key Findings
- Historical Market Size Value (USD Million) Analysis By Form, 2021 to 2025
- Current and Future Market Size Value (USD Million) Analysis and Forecast By Form, 2026 to 2036
- Dry
- Liquid
- Pellet
- Premix
- Encapsulated
- Dry
- Y-o-Y Growth Trend Analysis By Form, 2021 to 2025
- Absolute $ Opportunity Analysis By Form, 2026 to 2036
- Global Market Analysis and Forecast, By Source, 2021 to 2036
- Introduction / Key Findings
- Historical Market Size Value (USD Million) Analysis By Source, 2021 to 2025
- Current and Future Market Size Value (USD Million) Analysis and Forecast By Source, 2026 to 2036
- Microbial
- Synthetic
- Plant/Botanical
- Mineral
- Yeast-Based
- Microbial
- Y-o-Y Growth Trend Analysis By Source, 2021 to 2025
- Absolute $ Opportunity Analysis By Source, 2026 to 2036
- Global Market Analysis and Forecast, By Livestock, 2021 to 2036
- Introduction / Key Findings
- Historical Market Size Value (USD Million) Analysis By Livestock, 2021 to 2025
- Current and Future Market Size Value (USD Million) Analysis and Forecast By Livestock, 2026 to 2036
- Poultry
- Swine
- Ruminants
- Aquaculture
- Equine & Pets
- Poultry
- Y-o-Y Growth Trend Analysis By Livestock, 2021 to 2025
- Absolute $ Opportunity Analysis By Livestock, 2026 to 2036
- Global Market Analysis and Forecast, By Function, 2021 to 2036
- Introduction / Key Findings
- Historical Market Size Value (USD Million) Analysis By Function, 2021 to 2025
- Current and Future Market Size Value (USD Million) Analysis and Forecast By Function, 2026 to 2036
- Gut Health
- Growth Performance
- Immunity
- Nutrient Utilization
- Stress Management
- Gut Health
- Y-o-Y Growth Trend Analysis By Function, 2021 to 2025
- Absolute $ Opportunity Analysis By Function, 2026 to 2036
- Global Market Analysis and Forecast, By Region, 2021 to 2036
- Introduction
- Historical Market Size Value (USD Million) Analysis By Region, 2021 to 2025
- Current Market Size Value (USD Million) Analysis and Forecast By Region, 2026 to 2036
- North America
- Latin America
- Western Europe
- Eastern Europe
- East Asia
- South Asia and Pacific
- Middle East & Africa
- Market Attractiveness Analysis By Region
- North America Market Analysis and Forecast, By Country, 2021 to 2036
- Historical Market Size Value (USD Million) Trend Analysis By Market Taxonomy, 2021 to 2025
- Market Size Value (USD Million) Forecast By Market Taxonomy, 2026 to 2036
- By Country
- USA
- Canada
- By Form
- By Source
- By Livestock
- By Function
- By Country
- Market Attractiveness Analysis
- By Country
- By Form
- By Source
- By Livestock
- By Function
- Key Takeaways
- Latin America Market Analysis and Forecast, By Country
- Historical Market Size Value (USD Million) Trend Analysis By Market Taxonomy, 2021 to 2025
- Market Size Value (USD Million) Forecast By Market Taxonomy, 2026 to 2036
- By Country
- Brazil
- Mexico
- Chile
- Rest of Latin America
- By Form
- By Source
- By Livestock
- By Function
- By Country
- Market Attractiveness Analysis
- By Country
- By Form
- By Source
- By Livestock
- By Function
- Key Takeaways
- Western Europe Market Analysis and Forecast, By Country
- Historical Market Size Value (USD Million) Trend Analysis By Market Taxonomy, 2021 to 2025
- Market Size Value (USD Million) Forecast By Market Taxonomy, 2026 to 2036
- By Country
- Germany
- UK
- Italy
- Spain
- France
- Nordic
- BENELUX
- Rest of Western Europe
- By Form
- By Source
- By Livestock
- By Function
- By Country
- Market Attractiveness Analysis
- By Country
- By Form
- By Source
- By Livestock
- By Function
- Key Takeaways
- Eastern Europe Market Analysis and Forecast, By Country
- Historical Market Size Value (USD Million) Trend Analysis By Market Taxonomy, 2021 to 2025
- Market Size Value (USD Million) Forecast By Market Taxonomy, 2026 to 2036
- By Country
- Russia
- Poland
- Hungary
- Balkan & Baltic
- Rest of Eastern Europe
- By Form
- By Source
- By Livestock
- By Function
- By Country
- Market Attractiveness Analysis
- By Country
- By Form
- By Source
- By Livestock
- By Function
- Key Takeaways
- East Asia Market Analysis and Forecast, By Country
- Historical Market Size Value (USD Million) Trend Analysis By Market Taxonomy, 2021 to 2025
- Market Size Value (USD Million) Forecast By Market Taxonomy, 2026 to 2036
- By Country
- China
- Japan
- South Korea
- By Form
- By Source
- By Livestock
- By Function
- By Country
- Market Attractiveness Analysis
- By Country
- By Form
- By Source
- By Livestock
- By Function
- Key Takeaways
- South Asia and Pacific Market Analysis and Forecast, By Country
- Historical Market Size Value (USD Million) Trend Analysis By Market Taxonomy, 2021 to 2025
- Market Size Value (USD Million) Forecast By Market Taxonomy, 2026 to 2036
- By Country
- India
- ASEAN
- Australia & New Zealand
- Rest of South Asia and Pacific
- By Form
- By Source
- By Livestock
- By Function
- By Country
- Market Attractiveness Analysis
- By Country
- By Form
- By Source
- By Livestock
- By Function
- Key Takeaways
- Middle East & Africa Market Analysis and Forecast, By Country
- Historical Market Size Value (USD Million) Trend Analysis By Market Taxonomy, 2021 to 2025
- Market Size Value (USD Million) Forecast By Market Taxonomy, 2026 to 2036
- By Country
- Kingdom of Saudi Arabia
- Other GCC Countries
- Türkiye
- South Africa
- Other African Union
- Rest of Middle East & Africa
- By Form
- By Source
- By Livestock
- By Function
- By Country
- Market Attractiveness Analysis
- By Country
- By Form
- By Source
- By Livestock
- By Function
- Key Takeaways
- Key Countries Market Analysis
- USA
- Pricing Analysis
- Market Share Analysis, 2025
- By Form
- By Source
- By Livestock
- By Function
- Canada
- Pricing Analysis
- Market Share Analysis, 2025
- By Form
- By Source
- By Livestock
- By Function
- Mexico
- Pricing Analysis
- Market Share Analysis, 2025
- By Form
- By Source
- By Livestock
- By Function
- Brazil
- Pricing Analysis
- Market Share Analysis, 2025
- By Form
- By Source
- By Livestock
- By Function
- Chile
- Pricing Analysis
- Market Share Analysis, 2025
- By Form
- By Source
- By Livestock
- By Function
- Germany
- Pricing Analysis
- Market Share Analysis, 2025
- By Form
- By Source
- By Livestock
- By Function
- UK
- Pricing Analysis
- Market Share Analysis, 2025
- By Form
- By Source
- By Livestock
- By Function
- Italy
- Pricing Analysis
- Market Share Analysis, 2025
- By Form
- By Source
- By Livestock
- By Function
- Spain
- Pricing Analysis
- Market Share Analysis, 2025
- By Form
- By Source
- By Livestock
- By Function
- France
- Pricing Analysis
- Market Share Analysis, 2025
- By Form
- By Source
- By Livestock
- By Function
- India
- Pricing Analysis
- Market Share Analysis, 2025
- By Form
- By Source
- By Livestock
- By Function
- ASEAN
- Pricing Analysis
- Market Share Analysis, 2025
- By Form
- By Source
- By Livestock
- By Function
- Australia & New Zealand
- Pricing Analysis
- Market Share Analysis, 2025
- By Form
- By Source
- By Livestock
- By Function
- China
- Pricing Analysis
- Market Share Analysis, 2025
- By Form
- By Source
- By Livestock
- By Function
- Japan
- Pricing Analysis
- Market Share Analysis, 2025
- By Form
- By Source
- By Livestock
- By Function
- South Korea
- Pricing Analysis
- Market Share Analysis, 2025
- By Form
- By Source
- By Livestock
- By Function
- Russia
- Pricing Analysis
- Market Share Analysis, 2025
- By Form
- By Source
- By Livestock
- By Function
- Poland
- Pricing Analysis
- Market Share Analysis, 2025
- By Form
- By Source
- By Livestock
- By Function
- Hungary
- Pricing Analysis
- Market Share Analysis, 2025
- By Form
- By Source
- By Livestock
- By Function
- Kingdom of Saudi Arabia
- Pricing Analysis
- Market Share Analysis, 2025
- By Form
- By Source
- By Livestock
- By Function
- Türkiye
- Pricing Analysis
- Market Share Analysis, 2025
- By Form
- By Source
- By Livestock
- By Function
- South Africa
- Pricing Analysis
- Market Share Analysis, 2025
- By Form
- By Source
- By Livestock
- By Function
- USA
- Market Structure Analysis
- Competition Dashboard
- Competition Benchmarking
- Market Share Analysis of Top Players
- By Regional
- By Form
- By Source
- By Livestock
- By Function
- Emerging Startups
- Innovation Benchmarking
- Competition Analysis
- Competition Deep Dive
- Cargill
- Overview
- Product Portfolio
- Profitability by Market Segments
- Sales Footprint
- Strategy Overview
- Marketing Strategy
- Product Strategy
- Channel Strategy
- ADM
- Evonik
- Kemin Industries
- Alltech
- Novonesis
- Adisseo
- Trouw Nutrition (Nutreco)
- Cargill
- Case Studies
- Success Stories
- Recent Developments
- Competition Deep Dive
- Assumptions & Acronyms Used


