

- Market Size (2026)
- USD 430.0 Mn
- Forecast (2036)
- USD 1055.9 Mn
- CAGR (2026 to 2036)
- 9.4%
How big is the Gut Immunity Enzymes Market in 2026?
USD 430.0 million in 2026 and USD 1,055.9 million by 2036 at a 9.4% CAGR.
Digestive health positioning is shifting enzyme purchasing from ingredient substitution toward documented formulation control. CDC NCHS reported that 60.2% of USA adults used any dietary supplement during August 2021 to August 2023, which is expected to raise scrutiny of gut-positioned claims and daily-use labels. Beverage and powder programs now need enzyme activity records before wider digestive enzyme supplements launches move into audited retail plans. Suppliers are expected to win trial access by proving stability and label support before scale-up.
Food manufacturers and nutraceutical brands are expected to treat enzyme sourcing like production-risk control rather than catalog purchasing. Beverage processors need controlled activity during mixing and shelf-life planning before commercial trials move forward. Dairy and bakery teams need processing fit and cleaner documentation before recipe approval reaches production planners. Ingredient distributors serving food enzymes programs are likely to gain attention by pairing specification files and application service. Buyer value is expected to come from lower reformulation friction and fewer supplier handoffs.
Product value is expected to rise from links between digestive positioning and formulation behavior in one purchase review. Processing stability and supplier documentation are likely to shape approval confidence across buyer teams. Mature markets are projected to weight audit records and repeat manufacturing performance during supplier qualification reviews. Higher-growth markets are likely to weight access and channel scale during early account development. Procurement teams are expected to favor partners that link functional food ingredients to application support before launch risk spreads across R&D and quality teams.
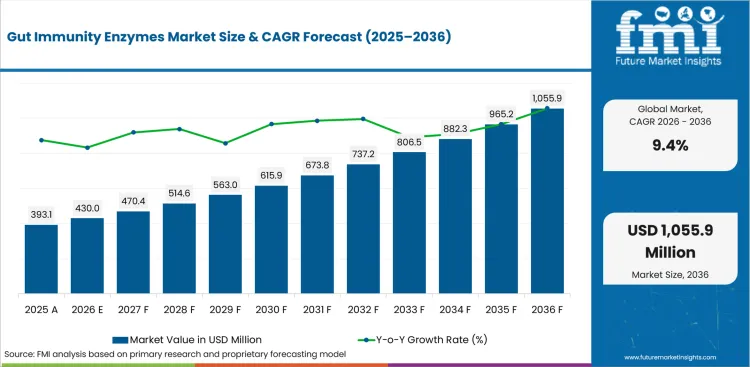
| Metric | Value |
|---|---|
| 2025 Market Size | USD 393.1 million |
| 2026 Market Size | USD 430.0 million |
| 2036 Market Size | USD 1,055.9 million |
| Forecast CAGR (2026-2036) | 9.4% |
| Product Type Focus | Powder |
| Powder Share (2026) | 37.5% |
| Source Focus | Microbial |
| Microbial Share (2026) | 35.0% |
| Application Focus | Beverages |
| Beverages Share (2026) | 41.5% |
| Fastest-growing Country | India |
| India CAGR by 2036 | 8.5% |
Summary of the Gut Immunity Enzymes Market
| Market Signal | Commercial Impact |
|---|---|
| Demand and Growth Drivers | Near-term spending is expected to move toward evidence-backed enzyme systems for digestive positioning and processing control. Documentation needs are likely to create urgency before products reach retailers and contract manufacturing lines.
|
| Product and Segment View | Powder is estimated to hold the notable product position in 2026 due to blending familiarity. Microbial sources and beverages are expected to guide source and application planning across gut-positioned products.
|
| Geography and Growth Outlook | India and China are expected to show higher-growth profiles due to nutraceutical access and localized nutrition demand. The United States and South Korea are likely to expand at steadier rates due to retail governance and digital channel depth.
|
| Competitive Landscape | Competition is expected to focus on activity proof and application support across food and supplement accounts. Procurement teams are likely to evaluate suppliers by enzyme portfolio depth and documentation readiness.
|
| Analyst Perspective | The primary adoption factor is expected to be evidence quality across enzyme activity and production fit. Suppliers are likely to retain accounts by reducing claim review work before wider launches.
|
How is the gut immunity enzymes market segmented?
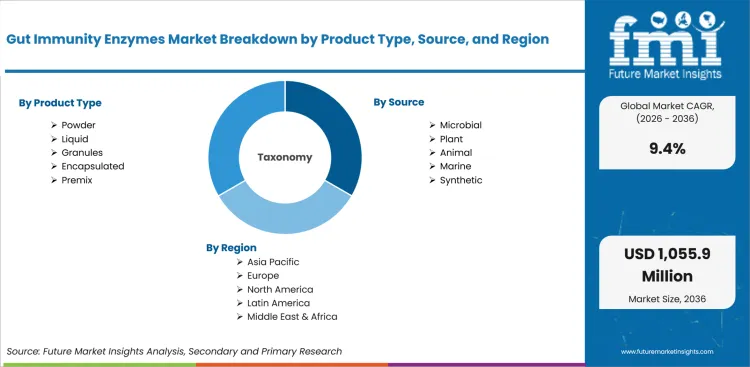
The gut immunity enzymes market industry is segmented by product type, source, application, end user, and region.
The gut immunity enzymes market is segmented by product type, source, application, end user, and region. By product type, the market covers powder, liquid, granules, encapsulated, and premix. By source, it covers plant, microbial, animal, marine, and synthetic inputs. By application, it covers bakery, beverages, dairy, snacks, and infant nutrition. By end user, it covers food manufacturers, foodservice, private label, nutraceutical brands, and retail. Regional coverage includes North America, Europe, East Asia, South Asia, and Latin America, supported by related demand in digestive health supplements.
How does powder shape demand within the product type category?
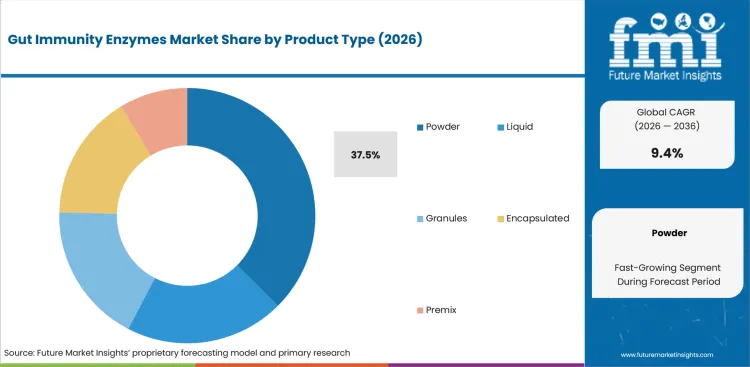
Format choice is expected to influence trial success before food manufacturers approve larger production. Powder formats carry procurement weight due to familiar handling and dry-blend control during pilot work. FDA food CGMP guidance was current in 2024, which is expected to keep documented handling and processing control central to supplier approval. Suppliers need activity evidence and manufacturing support before customers approve broader commercial runs across audited production programs.
- Powder is expected to account for 37.5% of product type demand in 2026, supported by storage stability and easier blending in premix lines. FDA dietary supplement inspection guidance from 2025 described a global supply chain containing more than 10000 facilities. That inspection scale is expected to raise the value of cleaner batch records for powder suppliers.
- The buyer case for powder centers on lower launch friction: food manufacturers gain a familiar enzyme format that simplifies batching and packaging. Powder programs also support industrial enzymes decisions in dry beverage bases and bakery mixes, which helps quality teams compare activity behavior before commercial orders and retailer-ready launches in audited accounts.
What supports demand for microbial source choices?
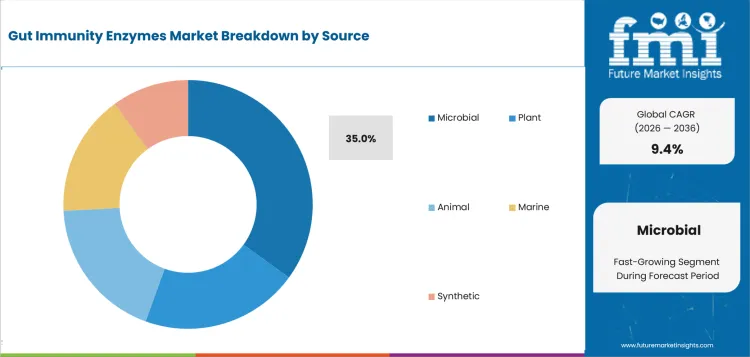
Source decisions are expected to shape buyer trust before enzymes move into commercial recipes. Microbial inputs fit fermentation-based supply and repeatable activity profiles that support formulation consistency during scale-up. Advanced Enzyme Technologies reported that human nutrition was a large business vertical in its 2024 annual report. Microbial sourcing is expected to stay under closer commercial review during documented product approval cycles. Procurement teams need traceability before formulation changes move toward commercial approval in products carrying gut-health claims.
- Microbial is projected to hold 35.0% of source demand in 2026, driven by repeatable activity profiles and fermentation-based supply for commercial enzyme programs. Novonesis completed the combination of Novozymes and Chr. Hansen in January 2024 and the combined biosolutions supplier is expected to deepen buyer review of enzyme and culture portfolios.
- Procurement teams in nutraceutical manufacturing gain from microbial inputs due to cleaner traceability and repeatable specification control in audited accounts. The buying decision also touches protease enzymes in digestion-led programs, which makes strain knowledge and activity documentation useful before supplier approval expands across health-positioned launches and pharmacy accounts internationally over time.
How do buyers evaluate beverages within application demand?
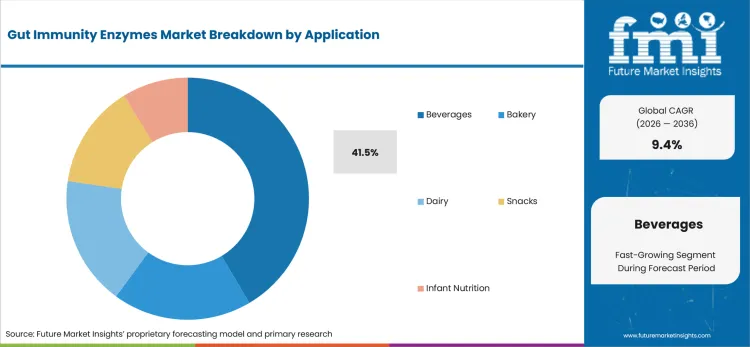
Application choice is expected to influence formulation risk before a beverage brand approves broader commercialization. Beverages expose enzymes to acidity and flavor interaction during shelf-life planning before brands approve finished formulas. Kerry published 2025 gut-health research on BC30 in Chinese adults, pointing to stronger evidence expectations for digestive-positioned formats. Beverage teams therefore need ingredient systems that protect activity and sensory fit during repeated production.
- Beverages are anticipated to represent 41.5% of application demand in 2026, attributable to daily-use digestive positioning and easier repeat purchase routines for gut-health brands and retailers. Eurostat reported that 78% of EU internet users bought online in 2025, which supports demand for better product-page clarity across functional beverage listings.
- For product managers, beverages reduce adoption friction due to daily consumption routines and simple usage cues in retail channels. Brands using functional foods positioning are expected to require enzyme systems that protect taste and activity before expanding across chilled or ambient retail formats and recurring purchase programs in retail environments.
What drives food manufacturers within the end user category?
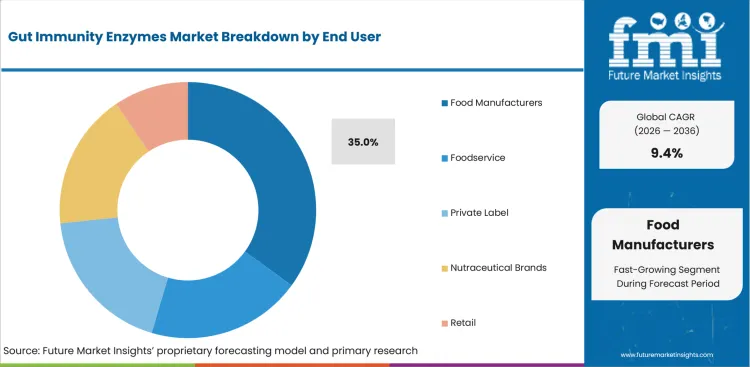
End user selection is expected to influence how much technical service buyers require before launch approval. Food manufacturers own the recipe file and carry the cost of failed production trials before approval. IFF announced a 2025 Vitafoods Europe program for plant-based supplement ingredients and technical expertise, which is expected to reinforce service-led supplier selection. Manufacturing teams need ingredient partners that reduce formulation uncertainty before production planners commit capacity.
- Food manufacturers are estimated to account for 35.0% of end user demand in 2026, due to direct responsibility for recipe trials and quality records in production plants. FDA released 2025 educational materials on the new dietary ingredient notification process, which is expected to strengthen documentation expectations for supplement-adjacent enzyme programs.
- Food manufacturers in bakery and beverage categories gain from enzyme suppliers that reduce formulation rework during early trials and launch reviews. The buyer case also connects to bakery enzymes demand due to activity control needs in dry mixes and baked nutrition formats before production schedules expand across retail accounts nationally.
What are the drivers, restraints, and opportunities in the gut immunity enzymes market?
Near-term purchases are being shaped by enzyme activity proof and formulation stability alongside application-service expansion routes outlined below.
- Driver: Digestive-positioning briefs are expected to push spending toward enzyme systems that support activity proof and production fit.
- Restraint: Adoption is anticipated to slow in accounts that lack stability evidence or clear ownership across claims review.
- Opportunity: Application-led technical service is projected to open supplier access among brands seeking faster formulation approval.
Food and supplement buyers are expected to increase enzyme trials if activity evidence links directly to production behavior. DSM-Firmenich published new Humiome B2 gut-health research in December 2024, which is expected to keep delivery science and microbiome positioning in the procurement review. Suppliers that explain digestive claims in production language are likely to gain early testing access before broader commercial awards and private-label reviews across audited programs and retailer channels.
Quality teams are likely to slow supplier approvals in accounts lacking traceable evidence and stable manufacturing records. FDA compliance materials for dietary supplements in 2025 described more than 10000 facilities in the global supply chain. Audit readiness is expected to stay visible during ingredient qualification across supplement and food manufacturing accounts before scale-up commitments proceed. Claims review and batch documents are expected to shape buying confidence before commercial production starts.
Implementation barriers are forecast to create a service route for suppliers that combine ingredient knowledge and application support. IFF presented plant-based dietary supplement ingredients and technical expertise at Vitafoods Europe 2025, pointing to buyer demand for formulation help before launch. Enzyme vendors serving plant-based food and beverages ingredients programs are expected to gain consideration by reducing the gap between R&D approval and commercial runs in buyer accounts and channel reviews.
Which country CAGRs are profiled in the gut immunity enzymes market?
.webp "Top Country Growth Comparison Gut Immunity Enzymes Market Cagr (2026 2036)")
| Country | CAGR |
|---|---|
| United States | 5.6% |
| China | 7.1% |
| India | 8.5% |
| Germany | 4.8% |
| United Kingdom | 5.2% |
| Japan | 4.0% |
| South Korea | 5.5% |
Source: FMI's proprietary forecasting model and primary research
How do country-level CAGRs compare in the gut immunity enzymes market?
Country CAGR profiles in the gut immunity enzymes market should be read by channel maturity and adoption triggers. Purchasing teams should align supplier service depth to each tier before awarding broader formulation programs.
- By 2036, United States is projected to grow at 5.6% CAGR due to supplement use and digital retail governance. USA Census Bureau reported retail e-commerce sales of USD 302.3 billion in the first quarter of 2026. Supplement brands are expected to use cleaner enzyme labels and recurring purchase programs for pharmacy and online accounts. Amano Enzyme and BIO-CAT are positioned to gain traction in accounts needing digestive enzyme documentation.
- China's demand outlook is anticipated to advance at 7.1% CAGR over the assessment period, supported by online wellness discovery. National Bureau of Statistics of China reported that online retail sales reached 15,972.2 billion yuan in 2025 across consumer categories. Urban beverage and supplement brands are likely to prioritize localized digestive claims and smaller pack formats. Kerry and DSM-Firmenich are expected to gain attention in accounts needing localized gut-health evidence.
- India is forecast to rise at 8.5% CAGR over the forecast period, attributable to nutraceutical whitespace and food-processing support. Press Information Bureau reported India remained under 2% of the global nutraceutical category in November 2024 despite traditional wellness depth. Ayurveda-linked supplement brands and fortified beverage producers are expected to seek enzyme systems that improve formulation readiness. Advanced Enzyme Technologies and ADM are likely to secure repeat discussions in documentation-led accounts.
- Adoption in Germany is estimated to post 4.8% CAGR over the forecast period, owing to evidence review and pharmacy channel discipline. German Federal Statistical Office reported that 83% of German internet users shopped online in 2024 across EU digital retail activity. Retail buyers are expected to examine benefit language and supplier records before listing gut-positioned products. Suppliers offering EU-ready documentation are predicted to receive stronger procurement consideration during pharmacy and online listing reviews.
- The United Kingdom outlook is projected to record 5.2% CAGR over the assessment period, driven by digital shelf comparison and pharmacy access. Office for National Statistics reported online sales values rose 12.2% against the prior year in June 2026 reporting. Health-store buyers are expected to seek product files that support private-label and branded gut-health ranges. IFF and Kerry are expected to build channel presence in accounts needing claim-ready formats.
- In Japan, gut immunity enzymes demand is predicted to advance at 4.0% CAGR over the forecast period due to careful claims review. METI estimated the domestic B-to-B e-commerce market at 514.4 trillion yen in 2024. Functional beverage and supplement buyers are likely to adopt enzymes selectively in routines that need trusted production records. Amano Enzyme and Roquette are positioned for accounts that value measured launch pacing and documented application support.
- South Korea is estimated to post 5.5% CAGR over the forecast period, supported by mobile commerce and beauty-linked wellness routines. Statistics Korea reported online shopping transaction value at 22.5974 trillion won in February 2026 across retail categories. Beauty and wellness sellers are expected to test compact digestive formats that work inside mobile-first retail programs. DSM-Firmenich and ADM are likely to gain discussions in accounts rewarding microbiome-backed positioning and retail-ready evidence.
Who are the notable companies in the gut immunity enzymes market?
Novonesis, Amano Enzyme, Advanced Enzyme Technologies, BIO-CAT, DSM-Firmenich, IFF, Kerry, ADM, and Roquette are the notable companies shaping this market.
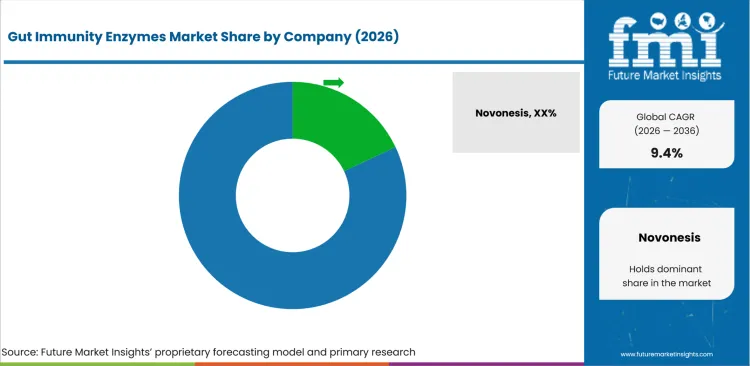
Competition in the gut immunity enzymes market is split by enzyme specificity and nutrition application support. Novonesis and Amano Enzyme are more suited to enzyme-led accounts that require activity proof and application support. Advanced Enzyme Technologies and BIO-CAT gain preference in specialist enzyme and probiotic programs needing narrower technical support. DSM-Firmenich and ADM are better positioned in broader gut-health nutrition systems that need ingredient science. IFF and Kerry become the practical choice in product-format conversion programs requiring application service. Roquette is more commonly selected in dosage-form programs that require plant-based excipient support during product development. Buyer decisions in digestive enzyme products are expected to center on which supplier reduces formulation risk and documentation work.
- Novonesis and Amano Enzyme focus on enzyme specificity and application depth, which addresses brands needing activity proof before commercial launch. Buyers use these portfolios to compare digestive function and processing behavior before expanding products across beverages or powder formats in audited programs.
- Buyers choosing Advanced Enzyme Technologies or BIO-CAT are typically looking for specialist enzyme and probiotic expertise supported by narrower technical focus. These suppliers are expected to help quality teams reduce supplier screening time before ingredient approval moves into pilot production.
- DSM-Firmenich and ADM gain preference in nutrition-led accounts due to broader microbiome and human health portfolios. Buyers value these suppliers in programs that need ingredient science and commercial support for gut-positioned product concepts across supplement channels and pharmacy listings globally.
- In formulation-heavy accounts, IFF and Kerry are prominent due to application service and channel-ready product development. Roquette supports dosage-form programs that need plant-based excipients and clean-label technical support before retail launch approval and broader listing review across multiple channels globally.
Competitive Benchmarking: Gut Immunity Enzymes Market
| Company | Enzyme Fit | Gut-Health Evidence | Application Support | Service Reach |
|---|---|---|---|---|
| Novonesis | High | Strong | Strong | Global |
| Amano Enzyme | High | Medium | Strong | Global |
| Advanced Enzyme Technologies | High | Strong | Strong | Regional |
| BIO-CAT | Strong | Strong | Strong | Regional |
| DSM-Firmenich | Medium | High | Strong | Global |
| IFF | Medium | Strong | High | Global |
| Kerry | Medium | Strong | High | Global |
| ADM | Medium | Strong | Medium | Global |
| Roquette | Medium | Medium | Strong | Global |
Source: Future Market Insights competitive analysis, 2026. Ratings reflect relative portfolio relevance and workflow fit. Service capability and geographic reach shape the remaining comparison.
Key Developments in the Gut Immunity Enzymes Market
- In April 2025, ADM said its ES1 postbiotic won the immune and gut health ingredient category at the Vitafoods Europe Innovation Awards. The ingredient centers on heat-treated Bifidobacterium longum CECT 7347 for immune and gut-health positioning. The development points to stronger buyer interest in shelf-stable gut-health inputs that support repeatable formulation work. Supplier positioning is expected to improve in accounts that need immune and digestive benefit support.
- In December 2024, DSM-Firmenich published new gut-health research for Humiome B2 in biotic supplement delivery. The update addressed biotic-powered supplement delivery and microbiome support for gut-positioned consumer health products. The development points to tighter buyer review of how nutrients reach the colon during product evidence assessment. Product teams are expected to evaluate gut-health ingredients by delivery science before claim approval.
- In April 2026, Roquette presented consumer healthcare capabilities for Vitafoods Europe across clean-label dosage formats. The portfolio included clean-label softgel technologies and nutraceutical dosage-form options for supplement brands seeking format flexibility. The update points to supplier interest in format-led differentiation for gut-health and supplement programs. Buyers are expected to compare excipient fit before moving enzyme concepts into finished formats and launch discussions.
- In May 2024, IFF highlighted its clean-label oral dosage portfolio at Vitafoods Europe for supplement producers. The program covered plant-based and cellulosic-derived supplement systems designed for oral dosage applications in consumer health. The update points to stronger demand for formulation support around consumer-friendly formats in audited channel launches. Gut immunity enzyme suppliers are expected to align activity evidence and dosage-form behavior before channel launch.
Key Players in the Gut Immunity Enzymes Market
Enzyme and biosolutions suppliers
- Novonesis
- Amano Enzyme
- Advanced Enzyme Technologies
- BIO-CAT
Nutrition and gut-health ingredient companies
- DSM-Firmenich
- ADM
- Kerry
Format and application-support suppliers
- IFF
- Roquette
Gut Immunity Enzymes Market - Report Scope
| Coverage field | Report scope |
|---|---|
| Market breakdown | Gut Immunity Enzymes Market Breakdown by product type, source, application, end user, and region |
| Quantitative Units | USD 430.0 million in 2026 to USD 1,055.9 million by 2036, at a CAGR of 9.4% |
| Market Definition | Gut immunity enzymes include digestive and formulation-support systems used by food manufacturers and nutraceutical brands for gut-positioned products. |
| Regions Covered | North America, Latin America, Europe, East Asia, South Asia and Pacific, Middle East and Africa |
| Countries Covered | United States, China, India, Germany, United Kingdom, Japan, South Korea and additional country markets |
| Key Companies Profiled | Novonesis, Amano Enzyme, Advanced Enzyme Technologies, BIO-CAT, DSM-Firmenich, IFF, Kerry, ADM, Roquette |
| Forecast Period | 2026 to 2036 |
| Approach | Hybrid methodology uses segment adoption and buyer use cases alongside country CAGRs and supplier portfolios for verified public-source checks |
Source: Future Market Insights - analysis driven by proprietary forecasting models and primary research
Gut Immunity Enzymes Market - Research Methodology
| Method | Approach |
|---|---|
| Primary Research | FMI analysts reviewed inputs from food manufacturers and nutraceutical brands during product-fit checks across formulation programs. Ingredient distributors and application specialists supported production-fit assessment for beverage and powder programs before supplier scoring. Interviews focused on enzyme activity evidence and source traceability before production approval decisions were tested. Discussions also covered formulation stability and production approval needs across beverage and powder formats. Country feedback helped test whether supplier service depth matched local buyer expectations during audited product launches. |
| Desk Research | Desk research covered official health sources and regulatory references used in supplement and food ingredient review. National retail indicators and company product information were also reviewed before supplier relevance was assessed. Product relevance was checked against gut-positioned enzyme use cases and beverage or powder formats. Source screening excluded unrelated food ingredients that lacked direct digestive or immunity positioning in commercial use. |
| Market Sizing and Forecasting | The model combined finished product demand and ingredient adoption across powder and microbial formats during forecast building. Forecast assumptions were adjusted for beverage use and food manufacturer adoption across audited formulation programs. Country-level retail access signals were compared against supplier portfolio evidence before growth tiers were assigned. Segment shares were checked against buyer use cases before final allocation in the forecast model. |
| Data Validation | Forecasts were checked against supplement use and digital retail activity before final modeling decisions were completed. Supplier portfolios and country-level health-product indicators supported final validation across profiled countries before drafting. Company portfolios were reviewed to avoid counting adjacent enzymes without gut immunity relevance in buyer applications. |
Gut Immunity Enzymes Market by Segments
Gut Immunity Enzymes Market segmented by Product Type:
- Powder
- Liquid
- Granules
- Encapsulated
- Premix
Gut Immunity Enzymes Market segmented by Source:
- Plant
- Microbial
- Animal
- Marine
- Synthetic
Gut Immunity Enzymes Market segmented by Application:
- Bakery
- Beverages
- Dairy
- Snacks
- Infant Nutrition
Gut Immunity Enzymes Market segmented by End User:
- Food Manufacturers
- Foodservice
- Private Label
- Nutraceutical Brands
- Retail
Gut Immunity Enzymes Market by Region:
- North America
- United States
- Canada
- Europe
- Germany
- United Kingdom
- France
- Italy
- Spain
- East Asia
- China
- Japan
- South Korea
- Taiwan
- South Asia and Pacific
- India
- Australia
- Singapore
- Indonesia
- Latin America
- Brazil
- Mexico
- Argentina
- Middle East and Africa
- GCC Countries
- South Africa
- Israel
Research Sources and Bibliography
- Stierman, B., Couch, C. A., Gahche, J. J., et al. (2026, May). Dietary supplement use: United States, August 2021-August 2023. National Center for Health Statistics.
- USA Food and Drug Administration. (2025, August). CP 7321.008, Dietary Supplements. USA Food and Drug Administration.
- USA Food and Drug Administration. (2025, June). New Dietary Ingredient (NDI) Notification Process. USA Food and Drug Administration.
- USA Food and Drug Administration. (2024, April). Current Good Manufacturing Practices (CGMPs) for Food and Dietary Supplements. USA Food and Drug Administration.
- USA Census Bureau. (2026, May). Quarterly Retail E-Commerce Sales Report. USA Census Bureau.
- National Bureau of Statistics of China. (2026, January). Total Retail Sales of Consumer Goods in December 2025. National Bureau of Statistics of China.
- Press Information Bureau, Government of India. (2024, November). India's Nutraceutical Industry Poised for Global Growth with Harmonized Standards and Reclassification. Press Information Bureau.
- German Federal Statistical Office. (2025, January). European Union: 8 out of 10 internet users shop online. German Federal Statistical Office.
- Office for National Statistics. (2026, June). Retail sales, Great Britain: May 2026. Office for National Statistics.
- Ministry of Economy, Trade and Industry. (2025, August). Results of FY2024 E-Commerce Market Survey Compiled. Ministry of Economy, Trade and Industry.
- Statistics Korea. (2026, April). Online Shopping in February 2026. Statistics Korea.
- Novonesis. (2024, January). Combination of Novozymes and Chr. Hansen is completed. Novonesis.
- Advanced Enzyme Technologies. (2024, July). Integrated Annual Report 2023-24. Advanced Enzyme Technologies.
- BIO-CAT. (2024, January). BIO-CAT and Caldic North America Announce Exclusive Partnership. BIO-CAT.
- DSM-Firmenich. (2024, December). New gut health research for Humiome B2. DSM-Firmenich.
- IFF. (2025, April). IFF Pharma Solutions to Showcase Plant-Based Dietary Supplement Ingredients and Technical Expertise at Vitafoods Europe 2025. IFF.
- Kerry. (2025, September). How BC30 Supports Gut Health in Chinese Adults. Kerry.
- ADM. (2025, May). Postbiotic Prowess: ADM's ES1 Postbiotic Wins Immune & Gut Health Ingredient Category at Inaugural Vitafoods Europe Innovation Awards. ADM.
- Roquette. (2026, April). Roquette at Vitafoods Europe 2026. Roquette.
This bibliography is provided for reader reference and uses primary government, standards-body, official trade body, and company sources.
This Report Answers
- What value is the gut immunity enzymes market expected to reach in 2026 and 2036?
- What CAGR is forecast for the gut immunity enzymes market from 2026 to 2036?
- Which segments shape demand across product type, source, application, and end user categories?
- Which buyer pressures are expected to support powder and microbial enzyme adoption?
- How do country CAGRs differ across the profiled gut immunity enzyme markets?
- Which companies compete across enzyme specificity, application support, and nutrition science?
- How does FMI validate forecasts and remove duplicate external statistics before drafting?
- What buyer factors should suppliers address before broader account expansion?
- How does claims review and documentation quality affect supplier selection?
Frequently Asked Questions
Why should executives track the Gut Immunity Enzymes Market?
Executives should track this market to understand how gut-positioned enzyme systems are moving into documented food and supplement launches.
What business problem does the Gut Immunity Enzymes Market address?
The market addresses formulation risk by helping brands link digestive positioning to enzyme activity and stable production behavior.
What should procurement leaders evaluate before selecting suppliers?
Procurement leaders should evaluate activity evidence and source traceability before supplier approval decisions move forward. They should also review formulation fit and claim-ready documentation before scale-up programs begin across commercial accounts.
What limits return on investment for buyers?
Return on investment is limited by weak stability evidence and unclear ownership across claims review. Delayed production approval creates further risk before scale-up and reduces the value of early formulation work.
How do suppliers build executive confidence?
Suppliers build confidence by providing enzyme activity data and batch records for audited launches. Application guidance and retail-ready documentation support broader account approval across audited product launches and recurring purchase discussions.
Preview the report firsthand - request a free sample
Get SampleGet the brochure for pricing and purchase details.
Get PDFTable of Content
- Key Takeaways
- Market Size and CAGR
- Top Growth Driver
- Fastest Growing Segment
- Leading Region
- Key Companies
- Emerging Opportunities
- Executive Summary
- Global Market Outlook
- Demand-side Trends
- Supply-side Trends
- Technology Roadmap Analysis
- Analysis and Recommendations
- Analyst Perspective (What is happening? Why now? What should investors know?)
- Key Questions Answered
- How large is the market?
- What is the CAGR?
- What are key trends?
- Which region dominates?
- Who are the leaders?
- Market Overview
- Market Coverage / Taxonomy
- Market Definition / Scope / Limitations
- Research Methodology
- Chapter Orientation
- Analytical Lens and Working Hypotheses
- Market Structure, Signals, and Trend Drivers
- Benchmarking and Cross-market Comparability
- Market Sizing, Forecasting, and Opportunity Mapping
- Research Design and Evidence Framework
- Desk Research Programme (Secondary Evidence)
- Expert Input and Fieldwork (Primary Evidence)
- Tooling, Models, and Reference Databases
- Data Engineering and Model Build
- Quality Assurance and Audit Trail
- Market Background
- Market Dynamics (Drivers, Restraints, Opportunity, Trends)
- Scenario Forecast (Optimistic, Likely, Conservative)
- Impact Analysis
- AI Impact
- Sustainability Impact
- Regulatory Impact
- Technology Impact
- Consumer / Buyer Analysis
- Purchase Drivers
- Adoption Barriers
- Buyer Journey
- Opportunity Map Analysis
- Product Life Cycle Analysis
- Supply Chain Analysis
- Investment Feasibility Matrix
- Value Chain Analysis
- PESTLE and Porter's Analysis
- Regulatory Landscape
- Regional Parent Market Outlook
- Production and Consumption Statistics
- Import and Export Statistics
- Global Market Analysis and Forecast, 2021 to 2036
- Historical Market Size Value (USD Million) & Volume (Unit) Analysis, 2021 to 2025
- Current and Future Market Size Value (USD Million) & Volume (Unit) Projections, 2026 to 2036
- Y-o-Y Growth Trend Analysis
- Absolute $ Opportunity Analysis
- Global Market Pricing Analysis, 2021 to 2036
- Global Market Analysis and Forecast, By Product Type, 2021 to 2036
- Introduction / Key Findings
- Historical Market Size Value (USD Million) & Volume (Unit) Analysis By Product Type, 2021 to 2025
- Current and Future Market Size Value (USD Million) & Volume (Unit) Analysis and Forecast By Product Type, 2026 to 2036
- Powder
- Liquid
- Granules
- Encapsulated
- Premix
- Powder
- Y-o-Y Growth Trend Analysis By Product Type, 2021 to 2025
- Absolute $ Opportunity Analysis By Product Type, 2026 to 2036
- Global Market Analysis and Forecast, By Source, 2021 to 2036
- Introduction / Key Findings
- Historical Market Size Value (USD Million) & Volume (Unit) Analysis By Source, 2021 to 2025
- Current and Future Market Size Value (USD Million) & Volume (Unit) Analysis and Forecast By Source, 2026 to 2036
- Microbial
- Plant
- Animal
- Marine
- Synthetic
- Microbial
- Y-o-Y Growth Trend Analysis By Source, 2021 to 2025
- Absolute $ Opportunity Analysis By Source, 2026 to 2036
- Global Market Analysis and Forecast, By Application, 2021 to 2036
- Introduction / Key Findings
- Historical Market Size Value (USD Million) & Volume (Unit) Analysis By Application, 2021 to 2025
- Current and Future Market Size Value (USD Million) & Volume (Unit) Analysis and Forecast By Application, 2026 to 2036
- Beverages
- Bakery
- Dairy
- Snacks
- Infant Nutrition
- Beverages
- Y-o-Y Growth Trend Analysis By Application, 2021 to 2025
- Absolute $ Opportunity Analysis By Application, 2026 to 2036
- Global Market Analysis and Forecast, By End User, 2021 to 2036
- Introduction / Key Findings
- Historical Market Size Value (USD Million) & Volume (Unit) Analysis By End User, 2021 to 2025
- Current and Future Market Size Value (USD Million) & Volume (Unit) Analysis and Forecast By End User, 2026 to 2036
- Food Manufacturers
- Foodservice
- Private Label
- Nutraceutical Brands
- Retail
- Food Manufacturers
- Y-o-Y Growth Trend Analysis By End User, 2021 to 2025
- Absolute $ Opportunity Analysis By End User, 2026 to 2036
- Global Market Analysis and Forecast, By Region, 2021 to 2036
- Introduction
- Historical Market Size Value (USD Million) & Volume (Unit) Analysis By Region, 2021 to 2025
- Current Market Size Value (USD Million) & Volume (Unit) Analysis and Forecast By Region, 2026 to 2036
- North America
- Latin America
- Western Europe
- Eastern Europe
- East Asia
- South Asia and Pacific
- Middle East & Africa
- Market Attractiveness Analysis By Region
- North America Market Analysis and Forecast, By Country, 2021 to 2036
- Historical Market Size Value (USD Million) & Volume (Unit) Trend Analysis By Market Taxonomy, 2021 to 2025
- Market Size Value (USD Million) & Volume (Unit) Forecast By Market Taxonomy, 2026 to 2036
- By Country
- USA
- Canada
- Mexico
- By Product Type
- By Source
- By Application
- By End User
- By Country
- Market Attractiveness Analysis
- By Country
- By Product Type
- By Source
- By Application
- By End User
- Key Takeaways
- Latin America Market Analysis and Forecast, By Country
- Historical Market Size Value (USD Million) & Volume (Unit) Trend Analysis By Market Taxonomy, 2021 to 2025
- Market Size Value (USD Million) & Volume (Unit) Forecast By Market Taxonomy, 2026 to 2036
- By Country
- Brazil
- Chile
- Rest of Latin America
- By Product Type
- By Source
- By Application
- By End User
- By Country
- Market Attractiveness Analysis
- By Country
- By Product Type
- By Source
- By Application
- By End User
- Key Takeaways
- Western Europe Market Analysis and Forecast, By Country
- Historical Market Size Value (USD Million) & Volume (Unit) Trend Analysis By Market Taxonomy, 2021 to 2025
- Market Size Value (USD Million) & Volume (Unit) Forecast By Market Taxonomy, 2026 to 2036
- By Country
- Germany
- UK
- Italy
- Spain
- France
- Nordic
- BENELUX
- Rest of Western Europe
- By Product Type
- By Source
- By Application
- By End User
- By Country
- Market Attractiveness Analysis
- By Country
- By Product Type
- By Source
- By Application
- By End User
- Key Takeaways
- Eastern Europe Market Analysis and Forecast, By Country
- Historical Market Size Value (USD Million) & Volume (Unit) Trend Analysis By Market Taxonomy, 2021 to 2025
- Market Size Value (USD Million) & Volume (Unit) Forecast By Market Taxonomy, 2026 to 2036
- By Country
- Russia
- Poland
- Hungary
- Balkan & Baltic
- Rest of Eastern Europe
- By Product Type
- By Source
- By Application
- By End User
- By Country
- Market Attractiveness Analysis
- By Country
- By Product Type
- By Source
- By Application
- By End User
- Key Takeaways
- East Asia Market Analysis and Forecast, By Country
- Historical Market Size Value (USD Million) & Volume (Unit) Trend Analysis By Market Taxonomy, 2021 to 2025
- Market Size Value (USD Million) & Volume (Unit) Forecast By Market Taxonomy, 2026 to 2036
- By Country
- China
- Japan
- South Korea
- By Product Type
- By Source
- By Application
- By End User
- By Country
- Market Attractiveness Analysis
- By Country
- By Product Type
- By Source
- By Application
- By End User
- Key Takeaways
- South Asia and Pacific Market Analysis and Forecast, By Country
- Historical Market Size Value (USD Million) & Volume (Unit) Trend Analysis By Market Taxonomy, 2021 to 2025
- Market Size Value (USD Million) & Volume (Unit) Forecast By Market Taxonomy, 2026 to 2036
- By Country
- India
- ASEAN
- Australia & New Zealand
- Rest of South Asia and Pacific
- By Product Type
- By Source
- By Application
- By End User
- By Country
- Market Attractiveness Analysis
- By Country
- By Product Type
- By Source
- By Application
- By End User
- Key Takeaways
- Middle East & Africa Market Analysis and Forecast, By Country
- Historical Market Size Value (USD Million) & Volume (Unit) Trend Analysis By Market Taxonomy, 2021 to 2025
- Market Size Value (USD Million) & Volume (Unit) Forecast By Market Taxonomy, 2026 to 2036
- By Country
- Kingdom of Saudi Arabia
- Other GCC Countries
- Türkiye
- South Africa
- Other African Union
- Rest of Middle East & Africa
- By Product Type
- By Source
- By Application
- By End User
- By Country
- Market Attractiveness Analysis
- By Country
- By Product Type
- By Source
- By Application
- By End User
- Key Takeaways
- Key Countries Market Analysis
- USA
- Pricing Analysis
- Market Share Analysis, 2025
- By Product Type
- By Source
- By Application
- By End User
- Canada
- Pricing Analysis
- Market Share Analysis, 2025
- By Product Type
- By Source
- By Application
- By End User
- Mexico
- Pricing Analysis
- Market Share Analysis, 2025
- By Product Type
- By Source
- By Application
- By End User
- Brazil
- Pricing Analysis
- Market Share Analysis, 2025
- By Product Type
- By Source
- By Application
- By End User
- Chile
- Pricing Analysis
- Market Share Analysis, 2025
- By Product Type
- By Source
- By Application
- By End User
- Germany
- Pricing Analysis
- Market Share Analysis, 2025
- By Product Type
- By Source
- By Application
- By End User
- UK
- Pricing Analysis
- Market Share Analysis, 2025
- By Product Type
- By Source
- By Application
- By End User
- Italy
- Pricing Analysis
- Market Share Analysis, 2025
- By Product Type
- By Source
- By Application
- By End User
- Spain
- Pricing Analysis
- Market Share Analysis, 2025
- By Product Type
- By Source
- By Application
- By End User
- France
- Pricing Analysis
- Market Share Analysis, 2025
- By Product Type
- By Source
- By Application
- By End User
- India
- Pricing Analysis
- Market Share Analysis, 2025
- By Product Type
- By Source
- By Application
- By End User
- ASEAN
- Pricing Analysis
- Market Share Analysis, 2025
- By Product Type
- By Source
- By Application
- By End User
- Australia & New Zealand
- Pricing Analysis
- Market Share Analysis, 2025
- By Product Type
- By Source
- By Application
- By End User
- China
- Pricing Analysis
- Market Share Analysis, 2025
- By Product Type
- By Source
- By Application
- By End User
- Japan
- Pricing Analysis
- Market Share Analysis, 2025
- By Product Type
- By Source
- By Application
- By End User
- South Korea
- Pricing Analysis
- Market Share Analysis, 2025
- By Product Type
- By Source
- By Application
- By End User
- Russia
- Pricing Analysis
- Market Share Analysis, 2025
- By Product Type
- By Source
- By Application
- By End User
- Poland
- Pricing Analysis
- Market Share Analysis, 2025
- By Product Type
- By Source
- By Application
- By End User
- Hungary
- Pricing Analysis
- Market Share Analysis, 2025
- By Product Type
- By Source
- By Application
- By End User
- Kingdom of Saudi Arabia
- Pricing Analysis
- Market Share Analysis, 2025
- By Product Type
- By Source
- By Application
- By End User
- Türkiye
- Pricing Analysis
- Market Share Analysis, 2025
- By Product Type
- By Source
- By Application
- By End User
- South Africa
- Pricing Analysis
- Market Share Analysis, 2025
- By Product Type
- By Source
- By Application
- By End User
- USA
- Market Structure Analysis
- Competition Dashboard
- Competition Benchmarking
- Market Share Analysis of Top Players
- By Regional
- By Product Type
- By Source
- By Application
- By End User
- Emerging Startups
- Innovation Benchmarking
- Competition Analysis
- Competition Deep Dive
- Novonesis
- Overview
- Product Portfolio
- Profitability by Market Segments (Product/Region/Sales Channel)
- Sales Footprint
- Strategy Overview
- Marketing Strategy
- Product Strategy
- Channel Strategy
- Amano Enzyme
- Advanced Enzyme Technologies
- BIO-CAT
- DSM-Firmenich
- ADM
- Kerry
- Novonesis
- Case Studies
- Success Stories
- Recent Developments
- Competition Deep Dive
- Assumptions & Acronyms Used


