The hammer mill industry stands at the threshold of a decade-long expansion trajectory that promises to reshape particle size reduction technology, agricultural processing solutions, and industrial grinding applications. The market's journey from USD 751.3 million in 2025 to USD 1,133.7 million by 2035 represents substantial growth, demonstrating the accelerating adoption of advanced hammer mill configurations and grinding technology across food processing, agricultural feed production, metals and mining, and specialty industrial sectors.
The first half of the decade (2025-2030) will witness the market climbing from USD 751.3 million to approximately USD 926.2 million, adding USD 174.9 million in value, which constitutes 50% of the total forecast growth period. This phase will be characterized by the rapid adoption of gravity discharge systems, driven by increasing agricultural processing volumes and the growing need for high-performance size reduction requirements worldwide. Advanced capacity optimization capabilities and flexible grinding systems will become standard expectations rather than premium options.
The latter half (2030-2035) will witness sustained growth from USD 926.2 million to USD 1,133.7 million, representing an addition of USD 173.8 million or 50% of the decade's expansion. This period will be defined by mass market penetration of specialized hammer mill configurations, integration with comprehensive processing platforms, and seamless compatibility with existing agricultural and industrial infrastructure. The market trajectory signals fundamental shifts in how manufacturers approach particle size optimization and production quality management, with participants positioned to benefit from sustained demand across multiple capacity ranges and end-use segments.
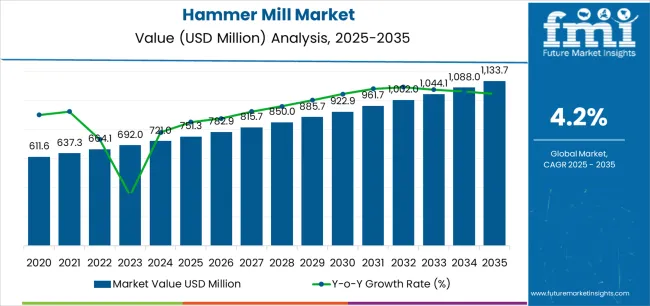
The Hammer Mill market demonstrates distinct growth phases with varying market characteristics and competitive dynamics. Between 2025 and 2030, the market progresses through its technology adoption phase, expanding from USD 751.3 million to USD 926.2 million with steady annual increments averaging 4.2% growth. This period showcases the transition from basic hammer mill configurations to advanced gravity discharge systems with enhanced grinding capabilities and integrated quality control systems becoming mainstream features.
The 2025-2030 phase adds USD 174.9 million to market value, representing 50% of total decade expansion. Market maturation factors include standardization of agricultural processing and industrial grinding protocols, declining component costs for specialized hammer mill configurations, and increasing industry awareness of size reduction benefits reaching 92-95% grinding effectiveness in food processing and agricultural applications. Competitive landscape evolution during this period features established equipment manufacturers like Bühler Group and ANDRITZ expanding their hammer mill portfolios while specialty manufacturers focus on advanced capacity development and enhanced grinding capabilities.
From 2030 to 2035, market dynamics shift toward advanced automation integration and global manufacturing expansion, with growth continuing from USD 926.2 million to USD 1,133.7 million, adding USD 173.8 million or 50% of total expansion. This phase transition centers on specialized hammer mill systems, integration with automated processing networks, and deployment across diverse agricultural and industrial scenarios, becoming standard rather than specialized applications. The competitive environment matures with focus shifting from basic grinding capability to comprehensive production optimization systems and integration with process monitoring platforms.
At-a-Glance Metrics
| Metric | Value |
|---|---|
| Market Value (2025) | USD 751.3 million |
| Market Forecast (2035) | USD 1,133.7 million |
| Growth Rate | 4.2% CAGR |
| Leading Technology | 100-500 kg/h Capacity Segment |
| Primary Application | Agriculture/Food & Feed Segment |
The market demonstrates strong fundamentals with mid-range capacity systems capturing a dominant share through advanced particle size reduction and production optimization capabilities. Agriculture and food processing applications drive primary demand, supported by increasing feed production and food processing technology requirements. Geographic expansion remains concentrated in developed markets with established agricultural infrastructure, while emerging economies show accelerating adoption rates driven by agricultural mechanization expansion and rising processing standards.
Market expansion rests on three fundamental shifts driving adoption across the agricultural, food processing, and industrial sectors. First, agricultural feed production demand creates compelling operational advantages through hammer mills that provide immediate particle size reduction without production delays, enabling manufacturers to meet stringent quality standards while maintaining processing productivity and reducing operational costs. Second, food processing modernization accelerates as production facilities worldwide seek advanced grinding systems that complement traditional milling processes, enabling precise particle control and quality management that align with industry standards and food safety regulations.
Third, industrial material processing enhancement drives adoption from manufacturing facilities and specialty chemical producers requiring effective size reduction solutions that minimize waste while maintaining operational productivity during material preparation and component integration operations. However, growth faces headwinds from energy cost challenges that vary across industrial facilities regarding power consumption and operational efficiency, which may limit adoption in cost-sensitive environments. Technical limitations also persist regarding material characteristics and moisture content conditions that may reduce effectiveness in processing sticky or fibrous materials, which affect grinding performance and screen consistency.
The hammer mill market represents a specialized yet critical processing equipment opportunity driven by expanding global agricultural production, food processing infrastructure modernization, and the need for superior grinding effectiveness in diverse industrial applications. As manufacturers worldwide seek to achieve 92-95% size reduction effectiveness, reduce production waste, and integrate advanced grinding systems with automated platforms, hammer mills are evolving from basic grinding equipment to sophisticated processing solutions ensuring production quality and operational efficiency.
The market's growth trajectory from USD 751.3 million in 2025 to USD 1,133.7 million by 2035 at a 4.2% CAGR reflects fundamental shifts in processing quality requirements and particle size optimization. Geographic expansion opportunities are particularly pronounced in Asian markets, while the dominance of mid-range capacity systems (35.0% market share) and agriculture/food & feed applications (33.0% share) provides clear strategic focus areas.
Strengthening the dominant 100-500 kg/h capacity segment (35.0% market share) through enhanced grinding configurations, superior material processing efficiency, and automated control systems. This pathway focuses on optimizing screen designs, improving particle uniformity, extending operational effectiveness to 92-95% success rates, and developing specialized configurations for diverse materials. Market leadership consolidation through advanced mechanical engineering and automated process integration enables premium positioning while defending competitive advantages against alternative grinding technologies. Expected revenue pool: USD 45-60 million
Rapid agricultural and food processing growth across Asia (China 5.2% CAGR, India 6.2% CAGR) creates substantial expansion opportunities through local production capabilities and technology transfer partnerships. Growing feed production and government agricultural mechanization initiatives drive sustained demand for advanced grinding systems. Localization strategies reduce import costs, enable faster technical support, and position companies advantageously for procurement programs while accessing growing domestic markets. Expected revenue pool: USD 55-75 million
Expansion within the dominant agriculture/food & feed segment (33.0% market share) through specialized configurations addressing food safety standards and high-volume processing requirements. This pathway encompasses automated feeding systems, quality control integration, and compatibility with diverse agricultural processing operations. Premium positioning reflects superior grinding performance and comprehensive food safety compliance supporting modern feed and food production. Expected revenue pool: USD 40-55 million
Strategic leadership in gravity discharge product type (40.0% market share) requires enhanced processing capabilities and specialized mechanical designs addressing material flow operational requirements. This pathway addresses standard grinding applications, bulk material processing, and general industrial size reduction with advanced engineering for demanding processing conditions. Premium pricing reflects proven reliability and operational efficiency standards. Expected revenue pool: USD 35-50 million
Development of specialized hammer mill configurations for metals & mining (18.0% share), energy & power (10.0%), and pharmaceuticals (9.0%), addressing specific material processing requirements and niche application demands. This pathway encompasses hardened wear components, explosion-proof designs, and sanitary construction alternatives for specialized markets. Technology differentiation through proprietary grinding technologies enables diversified revenue streams while reducing dependency on single application platforms. Expected revenue pool: USD 30-42 million
Expansion of above 3000 kg/h capacity segment (20.0% market share) through enhanced structural design, heavy-duty motor systems, and industrial-scale processing requirements. This pathway encompasses continuous operation capabilities, large-scale mining applications, and high-volume biomass processing requiring robust construction characteristics. Market development through advanced engineering enables differentiated positioning while accessing industrial markets requiring large-capacity grinding solutions. Expected revenue pool: USD 28-38 million
Development of pneumatic discharge systems (25.0% market share) addressing enclosed processing and dust control requirements across food processing and pharmaceutical applications. This pathway encompasses automated material handling, comprehensive dust collection integration, and sanitary processing documentation. Premium positioning reflects advanced automation capabilities and environmental compliance while enabling access to quality-focused procurement programs and hygiene-driven partnerships. Expected revenue pool: USD 25-35 million
Primary Classification: The market segments by capacity into 100-500 kg/h, Up to 100 kg/h, 500-1000 kg/h, 1000-3000 kg/h, and Above 3000 kg/h categories, representing the evolution from laboratory-scale equipment to industrial processing solutions for comprehensive material size reduction.
Secondary Classification: Product type segmentation divides the market into Gravity Discharge, Pneumatic Discharge, Full Circle Screen, Lump Breakers, and Horizontal In-feed configurations, reflecting distinct requirements for material handling, dust control, and processing efficiency standards.
Tertiary Classification: End-use segmentation covers Agriculture/Food & Feed, Metals & Mining, Energy & Power, Pharmaceuticals, and Scrap Recycling/Chemicals/Others sectors, demonstrating varied requirements for grinding performance, processing capacity, and material handling standards.
Regional Classification: Geographic distribution covers East Asia, Europe, North America, South Asia Pacific, Latin America, and the Middle East & Africa, with developed markets leading adoption while emerging economies show accelerating growth patterns driven by agricultural mechanization expansion programs.
The segmentation structure reveals technology progression from standard hammer mill configurations toward specialized grinding systems with enhanced automation and process control capabilities, while application diversity spans from agricultural feed processing to specialized pharmaceutical and mining applications requiring precise particle size reduction solutions.
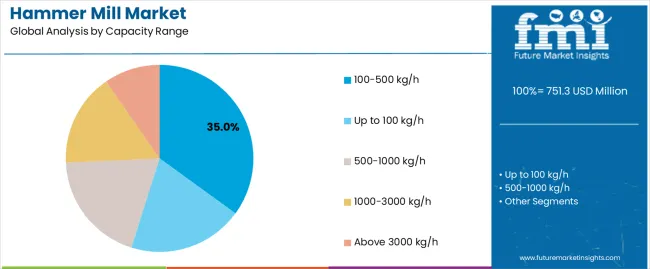
Market Position: Mid-range capacity systems command the leading position in the Hammer Mill market with approximately 35.0% market share through optimal processing throughput features, including balanced production efficiency, versatile material handling capability, and operational flexibility that enable manufacturers to achieve optimal size reduction across diverse agricultural and food processing environments.
Value Drivers: The segment benefits from processor preference for scalable grinding systems that provide consistent particle size distribution, reduced maintenance requirements, and production efficiency optimization without requiring excessive power consumption. Advanced mechanical features enable automated feed control, screen interchangeability, and integration with existing processing equipment, where throughput performance and energy efficiency represent critical operational requirements.
Competitive Advantages: Mid-range capacity systems differentiate through proven operational reliability, optimal power-to-output ratios, and integration with standard processing infrastructure that enhance operational effectiveness while maintaining equipment costs suitable for diverse agricultural and industrial applications.
Key market characteristics:
Above 3000 kg/h capacity systems maintain a significant 20.0% market share in the Hammer Mill market due to their industrial-scale processing capabilities and heavy-duty construction advantages. These systems appeal to large-scale feed mills and industrial processors requiring high-volume continuous grinding with robust mechanical design for demanding production environments. Market growth is driven by industrial capacity expansion, emphasizing reliable high-throughput solutions and operational efficiency through optimized heavy-duty systems.
Medium-large capacity systems capture 18.0% market share, serving mid-sized agricultural processors and regional feed mills requiring substantial throughput without full industrial-scale investment. These configurations balance production capacity with manageable operational requirements for growing processing operations.
Small capacity systems (up to 100 kg/h) hold 15.0% share, primarily serving laboratory testing, pilot production, and specialty grinding applications. The 500-1000 kg/h segment maintains 12.0% share, addressing small commercial processors and specialized material handling requirements where precise throughput control meets operational needs without oversized equipment investment.
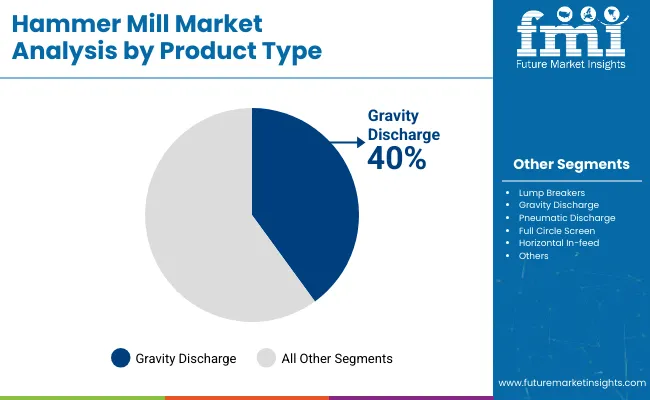
Market Context: Gravity discharge configurations dominate the Hammer Mill market with approximately 40.0% market share due to widespread adoption of simple material handling systems and increasing focus on cost-effective operation, standard grinding applications, and maintenance simplicity that minimize operational complexity while maintaining processing reliability.
Appeal Factors: Agricultural and industrial processors prioritize system reliability, operational simplicity, and minimal maintenance requirements that enable straightforward material discharge without pneumatic conveying infrastructure. The segment benefits from substantial cost advantages and operational flexibility that emphasize acquisition of grinding systems for general-purpose size reduction and standard processing applications.
Growth Drivers: Feed mill modernization programs incorporate gravity discharge systems as standard equipment for agricultural processing operations, while industrial material processing growth increases demand for cost-effective grinding capabilities that meet quality standards without specialized material handling infrastructure.
Market Challenges: Varying dust control requirements and material handling preferences may limit system adoption across facilities requiring enclosed processing or automated material transport capabilities.
Application dynamics include:
Pneumatic discharge configurations capture approximately 25.0% market share through enclosed processing requirements in food manufacturing, pharmaceutical production, and dust-sensitive applications. These facilities demand integrated material handling systems capable of controlled product transfer while providing effective dust containment and environmental protection capabilities.
Full circle screen systems account for approximately 12.0% market share, lump breakers capture 13.0%, and horizontal in-feed configurations maintain 10.0% share, addressing specialized grinding requirements including maximum screening efficiency, pre-crushing operations, and controlled material feeding for sensitive processing applications requiring enhanced operational precision.
Growth Accelerators: Agricultural feed production expansion drives primary adoption as hammer mills provide particle size reduction capabilities that enable feed manufacturers to meet nutritional formulation standards without excessive processing delays, supporting production operations and agricultural industry requirements that demand precise grinding applications. Food processing infrastructure demand accelerates market expansion as facilities seek effective size reduction systems that optimize ingredient preparation while maintaining operational efficiency during food manufacturing and grain processing scenarios. Industrial material processing spending increases worldwide, creating sustained demand for grinding systems that complement traditional size reduction processes and provide operational flexibility in complex manufacturing environments.
Growth Inhibitors: Energy cost challenges vary across industrial facilities regarding power consumption and operational efficiency optimization, which may limit investment flexibility and market penetration in regions with high electricity costs or energy-intensive processing operations. Material handling limitations persist regarding moisture content and fibrous materials that may reduce effectiveness in processing sticky substances, wet materials, or stringy biomass conditions, affecting grinding performance and screen longevity. Market fragmentation across multiple capacity requirements and application specifications creates compatibility concerns between different equipment suppliers and existing processing infrastructure.
Market Evolution Patterns: Adoption accelerates in commercial feed production and industrial processing sectors where throughput requirements justify grinding equipment costs, with geographic concentration in agricultural regions transitioning toward mainstream adoption in emerging economies driven by mechanization expansion and processing infrastructure development. Technology development focuses on enhanced automation capabilities, improved energy efficiency, and integration with process control systems that optimize material grinding and operational effectiveness. The market could face disruption if alternative size reduction technologies or energy efficiency regulations significantly limit the deployment of traditional hammer mill configurations in agricultural or industrial applications, though the equipment's combination of versatility, reliability, and cost-effectiveness continues to make it essential in material processing operations.
The Hammer Mill market demonstrates varied regional dynamics with Growth Leaders including India (6.2% CAGR) and China (5.2% CAGR) driving expansion through agricultural mechanization capacity additions and feed production infrastructure programs. Steady Performers encompass South Korea (4.8% CAGR), Japan (4.0% CAGR), and the United States (3.8% CAGR), benefiting from established food processing industries and advanced agricultural technology adoption. Mature Markets feature Germany (2.7% CAGR) and Brazil (3.2% CAGR), where specialized industrial applications and agricultural processing modernization support consistent growth patterns.
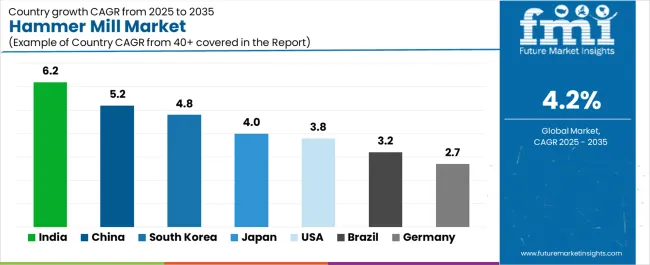
| Country | CAGR (2025-2035) |
|---|---|
| India | 6.2% |
| China | 5.2% |
| South Korea | 4.8% |
| Japan | 4.0% |
| USA | 3.8% |
| Brazil | 3.2% |
| Germany | 2.7% |
Regional synthesis reveals Asian markets leading adoption through agricultural mechanization expansion and feed production infrastructure development, while European countries maintain steady expansion supported by food processing technology advancement and environmental efficiency requirements. North American markets show moderate growth driven by agricultural processing modernization and equipment replacement trends.
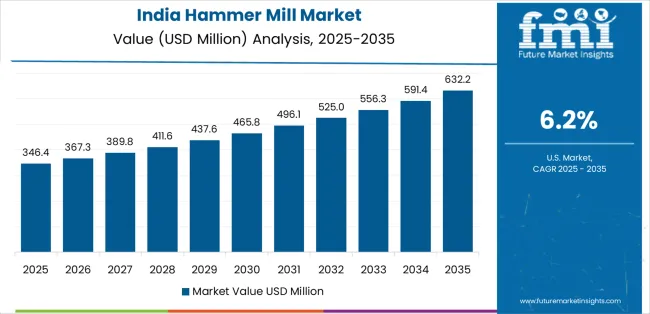
India leads growth momentum with a 6.2% CAGR, driven by rapid agricultural processing development, expanding feed production capacity, and rural mechanization adoption across major agricultural states including Punjab, Haryana, Maharashtra, and Andhra Pradesh. Feed mill construction and grain processing modernization requirements drive primary demand, while growing poultry and livestock sectors create diversified application opportunities. Government agricultural mechanization initiatives and food processing investment programs support sustained expansion through subsidies, favorable financing schemes, and infrastructure development. The convergence of agricultural growth, processing standards improvement, and rural infrastructure development positions India as a key emerging market for hammer mill equipment.
Performance Metrics:
The Chinese market emphasizes advanced processing capacity expansion with documented operational effectiveness in large-scale feed production and biomass processing facilities through integration with automated systems and production infrastructure. The country leverages manufacturing expertise in agricultural equipment and processing technology to maintain strong growth at 5.2% CAGR. Industrial centers including Shandong, Henan, Jiangsu, and Guangdong provinces showcase premium installations where grinding systems integrate with comprehensive feed manufacturing platforms and material handling systems to optimize production efficiency and processing effectiveness.
Chinese manufacturers prioritize high-volume capacity and cost-effective production, creating demand for locally manufactured systems with competitive pricing that meet domestic processing requirements. The market benefits from government support for agricultural modernization, livestock industry expansion, and rural industrialization programs that emphasize mechanical processing adoption. Domestic equipment manufacturers capture significant market share through aggressive pricing strategies, localized technical support, and customization capabilities tailored to Chinese agricultural processing characteristics.
Market Intelligence Brief:
South Korea demonstrates robust market development with a 4.8% CAGR, distinguished by specialty feed manufacturers and advanced food processors' preference for high-quality hammer mill systems that integrate seamlessly with existing production infrastructure and provide reliable long-term operation in specialized grinding applications. The market prioritizes advanced features, including precision particle control, automated operation, and integration with comprehensive processing platforms that reflect Korean industry expectations for technological sophistication and operational excellence.
Growth drivers encompass specialty animal feed production for intensive livestock operations, food processing industry modernization emphasizing quality control, and industrial material processing requiring precision grinding capabilities. Korean manufacturers emphasize automation integration, energy efficiency optimization, and comprehensive quality documentation that aligns with stringent domestic industry standards. The focus on premium processing equipment and technical excellence supports sustained growth driven by replacement cycles and capacity expansion in established processing facilities.
Strategic Market Indicators:
Japan demonstrates steady market development with a 4.0% CAGR, distinguished by food processors and pharmaceutical manufacturers' preference for high-precision hammer mill systems that deliver consistent particle size distribution and integrate seamlessly with quality control infrastructure. The market prioritizes advanced features, including sanitary construction, precise grinding control, and comprehensive documentation that reflect Japanese industry expectations for manufacturing excellence and product quality.
High-specification food processing and pharmaceutical applications drive demand, supported by automation technology integration and energy efficiency initiatives across major industrial regions including Kanto, Kansai, and Chubu. Japanese manufacturers emphasize equipment precision, hygienic design standards, and comprehensive quality certification that aligns with stringent industry requirements. The focus on premium applications and technical excellence supports stable growth despite mature market conditions, with replacement demand and process optimization driving equipment acquisitions.
Performance Metrics:
The U.S. market emphasizes advanced grinding features, including precision capacity control and integration with comprehensive agricultural platforms that manage feed formulation, processing optimization, and quality control applications through unified monitoring systems. The country demonstrates steady growth at 3.8% CAGR, driven by agricultural processing modernization, feed mill replacement cycles, and regulatory compliance requirements that support equipment upgrades across major agricultural states including Iowa, Nebraska, Kansas, Texas, and North Carolina.
American processors prioritize operational reliability with hammer mills delivering consistent grinding performance through proven mechanical design and automation integration capabilities. Technology deployment channels include major feed manufacturers, regional grain processors, and agricultural equipment distributors that support professional installations for complex feed production and grain milling applications. Processing platform integration capabilities with established agricultural systems expand market appeal across diverse operational requirements seeking efficiency and quality benefits.
Market Characteristics:
Brazil maintains steady expansion at 3.2% CAGR through diversified demand from feed production expansion, grain processing operations, and agricultural mechanization programs across major agricultural regions including Mato Grosso, Paraná, Rio Grande do Sul, and São Paulo. Major agricultural commodity production drives equipment adoption for livestock feed manufacturing, particularly for poultry and swine production, and crop processing applications supporting the country's position as a leading agricultural exporter.
Sugarcane bagasse processing and biomass utilization create sustained industrial demand for size reduction equipment in renewable energy applications. Poultry and swine production growth provides additional processing opportunities, with integrated livestock operations requiring on-site feed manufacturing capabilities. Government support for agricultural modernization through financing programs and rural development initiatives supports consistent market development, while export-oriented agricultural production drives quality improvement and processing efficiency investments.
Strategic Market Indicators:
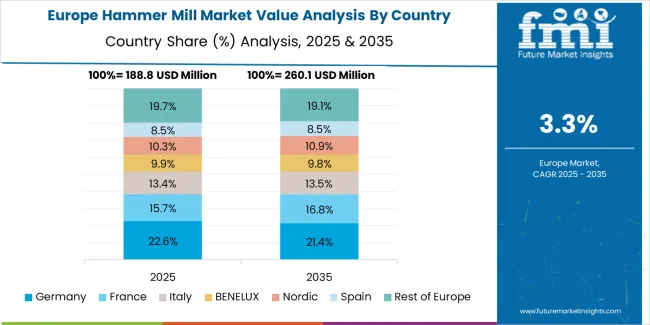
The European hammer mill market is estimated at USD 205.0 million in 2025, growing to USD 300.0 million by 2035, registering a CAGR of approximately 4.0% over the forecast period. Germany is expected to maintain its leadership position with a 22.0% market share in 2025, declining slightly to 21.5% by 2035, supported by high-quality engineering demand and industrial feed & biomass processing clusters across Bavaria and North Rhine-Westphalia.
France follows with a 13.5% share in 2025, projected to reach 14.0% by 2035, driven by agro-industry modernization and feed milling technology upgrades across major agricultural regions. The United Kingdom holds a 16.0% share in 2025, expected to moderate to 15.5% by 2035 through food processing equipment modernization and recycling material preparation applications. Italy commands an 11.0% share in 2025, rising to 11.2% by 2035 through pasta manufacturing, bakery processing, and specialty food sector investments.
Spain accounts for 8.5% in 2025, reaching 8.8% by 2035 aided by feed production growth and regional agro-processing expansion. The Netherlands maintains 6.0% share in 2025, increasing to 6.2% by 2035 driven by high-tech food processing and agricultural technology integration. The Rest of Europe region is anticipated to hold 23.0% in 2025, expanding to 22.8% by 2035, reflecting steady adoption across Central & Eastern European agricultural modernization programs, Nordic food processing investments, and emerging biomass processing facilities.
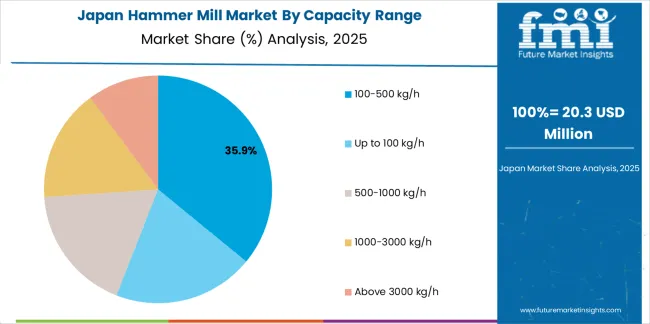
Japan demonstrates steady market development with a 4.0% CAGR, characterized by food processors and pharmaceutical manufacturers' strong preference for high-precision hammer mill systems that deliver exceptional particle size uniformity and integrate seamlessly with comprehensive quality control infrastructure. The Japanese market emphasizes advanced features including sanitary construction meeting strict hygiene standards, precise grinding control through sophisticated automation, and comprehensive documentation systems that reflect the country's renowned commitment to manufacturing excellence and product quality consistency.
High-specification food processing applications drive primary demand, particularly in specialty ingredients, functional foods, and premium bakery products requiring exact particle characteristics. Pharmaceutical manufacturing maintains significant equipment share through stringent sanitary design requirements and precision control capabilities essential for active ingredient processing and excipient preparation. The market benefits from automation technology integration across major industrial regions including Tokyo, Osaka, and Nagoya manufacturing zones, with energy efficiency initiatives supporting replacement of aging equipment.
Market Development Factors:
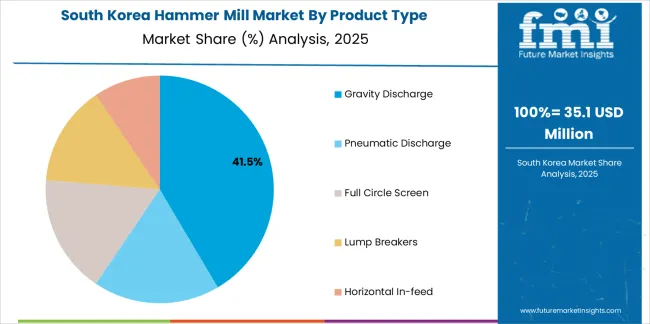
South Korea demonstrates robust market development with a 4.8% CAGR, distinguished by specialty feed manufacturers and advanced food processors' preference for sophisticated hammer mill systems that integrate seamlessly with existing production infrastructure through Industry 4.0 connectivity protocols. The Korean market emphasizes cutting-edge features including precision particle control through advanced sensor integration, comprehensive automation capabilities, and integration with manufacturing execution systems that reflect the country's leadership in industrial technology adoption and operational excellence.
Growth drivers encompass specialty animal feed production serving intensive poultry and swine operations requiring precise nutritional particle specifications, food processing industry modernization emphasizing quality control and production efficiency, and industrial material processing demanding precision grinding capabilities for specialty chemicals and advanced materials. Korean manufacturers prioritize automation integration, real-time quality monitoring, and energy efficiency optimization that aligns with stringent domestic environmental regulations and competitive manufacturing requirements.
Strategic Development Indicators:
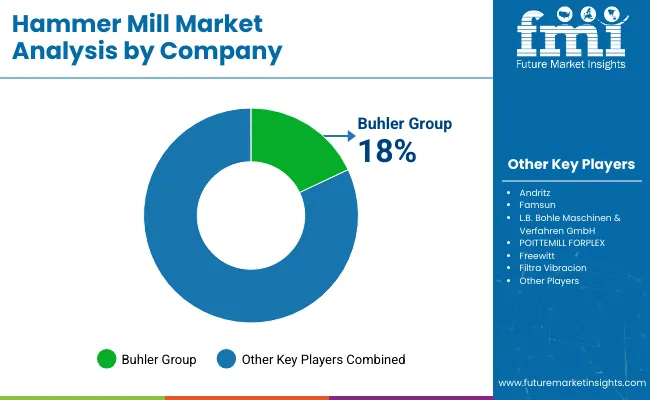
The Hammer Mill market operates with moderate concentration, featuring approximately 25-30 meaningful participants, where leading companies control roughly 45-55% of the global market share through established agricultural equipment relationships and comprehensive grinding technology portfolios. Competition emphasizes advanced mechanical design capabilities, operational reliability, and processing system integration rather than price-based rivalry. The leading company, Bühler Group, commands approximately 12.5% market share through its comprehensive milling systems product line and extensive food processing and agricultural industry presence.
Market Leaders encompass Bühler Group, Hosokawa Micron, and ANDRITZ, which maintain competitive advantages through extensive agricultural processing expertise, global equipment distribution networks, and comprehensive system integration capabilities that create customer relationships and support premium pricing. These companies leverage decades of mechanical engineering experience and ongoing research investments to develop advanced hammer mill systems with precision grinding control and automation features.
Technology Innovators include Schutte Hammermill, NETZSCH Group, and L.B. Bohle, which compete through specialized grinding technology focus and innovative equipment designs that appeal to processors seeking advanced particle size reduction capabilities and operational flexibility. These companies differentiate through rapid product development cycles and specialized application engineering focus. Regional Specialists feature companies like Famsun, Tietjen, Filtra Vibracion S.L., and Prater Industries, which focus on specific geographic markets and specialized applications, including cost-effective systems and integrated processing solutions.
| Item | Value |
|---|---|
| Quantitative Units | USD 751.3 million |
| Capacity Range | 100-500 kg/h, Up to 100 kg/h, 500-1000 kg/h, 1000-3000 kg/h, Above 3000 kg/h |
| Product Type | Gravity Discharge, Pneumatic Discharge, Full Circle Screen, Lump Breakers, Horizontal In-feed |
| End-Use Industry | Agriculture/Food & Feed, Metals & Mining, Energy & Power, Pharmaceuticals, Scrap Recycling/Chemicals/Others |
| Regions Covered | East Asia, Europe, North America, South Asia Pacific, Latin America, Middle East & Africa |
| Countries Covered | China, India, United States, Brazil, Germany, Japan, South Korea, and 25+ additional countries |
| Key Companies Profiled | Bühler Group, Hosokawa Micron, ANDRITZ, Schutte Hammermill, NETZSCH Group, L.B. Bohle, Famsun, Tietjen, Filtra Vibracion S.L., Prater Industries |
| Additional Attributes | Dollar sales by capacity range and end-use categories, regional adoption trends across East Asia, Europe, and North America, competitive landscape with equipment manufacturers and agricultural suppliers, processor preferences for grinding reliability and operational efficiency, integration with agricultural processing platforms and industrial quality monitoring systems, innovations in gravity discharge configurations and automation capabilities, and development of energy-efficient solutions with enhanced performance and processing optimization capabilities. |
The global hammer mill market is estimated to be valued at USD 751.3 million in 2025.
The market size for the hammer mill market is projected to reach USD 1,133.7 million by 2035.
The hammer mill market is expected to grow at a 4.2% CAGR between 2025 and 2035.
The key product types in hammer mill market are 100-500 kg/h, up to 100 kg/h, 500-1000 kg/h, 1000-3000 kg/h and above 3000 kg/h.
In terms of product type, gravity discharge segment to command 40.0% share in the hammer mill market in 2025.


Full Research Suite comprises of:
Market outlook & trends analysis
Interviews & case studies
Strategic recommendations
Vendor profiles & capabilities analysis
5-year forecasts
8 regions and 60+ country-level data splits
Market segment data splits
12 months of continuous data updates
DELIVERED AS:
PDF EXCEL ONLINE
Competitive Landscape of Hammer Mill Market Share
Demolition Hammers Market Size and Share Forecast Outlook 2025 to 2035
Cross Pein Hammer Market Size and Share Forecast Outlook 2025 to 2035
Counterblow Hammers Market Analysis - Size, Share, and Forecast Outlook 2025 to 2035
Millet Market Size and Share Forecast Outlook 2025 to 2035
Mill Pulverizer Market Size and Share Forecast Outlook 2025 to 2035
Mill Mixer Market Size and Share Forecast Outlook 2025 to 2035
Millimeter Wave Technology Market Size and Share Forecast Outlook 2025 to 2035
Millet Flour Market Analysis by Pearl Millet, Finger Millet, Foxtail Millet, Proso Millet, Kodo Millet, and Others Through 2035
Milling Machine Market Growth – Trends & Forecast 2025 to 2035
Millimeter Wave Sensors Market by Devices, Frequency Band, Application & Region Forecast till 2025 to 2035
Semillon Market
5G Millimeter Wave RF Transceiver Market Size and Share Forecast Outlook 2025 to 2035
End Mill Holders Market Size and Share Forecast Outlook 2025 to 2035
Dal Mill Machine Market Size and Share Forecast Outlook 2025 to 2035
Jet Mill Market Size and Share Forecast Outlook 2025 to 2035
Oil Mill Machine Market Size and Share Forecast Outlook 2025 to 2035
End Milling Machine Market Report - Demand, Growth & Industry Outlook 2025 to 2035
Road Milling Machine Market Analysis and Opportunity Assessment in India Size and Share Forecast Outlook 2025 to 2035
Rice Milling Machine Market Size and Share Forecast Outlook 2025 to 2035

Thank you!
You will receive an email from our Business Development Manager. Please be sure to check your SPAM/JUNK folder too.
Chat With
MaRIA