
- Market Size (2026)
- USD 3.9 Bn
- Forecast (2036)
- USD 7.7 Bn
- CAGR (2026 to 2036)
- 7.2%
How big is Harsh-Environment Connectors Market in 2026?
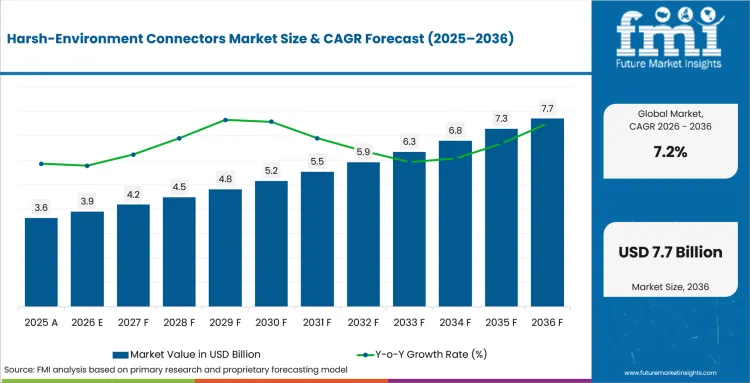
USD 3.9 billion in 2026 and USD 7.7 billion by 2036 at a 7.2% CAGR.
Demand for harsh-environment connectors is projected to expand at 7.2% CAGR between 2026 and 2036, increasing valuation from USD 3.9 billion in 2026 to USD 7.7 billion by 2036. New aircraft deliveries enlarge the installed platform base that requires qualified connector systems across production and later fleet support. GAMA reported in February 2026 that 2025 general aviation aircraft deliveries were valued at USD 35.7 billion worldwide. Each delivered aircraft adds installed aircraft cables that require support through scheduled maintenance and recurring equipment upgrades.
Long aircraft and defense programs favor approved aviation connectors as contact-system changes can reopen environmental testing and maintenance documentation. Rail and energy operators apply similar discipline to interfaces exposed to vibration and moisture throughout extended service intervals.
Key Takeaways of Harsh-Environment Connectors Market
- Aerospace and defense programs generate recurring orders as qualified connector families remain embedded throughout long equipment service lives.
- Circular connectors are projected to represent 28.0% share in 2026 owing to familiar coupling choices and configurable contacts.
- IP67 / IP68 connectors are estimated to hold 24.0% by environment in 2026 through clearly documented sealing criteria.
- Aluminum shells are forecast to capture 42.0% share in 2026 due to established aerospace specifications and lower weight.
- Platform-specific revalidation slows substitution as connector changes can reopen tooling reviews and environmental testing across approved equipment programs.
- Amphenol and TE Connectivity compete with players such as Molex and ITT Cannon through qualified product breadth and regional application support.
Analyst Perspective
"Connector manufacturers protect recurring revenue by keeping qualified contact systems stable across aircraft upgrades and depot repairs. Commercial advantage favors companies that document sealing performance and replace damaged assemblies through local repair channels without reopening platform approval."
- Nikhil Kaitwade, Principal Consultant, Future Market Insights
How is the Harsh-Environment Connectors Market segmented?
The harsh-environment connectors industry is segmented by connector type, environment rating, material, end use, sales channel and region.
The market uses connector type, environment rating, material, end use, sales channel and region to separate design and purchasing requirements. Connector type covers circular, rectangular, D-sub or Micro-D, fiber optic, RF or coaxial and hybrid power-signal formats. Environment ratings cover sealing, vibration, temperature, corrosion, EMI and hazardous areas while materials include aluminum, stainless steel, composite and brass or copper-alloy shells. End uses span aerospace and defense, automation, oil and gas, rail, marine and renewable energy through direct OEM, distribution, integration and aftermarket or MRO channels.
Why do circular connectors lead demand within the connector type category?
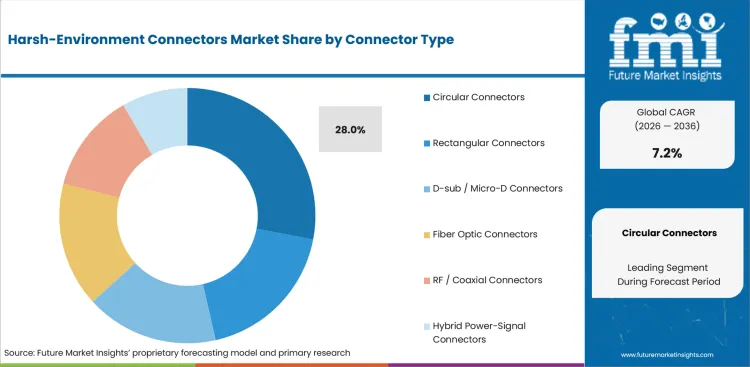
Circular connectors use threaded or bayonet interfaces that resist accidental separation across aircraft engines and rail vehicles exposed to continuous vibration. Standardized shell families also support removable contacts and serviceable backshells throughout lengthy qualification cycles for approved platforms.
- Based on connector type, circular connectors are projected to account for 28.0% in 2026 due to familiar coupling methods and broad contact configurations.
- Systems engineers favor electrical connector inserts that combine signal and power contacts inside serviceable shells for compact equipment layouts. Radiall introduced Fortero in February 2025 as a sealed MPO circular connector derived from a high-speed rail design for demanding defense environments.
How does IP67 / IP68 shape selection within the environment rating category?
IP67 / IP68 connectors protect interfaces from dust ingress and temporary water immersion across washdown equipment and exposed transportation controls. IEC published IEC 61076-8-112 in February 2025 with performance requirements and test methods for IP65 / IP67 power connectors.
- By environment rating, IP67 / IP68 connectors are estimated to hold 24.0% in 2026 owing to measurable ingress thresholds and familiar test documentation.
- Maintenance specialists select sealed housings for harsh-environment fiber optics that must preserve data integrity through repeated handling and outdoor service. Consistent ingress classifications give equipment designers a practical screening point for application-specific vibration and chemical testing.
How are aluminum shells positioned within the material category?
Aluminum shells reduce connector mass while preserving conductive shielding across airborne systems that cannot accept heavier stainless-steel housings during extended service. The material also supports machining routes that accommodate varied shell sizes and durable backshell interfaces.
- In 2026, aluminum shell connectors are expected to lead the material category with 42.0% share because established specifications support favorable strength-to-weight performance. Molex reported in April 2025 that aluminum alloys balance low weight with strong EMI shielding and machinability in aerospace connector housings.
- Platform engineers select aluminum housings around RF connectors to maintain shielding continuity without the mass penalty of stainless steel during maintenance and major equipment upgrades.
What makes aerospace and defense central to the end use category?
Defense program offices require connector records that remain traceable through equipment upgrades and field repairs. ITT Cannon’s January 2025 United States Army qualification for MKJ Warrior connectors documented the approval route for power and data links in soldier-worn communications equipment.
- The end use category is forecast to be led by aerospace and defense at 31.0% share in 2026 due to strict documentation and platform-specific testing.
- Program offices integrate wire harnesses with approved contact systems to simplify replacement planning across depot repairs and scheduled modernization programs. Stable configuration records reduce the risk that replacement connectors force wider system testing during future upgrades.
What are the drivers, restraints and opportunities in the Harsh-Environment Connectors Market?
Qualification records sustain repeat orders while platform revalidation slows substitution and regional repair support improves integrated assembly adoption.
- Driver: Current qualification records direct repeat aerospace and defense orders toward connector families with verified environmental performance.
- Restraint: Platform-specific revalidation raises conversion costs across installed equipment with long maintenance and certification cycles.
- Opportunity: Integrated assemblies and regional repair support reduce installation risk across dispersed fleets and remote industrial assets.
Military and aerospace programs screen connector families through current qualification records during major repeat-order reviews. The DLA’s July 2026 MIL-DTL-38999 listing provides an active approval route for environment-resistant circular connectors and cable assemblies.
Platform owners compare mating geometry and crimp tooling during proposed connector-family replacements across installed equipment. Requalification can preserve incumbent positions despite stronger electrical performance from a competing connector design across approved platforms.
Manufacturers package connectors with terminated cables and backshells inside one supported configuration for easier field replacement. Installation teams use aerospace conduit systems and regional repair routes to protect terminations across dispersed fleets and remote industrial assets.
Which country CAGRs are profiled in the Harsh-Environment Connectors Market?
| Country | CAGR |
|---|---|
| United States | 6.2% |
| Germany | 5.8% |
| Japan | 5.5% |
| France | 6.8% |
| United Kingdom | 6.5% |
How do country-level CAGRs compare in the Harsh-Environment Connectors Market?
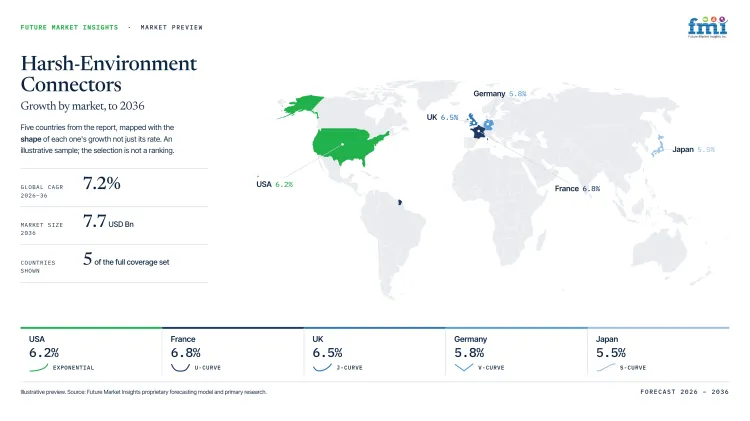
The spread reaches 1.3 percentage points between France at 6.8% CAGR and Japan at 5.5% CAGR. Relative spacing reflects qualification routes and service-network depth rather than differences in current market size alone.
- France's rate exceeds the United Kingdom by 0.3 percentage point as specialized aerospace engineering supports interconnect qualification.
- The United Kingdom exceeds the United States by 0.3 percentage point through backlogs and established maintenance capability.
- The United States exceeds Germany by 0.4 percentage point as naval investment supports new qualification work.
- Germany exceeds Japan by 0.3 percentage point as labor shortages regionally slow customized assembly deliveries.
- Japan's rate reflects disciplined validation and slower line-specific approval across domestic manufacturing and maintenance programs.
Comparable CAGRs can produce different market entry conditions. The full report provides country-level CAGR analysis across North America, Latin America, Europe, East Asia, South Asia and Pacific, and the Middle East and Africa.
Country-wise Analysis
- United States naval and aerospace programs rely on domestically qualified interconnect systems and authorized technical support across major shipbuilding programs and long depot-maintenance cycles for controlled military platforms. The Navy linked fleet expansion to a USD 65.8 billion fiscal 2027 shipbuilding request in May 2026. Harsh-environment connector sales in the United States are forecast to expand at 6.2% CAGR by 2036 due to new platform work and accessible military qualification routes. Lengthy approvals remain a material friction as alternate connector families require renewed environmental testing and tooling reviews under existing configuration records for controlled production and depot maintenance across regional depots.
- German aerospace manufacturers use detailed engineering approvals and traceable component records across civil and defense programs supported by specialist distributors and regional repair capability for long-term maintenance contracts. Germany's harsh-environment connector outlook is anticipated to advance at 5.8% CAGR over the assessment period supported by continuing aerospace production ramp-up for qualified connector assemblies. BDLI's May 2026 industry data recorded a 19% increase in 2025 aerospace revenue as manufacturers expanded output and employment. Fragile supply chains and skilled-worker shortages remain material frictions that can delay customized assembly qualification and reduce delivery confidence across scheduled production increases at regional production sites during peak periods.
- Japanese aerospace and rail manufacturers emphasize consistent quality records and domestic coordination across component validation and long-term maintenance planning supported by experienced integrators and disciplined production systems. The Society of Japanese Aerospace Companies published May 2026 trade data showing 2025 aerospace exports reached 113.6% of the prior-year level across aircraft and space programs. Harsh-environment connector demand in Japan is forecast to rise at 5.5% CAGR over the forecast period owing to controlled production growth and dependable domestic engineering support. Line-specific validation and service distance remain material frictions that complicate crimping and shielding procedures across dispersed sites and factories during extended equipment lifecycles and scheduled maintenance programs.
- French aerospace clusters combine aircraft production with defense electronics and specialized interconnect engineering supported by dense distributor and maintenance networks across established regional manufacturing sites and extended aircraft support programs. The French harsh-environment connector sector is projected to record 6.8% CAGR during the assessment period driven by sustained civil and defense activity across qualified platform programs. GIFAS stated in May 2026 that 2025 aerospace revenue increased 11.9% as manufacturers continued industrial ramp-up. Technical hiring constraints remain a material friction that can lengthen testing queues and customized cable-assembly deliveries across regional production clusters during planned output increases and maintenance schedules at regional depots.
- United Kingdom aerospace programs combine long aircraft backlogs with established design engineering and experienced MRO providers across civil and defense supply chains supporting extended production and fleet maintenance cycles. ADS Group's February 2026 delivery review placed the commercial aircraft backlog at 16,371 units and more than thirteen years of work for the United Kingdom aerospace sector. Adoption of harsh-environment connectors in the United Kingdom is estimated to expand at 6.5% CAGR through 2036 attributable to sustained production schedules and established maintenance capability. Supply-chain pressure remains a material friction as approved component availability can tighten during production ramp-ups and unexpected maintenance demand across dispersed fleets.
Who are the notable companies in the Harsh-Environment Connectors Market?
Amphenol, TE Connectivity, Molex, ITT Cannon, Smiths Interconnect, a Molex company, Souriau-Sunbank by Eaton, Radiall, Hirose Electric and Glenair serve this market.
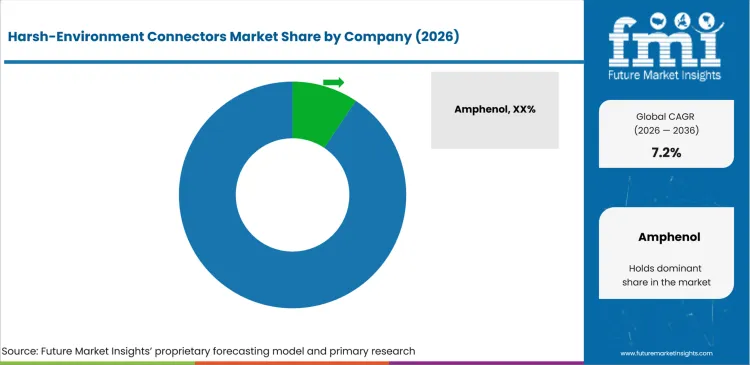
The industry is moderately concentrated around interconnect groups, while specialists retain niches and entry into rugged terminal systems requires qualified specifications plus regional engineering support.
- Amphenol and TE Connectivity compete through military circular portfolios and regional engineering support for demanding platform specifications.
- Molex and ITT Cannon combine rugged connectors with high-speed contacts while Smiths Interconnect adds precision RF capabilities.
- Souriau-Sunbank by Eaton and Radiall address qualified circular applications alongside alternatives from Hirose Electric and Glenair.
Competitive Benchmarking: Harsh-Environment Connectors Market
| Company | Qualification Breadth | Environmental Sealing | Platform Traceability | Geographic Reach |
|---|---|---|---|---|
| Amphenol | High | High | High | Global |
| TE Connectivity | High | High | High | Global |
| Molex | High | High | Medium | Global |
| ITT Cannon | Medium | High | High | Global |
| Smiths Interconnect, a Molex company | Medium | Medium | Medium | Global |
| Souriau-Sunbank by Eaton | High | High | High | Global |
| Radiall | Medium | High | Medium | Global |
| Glenair | High | High | High | North America, Europe and Asia |
Scoring basis: Qualification breadth is High for three rugged families, Medium for two and Low for one verified family. Environmental sealing and platform traceability apply those thresholds to verified sealing classes and documented support routes. Geographic reach lists operating regions while company records support ratings and missing evidence receives no score.
Key Developments in the Harsh-Environment Connectors Market
- In July 2026, ITT completed its acquisition of Aerospace Contacts and strengthened supply for custom high-reliability contacts and shells used in harsh-environment connector programs.
- In June 2026, Molex expanded the AirBorn SInergy platform with high-power modules that combine power and data and RF contacts for harsh aerospace and defense systems.
- In April 2026, Molex completed its acquisition of Smiths Interconnect and expanded rugged connector capabilities across RF and optical technologies within 90 plants in 22 countries.
- In June 2025, TE Connectivity launched the MULTIGIG transceiver platform for modular high-speed fiber transmission across rugged aerospace and defense systems.
Harsh-Environment Connectors Market - Report Scope
| Coverage field | Report scope |
|---|---|
| Market breakdown | By connector type, environment rating, material, end use, sales channel and region. |
| Quantitative Units | Revenue in USD billion and CAGR in %. |
| Market Definition | The market covers revenue from harsh-environment connector products and assemblies supplied for applications requiring documented environmental performance. |
| Regions Covered | North America, Latin America, Europe, East Asia, South Asia and Pacific and Middle East and Africa. |
| Countries Covered | United States, Germany, Japan, France, United Kingdom and 20+ countries included in the full report. |
| Key Companies Profiled | Amphenol, TE Connectivity, Molex, ITT Cannon, Smiths Interconnect, a Molex company, Souriau-Sunbank by Eaton, Radiall, Hirose Electric and Glenair. |
| Forecast Period | 2026 to 2036. |
| Approach | Primary and secondary research with market triangulation. |
Harsh-Environment Connectors Market - Research Methodology
| Method | Approach |
|---|---|
| Primary Research | FMI analysts gathered input from manufacturers, service providers, technology developers, distributors, end users, procurement teams, and subject-matter experts. Interviews examined purchasing decisions, product or service evaluation, adoption barriers, approval requirements, pricing considerations, and expectations for technical or commercial support. Respondents were also asked what evidence is required before a trial, pilot, or initial order develops into regular purchasing. |
| Desk Research | Desk research covered government statistics, regulatory publications, trade data, industry associations, technical literature, standards, company filings, product information, and official corporate announcements. Sources were reviewed for relevance, publication date, geographic coverage, and consistency with the defined market scope. Claims relating to performance, applications, approvals, capacity, investment, and commercial activity were retained only when supported by credible public evidence. |
| Market Sizing and Forecasting | The market model combined the baseline value with historical performance, segment structure, pricing and volume indicators, adoption levels, company participation, and country-level demand conditions. Forecast assumptions considered economic activity, investment trends, regulatory developments, technology adoption, purchasing cycles, supply availability, and barriers to wider market use. Segment and regional estimates were reconciled before the final market total was calculated. |
| Data Validation | Estimates were checked against multiple independent indicators, including public data, company activity, trade patterns, industry developments, and findings from primary interviews. Validation also tested whether products, services, applications, and company revenues fell within the defined market boundaries. Adjacent categories, unsupported claims, overlapping revenues, and activities without direct market relevance were excluded to reduce double counting and maintain consistency across segments and countries. |
Harsh-Environment Connectors Market by Segments
Harsh-Environment Connectors Market segmented by Connector Type:
- Circular Connectors
- Rectangular Connectors
- D-sub / Micro-D Connectors
- Fiber Optic Connectors
- RF / Coaxial Connectors
- Hybrid Power-Signal Connectors
Harsh-Environment Connectors Market segmented by Environment Rating:
- IP67 / IP68
- High Vibration
- High Temperature
- Corrosion Resistant
- EMI Shielded
- Explosion-proof / Hazardous Area
Harsh-Environment Connectors Market segmented by Material:
- Aluminum Shell
- Stainless Steel Shell
- Composite Shell
- Brass / Copper Alloy Shell
Harsh-Environment Connectors Market segmented by End Use:
- Aerospace & Defense
- Industrial Automation
- Oil & Gas
- Rail & Transportation
- Marine
- Renewable Energy
Harsh-Environment Connectors Market segmented by Sales Channel:
- Direct OEM
- Authorized Distributors
- System Integrators
- Aftermarket / MRO
Harsh-Environment Connectors Market by Region:
- North America
- United States
- Canada
- Latin America
- Brazil
- Mexico
- Argentina
- Chile
- Western Europe
- Germany
- France
- United Kingdom
- Italy
- Spain
- Benelux
- Nordics
- Eastern Europe
- Poland
- Czech Republic
- Romania
- Hungary
- East Asia
- China
- Japan
- South Korea
- South Asia and Pacific
- India
- ASEAN
- Australia and New Zealand
- Middle East and Africa
- GCC Countries
- South Africa
- Türkiye
- Israel
Research Sources and Bibliography
- General Aviation Manufacturers Association. (2026, February 18). GAMA Releases 2025 Aircraft Shipment and Billing Report.
- Defense Logistics Agency Land and Maritime. (2026, July 20). MIL-DTL-38999 qualification information.
- Molex. (2025, April 1). Molex releases new report on strategies for advancing rugged, reliable connectivity in modern aerospace and defense applications.
- Molex. (2026, June 15). Molex expands award-winning AirBorn SInergy modular high-speed hybrid connectors with new high-power modules for all-in-one connectivity.
- ITT Inc. (2025, January 14). ITT Cannon connectors receive USA Army qualification on Nett Warrior program.
- USA Department of the Navy. (2026, May 11). Department of the Navy releases fiscal year 2027 shipbuilding plan.
- German Aerospace Industries Association. (2026, May 27). BDLI Industry Data 2026: Aerospace industry sets new records for revenue and employment.
- Society of Japanese Aerospace Companies. (2026, May 14).[Trade statistics, January-December 2025].
- GIFAS. (2026, May 11). 2025 results: The French aerospace industry remains strongly positioned for the future.
- ADS Group. (2026, February 3). 2025 global aircraft deliveries at highest peak in seven years.
- ITT Inc. (2026, July 6). ITT completes acquisition of Aerospace Contacts LLC.
- Molex. (2026, April 1). Molex completes acquisition of Smiths Interconnect, expanding portfolio of high-reliability connectivity solutions.
- Radiall. (2025, February 18). Introducing a new MPO circular connector for demanding applications.
- International Electrotechnical Commission. (2025, February 6). IEC 61076-8-112:2025: Connectors for electrical and electronic equipment - Product requirements - Part 8-112: Power connectors - Detail specification for 2-pole snap locking rectangular connectors with IP65/IP67 plastic housing for rated current of 50 A.
- TE Connectivity. (2025, June 18). TE Connectivity unveils MULTIGIG Transceiver platform for improved data transmission.
- Eaton Corporation plc. (2026, February 26). 2025 annual report on Form 10-K: Exhibit 21, subsidiaries of Eaton Corporation plc.
- Amphenol. (2025, April 15). Now available: 6-pin AT circular connector built for extreme conditions.
- Glenair. (2025, January). Industrial-strength interconnect solutions.
- Hirose Electric Co., Ltd. (2025, June 17). Releases new waterproof version of IEC-compliant ix Industrial™ connector.
This bibliography is provided for reader reference and is not exhaustive. The full report contains the complete reference list and detailed citations
This Report Answers
- How large is the harsh-environment connectors market in 2026 and 2036?
- Which operating conditions support demand for harsh-environment connectors across critical applications?
- Which connector type is projected to account for the largest 2026 share?
- How do environment ratings influence commercial selection across exposed equipment programs?
- Which end-use category shapes qualification and replacement activity through 2036?
- How do profiled country growth rates differ across major aerospace markets?
- Which companies serve the harsh-environment connectors market through qualified portfolios?
- What currently limits connector substitution across long equipment service programs?
- How should engineers compare connector materials and termination support requirements?
Table of Content
Table of Content
- Key Takeaways
- Market Size and CAGR
- Top Growth Driver
- Fastest Growing Segment
- Leading Region
- Key Companies
- Emerging Opportunities
- Executive Summary
- Global Market Outlook
- Demand-side Trends
- Supply-side Trends
- Technology Roadmap Analysis
- Analysis and Recommendations
- Analyst Perspective (What is happening? Why now? What should investors know?)
- Key Questions Answered
- How large is the market?
- What is the CAGR?
- What are key trends?
- Which region dominates?
- Who are the leaders?
Read More...
- Market Overview
- Market Coverage / Taxonomy
- Market Definition / Scope / Limitations
- Research Methodology
- Chapter Orientation
- Analytical Lens and Working Hypotheses
- Market Structure, Signals, and Trend Drivers
- Benchmarking and Cross-market Comparability
- Market Sizing, Forecasting, and Opportunity Mapping
- Research Design and Evidence Framework
- Desk Research Programme (Secondary Evidence)
- Expert Input and Fieldwork (Primary Evidence)
- Tooling, Models, and Reference Databases
- Data Engineering and Model Build
- Quality Assurance and Audit Trail
- Market Background
- Market Dynamics (Drivers, Restraints, Opportunity, Trends)
- Scenario Forecast (Optimistic, Likely, Conservative)
- Impact Analysis
- AI Impact
- Sustainability Impact
- Regulatory Impact
- Technology Impact
- Consumer / Buyer Analysis
- Purchase Drivers
- Adoption Barriers
- Buyer Journey
- Opportunity Map Analysis
- Product Life Cycle Analysis
- Supply Chain Analysis
- Investment Feasibility Matrix
- Value Chain Analysis
- PESTLE and Porter's Analysis
- Regulatory Landscape
- Regional Parent Market Outlook
- Production and Consumption Statistics
- Import and Export Statistics
- Global Market Analysis and Forecast, 2021 to 2036
- Historical Market Size Value (USD Billion) Analysis, 2021 to 2025
- Current and Future Market Size Value (USD Billion) Projections, 2026 to 2036
- Y-o-Y Growth Trend Analysis
- Absolute $ Opportunity Analysis
- Global Market Pricing Analysis, 2021 to 2036
- Global Market Analysis and Forecast, By Connector Type, 2021 to 2036
- Introduction / Key Findings
- Historical Market Size Value (USD Billion) Analysis By Connector Type, 2021 to 2025
- Current and Future Market Size Value (USD Billion) Analysis and Forecast By Connector Type, 2026 to 2036
- Circular Connectors
- Rectangular Connectors
- D-sub / Micro-D Connectors
- Fiber Optic Connectors
- RF / Coaxial Connectors
- Hybrid Power-Signal Connectors
- Circular Connectors
- Y-o-Y Growth Trend Analysis By Connector Type, 2021 to 2025
- Absolute $ Opportunity Analysis By Connector Type, 2026 to 2036
- Global Market Analysis and Forecast, By Environment Rating, 2021 to 2036
- Introduction / Key Findings
- Historical Market Size Value (USD Billion) Analysis By Environment Rating, 2021 to 2025
- Current and Future Market Size Value (USD Billion) Analysis and Forecast By Environment Rating, 2026 to 2036
- IP67 / IP68
- High Vibration
- High Temperature
- Corrosion Resistant
- EMI Shielded
- Explosion-proof / Hazardous Area
- IP67 / IP68
- Y-o-Y Growth Trend Analysis By Environment Rating, 2021 to 2025
- Absolute $ Opportunity Analysis By Environment Rating, 2026 to 2036
- Global Market Analysis and Forecast, By Material, 2021 to 2036
- Introduction / Key Findings
- Historical Market Size Value (USD Billion) Analysis By Material, 2021 to 2025
- Current and Future Market Size Value (USD Billion) Analysis and Forecast By Material, 2026 to 2036
- Aluminum Shell
- Stainless Steel Shell
- Composite Shell
- Brass / Copper Alloy Shell
- Aluminum Shell
- Y-o-Y Growth Trend Analysis By Material, 2021 to 2025
- Absolute $ Opportunity Analysis By Material, 2026 to 2036
- Global Market Analysis and Forecast, By End Use, 2021 to 2036
- Introduction / Key Findings
- Historical Market Size Value (USD Billion) Analysis By End Use, 2021 to 2025
- Current and Future Market Size Value (USD Billion) Analysis and Forecast By End Use, 2026 to 2036
- Aerospace & Defense
- Industrial Automation
- Oil & Gas
- Rail & Transportation
- Marine
- Renewable Energy
- Aerospace & Defense
- Y-o-Y Growth Trend Analysis By End Use, 2021 to 2025
- Absolute $ Opportunity Analysis By End Use, 2026 to 2036
- Global Market Analysis and Forecast, By Sales Channel, 2021 to 2036
- Introduction / Key Findings
- Historical Market Size Value (USD Billion) Analysis By Sales Channel, 2021 to 2025
- Current and Future Market Size Value (USD Billion) Analysis and Forecast By Sales Channel, 2026 to 2036
- Direct OEM
- Authorized Distributors
- System Integrators
- Aftermarket / MRO
- Direct OEM
- Y-o-Y Growth Trend Analysis By Sales Channel, 2021 to 2025
- Absolute $ Opportunity Analysis By Sales Channel, 2026 to 2036
- Global Market Analysis and Forecast, By Region, 2021 to 2036
- Introduction
- Historical Market Size Value (USD Billion) Analysis By Region, 2021 to 2025
- Current Market Size Value (USD Billion) Analysis and Forecast By Region, 2026 to 2036
- North America
- Latin America
- Western Europe
- Eastern Europe
- East Asia
- South Asia and Pacific
- Middle East & Africa
- Market Attractiveness Analysis By Region
- North America Market Analysis and Forecast, By Country, 2021 to 2036
- Historical Market Size Value (USD Billion) Trend Analysis By Market Taxonomy, 2021 to 2025
- Market Size Value (USD Billion) Forecast By Market Taxonomy, 2026 to 2036
- By Country
- USA
- Canada
- By Connector Type
- By Environment Rating
- By Material
- By End Use
- By Sales Channel
- By Country
- Market Attractiveness Analysis
- By Country
- By Connector Type
- By Environment Rating
- By Material
- By End Use
- By Sales Channel
- Key Takeaways
- Latin America Market Analysis and Forecast, By Country
- Historical Market Size Value (USD Billion) Trend Analysis By Market Taxonomy, 2021 to 2025
- Market Size Value (USD Billion) Forecast By Market Taxonomy, 2026 to 2036
- By Country
- Brazil
- Mexico
- Chile
- Rest of Latin America
- By Connector Type
- By Environment Rating
- By Material
- By End Use
- By Sales Channel
- By Country
- Market Attractiveness Analysis
- By Country
- By Connector Type
- By Environment Rating
- By Material
- By End Use
- By Sales Channel
- Key Takeaways
- Western Europe Market Analysis and Forecast, By Country
- Historical Market Size Value (USD Billion) Trend Analysis By Market Taxonomy, 2021 to 2025
- Market Size Value (USD Billion) Forecast By Market Taxonomy, 2026 to 2036
- By Country
- Germany
- UK
- Italy
- Spain
- France
- Nordic
- BENELUX
- Rest of Western Europe
- By Connector Type
- By Environment Rating
- By Material
- By End Use
- By Sales Channel
- By Country
- Market Attractiveness Analysis
- By Country
- By Connector Type
- By Environment Rating
- By Material
- By End Use
- By Sales Channel
- Key Takeaways
- Eastern Europe Market Analysis and Forecast, By Country
- Historical Market Size Value (USD Billion) Trend Analysis By Market Taxonomy, 2021 to 2025
- Market Size Value (USD Billion) Forecast By Market Taxonomy, 2026 to 2036
- By Country
- Russia
- Poland
- Hungary
- Balkan & Baltic
- Rest of Eastern Europe
- By Connector Type
- By Environment Rating
- By Material
- By End Use
- By Sales Channel
- By Country
- Market Attractiveness Analysis
- By Country
- By Connector Type
- By Environment Rating
- By Material
- By End Use
- By Sales Channel
- Key Takeaways
- East Asia Market Analysis and Forecast, By Country
- Historical Market Size Value (USD Billion) Trend Analysis By Market Taxonomy, 2021 to 2025
- Market Size Value (USD Billion) Forecast By Market Taxonomy, 2026 to 2036
- By Country
- China
- Japan
- South Korea
- By Connector Type
- By Environment Rating
- By Material
- By End Use
- By Sales Channel
- By Country
- Market Attractiveness Analysis
- By Country
- By Connector Type
- By Environment Rating
- By Material
- By End Use
- By Sales Channel
- Key Takeaways
- South Asia and Pacific Market Analysis and Forecast, By Country
- Historical Market Size Value (USD Billion) Trend Analysis By Market Taxonomy, 2021 to 2025
- Market Size Value (USD Billion) Forecast By Market Taxonomy, 2026 to 2036
- By Country
- India
- ASEAN
- Australia & New Zealand
- Rest of South Asia and Pacific
- By Connector Type
- By Environment Rating
- By Material
- By End Use
- By Sales Channel
- By Country
- Market Attractiveness Analysis
- By Country
- By Connector Type
- By Environment Rating
- By Material
- By End Use
- By Sales Channel
- Key Takeaways
- Middle East & Africa Market Analysis and Forecast, By Country
- Historical Market Size Value (USD Billion) Trend Analysis By Market Taxonomy, 2021 to 2025
- Market Size Value (USD Billion) Forecast By Market Taxonomy, 2026 to 2036
- By Country
- Kingdom of Saudi Arabia
- Other GCC Countries
- Türkiye
- South Africa
- Other African Union
- Rest of Middle East & Africa
- By Connector Type
- By Environment Rating
- By Material
- By End Use
- By Sales Channel
- By Country
- Market Attractiveness Analysis
- By Country
- By Connector Type
- By Environment Rating
- By Material
- By End Use
- By Sales Channel
- Key Takeaways
- Key Countries Market Analysis
- USA
- Pricing Analysis
- Market Share Analysis, 2025
- By Connector Type
- By Environment Rating
- By Material
- By End Use
- By Sales Channel
- Canada
- Pricing Analysis
- Market Share Analysis, 2025
- By Connector Type
- By Environment Rating
- By Material
- By End Use
- By Sales Channel
- Mexico
- Pricing Analysis
- Market Share Analysis, 2025
- By Connector Type
- By Environment Rating
- By Material
- By End Use
- By Sales Channel
- Brazil
- Pricing Analysis
- Market Share Analysis, 2025
- By Connector Type
- By Environment Rating
- By Material
- By End Use
- By Sales Channel
- Chile
- Pricing Analysis
- Market Share Analysis, 2025
- By Connector Type
- By Environment Rating
- By Material
- By End Use
- By Sales Channel
- Germany
- Pricing Analysis
- Market Share Analysis, 2025
- By Connector Type
- By Environment Rating
- By Material
- By End Use
- By Sales Channel
- UK
- Pricing Analysis
- Market Share Analysis, 2025
- By Connector Type
- By Environment Rating
- By Material
- By End Use
- By Sales Channel
- Italy
- Pricing Analysis
- Market Share Analysis, 2025
- By Connector Type
- By Environment Rating
- By Material
- By End Use
- By Sales Channel
- Spain
- Pricing Analysis
- Market Share Analysis, 2025
- By Connector Type
- By Environment Rating
- By Material
- By End Use
- By Sales Channel
- France
- Pricing Analysis
- Market Share Analysis, 2025
- By Connector Type
- By Environment Rating
- By Material
- By End Use
- By Sales Channel
- India
- Pricing Analysis
- Market Share Analysis, 2025
- By Connector Type
- By Environment Rating
- By Material
- By End Use
- By Sales Channel
- ASEAN
- Pricing Analysis
- Market Share Analysis, 2025
- By Connector Type
- By Environment Rating
- By Material
- By End Use
- By Sales Channel
- Australia & New Zealand
- Pricing Analysis
- Market Share Analysis, 2025
- By Connector Type
- By Environment Rating
- By Material
- By End Use
- By Sales Channel
- China
- Pricing Analysis
- Market Share Analysis, 2025
- By Connector Type
- By Environment Rating
- By Material
- By End Use
- By Sales Channel
- Japan
- Pricing Analysis
- Market Share Analysis, 2025
- By Connector Type
- By Environment Rating
- By Material
- By End Use
- By Sales Channel
- South Korea
- Pricing Analysis
- Market Share Analysis, 2025
- By Connector Type
- By Environment Rating
- By Material
- By End Use
- By Sales Channel
- Russia
- Pricing Analysis
- Market Share Analysis, 2025
- By Connector Type
- By Environment Rating
- By Material
- By End Use
- By Sales Channel
- Poland
- Pricing Analysis
- Market Share Analysis, 2025
- By Connector Type
- By Environment Rating
- By Material
- By End Use
- By Sales Channel
- Hungary
- Pricing Analysis
- Market Share Analysis, 2025
- By Connector Type
- By Environment Rating
- By Material
- By End Use
- By Sales Channel
- Kingdom of Saudi Arabia
- Pricing Analysis
- Market Share Analysis, 2025
- By Connector Type
- By Environment Rating
- By Material
- By End Use
- By Sales Channel
- Türkiye
- Pricing Analysis
- Market Share Analysis, 2025
- By Connector Type
- By Environment Rating
- By Material
- By End Use
- By Sales Channel
- South Africa
- Pricing Analysis
- Market Share Analysis, 2025
- By Connector Type
- By Environment Rating
- By Material
- By End Use
- By Sales Channel
- USA
- Market Structure Analysis
- Competition Dashboard
- Competition Benchmarking
- Market Share Analysis of Top Players
- By Regional
- By Connector Type
- By Environment Rating
- By Material
- By End Use
- By Sales Channel
- Emerging Startups
- Innovation Benchmarking
- Competition Analysis
- Competition Deep Dive
- Amphenol
- Overview
- Product Portfolio
- Profitability by Market Segments
- Sales Footprint
- Strategy Overview
- Marketing Strategy
- Product Strategy
- Channel Strategy
- TE Connectivity
- Molex
- ITT Cannon
- Smiths Interconnect
- Eaton
- Souriau / Eaton
- Radiall
- Hirose Electric
- Glenair
- Amphenol
- Case Studies
- Success Stories
- Recent Developments
- Competition Deep Dive
- Assumptions & Acronyms Used
List of Tables
- Table 1: Global Market Value (USD Billion) Forecast by Region, 2021 to 2036
- Table 2: Global Market Value (USD Billion) Forecast by Connector Type, 2021 to 2036
- Table 3: Global Market Value (USD Billion) Forecast by Environment Rating, 2021 to 2036
- Table 4: Global Market Value (USD Billion) Forecast by Material, 2021 to 2036
- Table 5: Global Market Value (USD Billion) Forecast by End Use, 2021 to 2036
- Table 6: Global Market Value (USD Billion) Forecast by Sales Channel, 2021 to 2036
- Table 7: North America Market Value (USD Billion) Forecast by Country, 2021 to 2036
- Table 8: North America Market Value (USD Billion) Forecast by Connector Type, 2021 to 2036
- Table 9: North America Market Value (USD Billion) Forecast by Environment Rating, 2021 to 2036
- Table 10: North America Market Value (USD Billion) Forecast by Material, 2021 to 2036
- Table 11: North America Market Value (USD Billion) Forecast by End Use, 2021 to 2036
- Table 12: North America Market Value (USD Billion) Forecast by Sales Channel, 2021 to 2036
- Table 13: Latin America Market Value (USD Billion) Forecast by Country, 2021 to 2036
- Table 14: Latin America Market Value (USD Billion) Forecast by Connector Type, 2021 to 2036
- Table 15: Latin America Market Value (USD Billion) Forecast by Environment Rating, 2021 to 2036
- Table 16: Latin America Market Value (USD Billion) Forecast by Material, 2021 to 2036
- Table 17: Latin America Market Value (USD Billion) Forecast by End Use, 2021 to 2036
- Table 18: Latin America Market Value (USD Billion) Forecast by Sales Channel, 2021 to 2036
- Table 19: Western Europe Market Value (USD Billion) Forecast by Country, 2021 to 2036
- Table 20: Western Europe Market Value (USD Billion) Forecast by Connector Type, 2021 to 2036
- Table 21: Western Europe Market Value (USD Billion) Forecast by Environment Rating, 2021 to 2036
- Table 22: Western Europe Market Value (USD Billion) Forecast by Material, 2021 to 2036
- Table 23: Western Europe Market Value (USD Billion) Forecast by End Use, 2021 to 2036
- Table 24: Western Europe Market Value (USD Billion) Forecast by Sales Channel, 2021 to 2036
- Table 25: Eastern Europe Market Value (USD Billion) Forecast by Country, 2021 to 2036
- Table 26: Eastern Europe Market Value (USD Billion) Forecast by Connector Type, 2021 to 2036
- Table 27: Eastern Europe Market Value (USD Billion) Forecast by Environment Rating, 2021 to 2036
- Table 28: Eastern Europe Market Value (USD Billion) Forecast by Material, 2021 to 2036
- Table 29: Eastern Europe Market Value (USD Billion) Forecast by End Use, 2021 to 2036
- Table 30: Eastern Europe Market Value (USD Billion) Forecast by Sales Channel, 2021 to 2036
- Table 31: East Asia Market Value (USD Billion) Forecast by Country, 2021 to 2036
- Table 32: East Asia Market Value (USD Billion) Forecast by Connector Type, 2021 to 2036
- Table 33: East Asia Market Value (USD Billion) Forecast by Environment Rating, 2021 to 2036
- Table 34: East Asia Market Value (USD Billion) Forecast by Material, 2021 to 2036
- Table 35: East Asia Market Value (USD Billion) Forecast by End Use, 2021 to 2036
- Table 36: East Asia Market Value (USD Billion) Forecast by Sales Channel, 2021 to 2036
- Table 37: South Asia and Pacific Market Value (USD Billion) Forecast by Country, 2021 to 2036
- Table 38: South Asia and Pacific Market Value (USD Billion) Forecast by Connector Type, 2021 to 2036
- Table 39: South Asia and Pacific Market Value (USD Billion) Forecast by Environment Rating, 2021 to 2036
- Table 40: South Asia and Pacific Market Value (USD Billion) Forecast by Material, 2021 to 2036
- Table 41: South Asia and Pacific Market Value (USD Billion) Forecast by End Use, 2021 to 2036
- Table 42: South Asia and Pacific Market Value (USD Billion) Forecast by Sales Channel, 2021 to 2036
- Table 43: Middle East & Africa Market Value (USD Billion) Forecast by Country, 2021 to 2036
- Table 44: Middle East & Africa Market Value (USD Billion) Forecast by Connector Type, 2021 to 2036
- Table 45: Middle East & Africa Market Value (USD Billion) Forecast by Environment Rating, 2021 to 2036
- Table 46: Middle East & Africa Market Value (USD Billion) Forecast by Material, 2021 to 2036
- Table 47: Middle East & Africa Market Value (USD Billion) Forecast by End Use, 2021 to 2036
- Table 48: Middle East & Africa Market Value (USD Billion) Forecast by Sales Channel, 2021 to 2036
List of Figures
- Figure 1: Global Market Pricing Analysis
- Figure 2: Global Market Value (USD Billion) Forecast 2021-2036
- Figure 3: Global Market Value Share and BPS Analysis by Connector Type, 2026 and 2036
- Figure 4: Global Market Y-o-Y Growth Comparison by Connector Type, 2026-2036
- Figure 5: Global Market Attractiveness Analysis by Connector Type
- Figure 6: Global Market Value Share and BPS Analysis by Environment Rating, 2026 and 2036
- Figure 7: Global Market Y-o-Y Growth Comparison by Environment Rating, 2026-2036
- Figure 8: Global Market Attractiveness Analysis by Environment Rating
- Figure 9: Global Market Value Share and BPS Analysis by Material, 2026 and 2036
- Figure 10: Global Market Y-o-Y Growth Comparison by Material, 2026-2036
- Figure 11: Global Market Attractiveness Analysis by Material
- Figure 12: Global Market Value Share and BPS Analysis by End Use, 2026 and 2036
- Figure 13: Global Market Y-o-Y Growth Comparison by End Use, 2026-2036
- Figure 14: Global Market Attractiveness Analysis by End Use
- Figure 15: Global Market Value Share and BPS Analysis by Sales Channel, 2026 and 2036
- Figure 16: Global Market Y-o-Y Growth Comparison by Sales Channel, 2026-2036
- Figure 17: Global Market Attractiveness Analysis by Sales Channel
- Figure 18: Global Market Value (USD Billion) Share and BPS Analysis by Region, 2026 and 2036
- Figure 19: Global Market Y-o-Y Growth Comparison by Region, 2026-2036
- Figure 20: Global Market Attractiveness Analysis by Region
- Figure 21: North America Market Incremental Dollar Opportunity, 2026-2036
- Figure 22: Latin America Market Incremental Dollar Opportunity, 2026-2036
- Figure 23: Western Europe Market Incremental Dollar Opportunity, 2026-2036
- Figure 24: Eastern Europe Market Incremental Dollar Opportunity, 2026-2036
- Figure 25: East Asia Market Incremental Dollar Opportunity, 2026-2036
- Figure 26: South Asia and Pacific Market Incremental Dollar Opportunity, 2026-2036
- Figure 27: Middle East & Africa Market Incremental Dollar Opportunity, 2026-2036
- Figure 28: North America Market Value Share and BPS Analysis by Country, 2026 and 2036
- Figure 29: North America Market Value Share and BPS Analysis by Connector Type, 2026 and 2036
- Figure 30: North America Market Y-o-Y Growth Comparison by Connector Type, 2026-2036
- Figure 31: North America Market Attractiveness Analysis by Connector Type
- Figure 32: North America Market Value Share and BPS Analysis by Environment Rating, 2026 and 2036
- Figure 33: North America Market Y-o-Y Growth Comparison by Environment Rating, 2026-2036
- Figure 34: North America Market Attractiveness Analysis by Environment Rating
- Figure 35: North America Market Value Share and BPS Analysis by Material, 2026 and 2036
- Figure 36: North America Market Y-o-Y Growth Comparison by Material, 2026-2036
- Figure 37: North America Market Attractiveness Analysis by Material
- Figure 38: North America Market Value Share and BPS Analysis by End Use, 2026 and 2036
- Figure 39: North America Market Y-o-Y Growth Comparison by End Use, 2026-2036
- Figure 40: North America Market Attractiveness Analysis by End Use
- Figure 41: North America Market Value Share and BPS Analysis by Sales Channel, 2026 and 2036
- Figure 42: North America Market Y-o-Y Growth Comparison by Sales Channel, 2026-2036
- Figure 43: North America Market Attractiveness Analysis by Sales Channel
- Figure 44: Latin America Market Value Share and BPS Analysis by Country, 2026 and 2036
- Figure 45: Latin America Market Value Share and BPS Analysis by Connector Type, 2026 and 2036
- Figure 46: Latin America Market Y-o-Y Growth Comparison by Connector Type, 2026-2036
- Figure 47: Latin America Market Attractiveness Analysis by Connector Type
- Figure 48: Latin America Market Value Share and BPS Analysis by Environment Rating, 2026 and 2036
- Figure 49: Latin America Market Y-o-Y Growth Comparison by Environment Rating, 2026-2036
- Figure 50: Latin America Market Attractiveness Analysis by Environment Rating
- Figure 51: Latin America Market Value Share and BPS Analysis by Material, 2026 and 2036
- Figure 52: Latin America Market Y-o-Y Growth Comparison by Material, 2026-2036
- Figure 53: Latin America Market Attractiveness Analysis by Material
- Figure 54: Latin America Market Value Share and BPS Analysis by End Use, 2026 and 2036
- Figure 55: Latin America Market Y-o-Y Growth Comparison by End Use, 2026-2036
- Figure 56: Latin America Market Attractiveness Analysis by End Use
- Figure 57: Latin America Market Value Share and BPS Analysis by Sales Channel, 2026 and 2036
- Figure 58: Latin America Market Y-o-Y Growth Comparison by Sales Channel, 2026-2036
- Figure 59: Latin America Market Attractiveness Analysis by Sales Channel
- Figure 60: Western Europe Market Value Share and BPS Analysis by Country, 2026 and 2036
- Figure 61: Western Europe Market Value Share and BPS Analysis by Connector Type, 2026 and 2036
- Figure 62: Western Europe Market Y-o-Y Growth Comparison by Connector Type, 2026-2036
- Figure 63: Western Europe Market Attractiveness Analysis by Connector Type
- Figure 64: Western Europe Market Value Share and BPS Analysis by Environment Rating, 2026 and 2036
- Figure 65: Western Europe Market Y-o-Y Growth Comparison by Environment Rating, 2026-2036
- Figure 66: Western Europe Market Attractiveness Analysis by Environment Rating
- Figure 67: Western Europe Market Value Share and BPS Analysis by Material, 2026 and 2036
- Figure 68: Western Europe Market Y-o-Y Growth Comparison by Material, 2026-2036
- Figure 69: Western Europe Market Attractiveness Analysis by Material
- Figure 70: Western Europe Market Value Share and BPS Analysis by End Use, 2026 and 2036
- Figure 71: Western Europe Market Y-o-Y Growth Comparison by End Use, 2026-2036
- Figure 72: Western Europe Market Attractiveness Analysis by End Use
- Figure 73: Western Europe Market Value Share and BPS Analysis by Sales Channel, 2026 and 2036
- Figure 74: Western Europe Market Y-o-Y Growth Comparison by Sales Channel, 2026-2036
- Figure 75: Western Europe Market Attractiveness Analysis by Sales Channel
- Figure 76: Eastern Europe Market Value Share and BPS Analysis by Country, 2026 and 2036
- Figure 77: Eastern Europe Market Value Share and BPS Analysis by Connector Type, 2026 and 2036
- Figure 78: Eastern Europe Market Y-o-Y Growth Comparison by Connector Type, 2026-2036
- Figure 79: Eastern Europe Market Attractiveness Analysis by Connector Type
- Figure 80: Eastern Europe Market Value Share and BPS Analysis by Environment Rating, 2026 and 2036
- Figure 81: Eastern Europe Market Y-o-Y Growth Comparison by Environment Rating, 2026-2036
- Figure 82: Eastern Europe Market Attractiveness Analysis by Environment Rating
- Figure 83: Eastern Europe Market Value Share and BPS Analysis by Material, 2026 and 2036
- Figure 84: Eastern Europe Market Y-o-Y Growth Comparison by Material, 2026-2036
- Figure 85: Eastern Europe Market Attractiveness Analysis by Material
- Figure 86: Eastern Europe Market Value Share and BPS Analysis by End Use, 2026 and 2036
- Figure 87: Eastern Europe Market Y-o-Y Growth Comparison by End Use, 2026-2036
- Figure 88: Eastern Europe Market Attractiveness Analysis by End Use
- Figure 89: Eastern Europe Market Value Share and BPS Analysis by Sales Channel, 2026 and 2036
- Figure 90: Eastern Europe Market Y-o-Y Growth Comparison by Sales Channel, 2026-2036
- Figure 91: Eastern Europe Market Attractiveness Analysis by Sales Channel
- Figure 92: East Asia Market Value Share and BPS Analysis by Country, 2026 and 2036
- Figure 93: East Asia Market Value Share and BPS Analysis by Connector Type, 2026 and 2036
- Figure 94: East Asia Market Y-o-Y Growth Comparison by Connector Type, 2026-2036
- Figure 95: East Asia Market Attractiveness Analysis by Connector Type
- Figure 96: East Asia Market Value Share and BPS Analysis by Environment Rating, 2026 and 2036
- Figure 97: East Asia Market Y-o-Y Growth Comparison by Environment Rating, 2026-2036
- Figure 98: East Asia Market Attractiveness Analysis by Environment Rating
- Figure 99: East Asia Market Value Share and BPS Analysis by Material, 2026 and 2036
- Figure 100: East Asia Market Y-o-Y Growth Comparison by Material, 2026-2036
- Figure 101: East Asia Market Attractiveness Analysis by Material
- Figure 102: East Asia Market Value Share and BPS Analysis by End Use, 2026 and 2036
- Figure 103: East Asia Market Y-o-Y Growth Comparison by End Use, 2026-2036
- Figure 104: East Asia Market Attractiveness Analysis by End Use
- Figure 105: East Asia Market Value Share and BPS Analysis by Sales Channel, 2026 and 2036
- Figure 106: East Asia Market Y-o-Y Growth Comparison by Sales Channel, 2026-2036
- Figure 107: East Asia Market Attractiveness Analysis by Sales Channel
- Figure 108: South Asia and Pacific Market Value Share and BPS Analysis by Country, 2026 and 2036
- Figure 109: South Asia and Pacific Market Value Share and BPS Analysis by Connector Type, 2026 and 2036
- Figure 110: South Asia and Pacific Market Y-o-Y Growth Comparison by Connector Type, 2026-2036
- Figure 111: South Asia and Pacific Market Attractiveness Analysis by Connector Type
- Figure 112: South Asia and Pacific Market Value Share and BPS Analysis by Environment Rating, 2026 and 2036
- Figure 113: South Asia and Pacific Market Y-o-Y Growth Comparison by Environment Rating, 2026-2036
- Figure 114: South Asia and Pacific Market Attractiveness Analysis by Environment Rating
- Figure 115: South Asia and Pacific Market Value Share and BPS Analysis by Material, 2026 and 2036
- Figure 116: South Asia and Pacific Market Y-o-Y Growth Comparison by Material, 2026-2036
- Figure 117: South Asia and Pacific Market Attractiveness Analysis by Material
- Figure 118: South Asia and Pacific Market Value Share and BPS Analysis by End Use, 2026 and 2036
- Figure 119: South Asia and Pacific Market Y-o-Y Growth Comparison by End Use, 2026-2036
- Figure 120: South Asia and Pacific Market Attractiveness Analysis by End Use
- Figure 121: South Asia and Pacific Market Value Share and BPS Analysis by Sales Channel, 2026 and 2036
- Figure 122: South Asia and Pacific Market Y-o-Y Growth Comparison by Sales Channel, 2026-2036
- Figure 123: South Asia and Pacific Market Attractiveness Analysis by Sales Channel
- Figure 124: Middle East & Africa Market Value Share and BPS Analysis by Country, 2026 and 2036
- Figure 125: Middle East & Africa Market Value Share and BPS Analysis by Connector Type, 2026 and 2036
- Figure 126: Middle East & Africa Market Y-o-Y Growth Comparison by Connector Type, 2026-2036
- Figure 127: Middle East & Africa Market Attractiveness Analysis by Connector Type
- Figure 128: Middle East & Africa Market Value Share and BPS Analysis by Environment Rating, 2026 and 2036
- Figure 129: Middle East & Africa Market Y-o-Y Growth Comparison by Environment Rating, 2026-2036
- Figure 130: Middle East & Africa Market Attractiveness Analysis by Environment Rating
- Figure 131: Middle East & Africa Market Value Share and BPS Analysis by Material, 2026 and 2036
- Figure 132: Middle East & Africa Market Y-o-Y Growth Comparison by Material, 2026-2036
- Figure 133: Middle East & Africa Market Attractiveness Analysis by Material
- Figure 134: Middle East & Africa Market Value Share and BPS Analysis by End Use, 2026 and 2036
- Figure 135: Middle East & Africa Market Y-o-Y Growth Comparison by End Use, 2026-2036
- Figure 136: Middle East & Africa Market Attractiveness Analysis by End Use
- Figure 137: Middle East & Africa Market Value Share and BPS Analysis by Sales Channel, 2026 and 2036
- Figure 138: Middle East & Africa Market Y-o-Y Growth Comparison by Sales Channel, 2026-2036
- Figure 139: Middle East & Africa Market Attractiveness Analysis by Sales Channel
- Figure 140: Global Market - Tier Structure Analysis
- Figure 141: Global Market - Company Share Analysis
Frequently Asked Questions
How big is the Harsh-Environment Connectors Market in 2026?
The harsh-environment connectors market is valued at USD 3.9 billion in 2026 and is forecast to reach USD 7.7 billion by 2036. Growth is supported by new aircraft deliveries that enlarge the installed platform base requiring qualified connector systems across production and fleet support.
What is the CAGR of the Harsh-Environment Connectors Market from 2026 to 2036?
The harsh-environment connectors market grows at a CAGR of 7.2% between 2026 and 2036, supported by current qualification records that direct repeat aerospace and defense orders toward connector families with verified environmental performance across approved platform programs.
Which connector type leads the Harsh-Environment Connectors Market?
Circular connectors account for 28.0% of the harsh-environment connectors market by connector type in 2026, driven by familiar coupling methods and broad contact configurations that resist accidental separation across aircraft engines and rail vehicles.
How much will the Harsh-Environment Connectors Market add between 2026 and 2036?
The harsh-environment connectors market is set to add USD 3.8 billion between 2026 and 2036, growing from USD 3.9 billion to USD 7.7 billion as qualified connector families extend across aerospace, defense, rail, marine and renewable energy programs worldwide.
Who are the leading companies in the Harsh-Environment Connectors Market?
Eight companies lead the harsh-environment connectors market consistently, including Amphenol, TE Connectivity, Molex, ITT Cannon, Smiths Interconnect, Souriau-Sunbank by Eaton, Radiall and Glenair, competing through qualification breadth, environmental sealing and platform traceability worldwide.
Preview the report firsthand - request a free sample
Get SampleGet the brochure for pricing and purchase details.
Get PDF
