

- Market Size (2026)
- USD 510.5 Mn
- Forecast (2036)
- USD 931.6 Mn
- CAGR (2026 to 2036)
- 6.2%
How big is Healthcare Reimbursement Optimization Market in 2026?
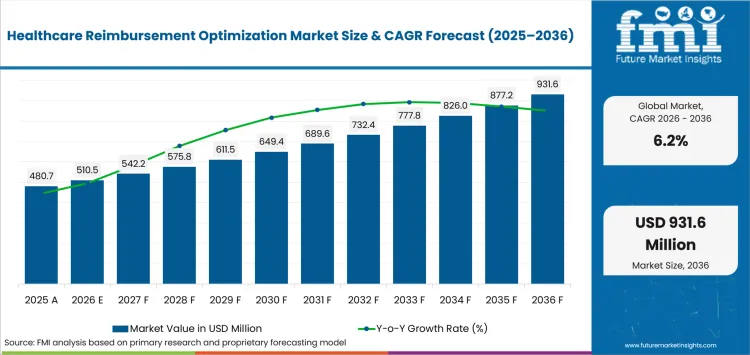
USD 510.5 million in 2026 and USD 931.6 million by 2036 at a 6.2% CAGR.
Demand in the healthcare reimbursement optimization market is forecast to expand at 6.2% CAGR between 2026 and 2036, supported by rising claim complexity and connected reimbursement workflows. The valuation increases from USD 510.5 million to USD 931.6 million during that period. Hospitals invest in revenue cycle management when claims accuracy and documentation discipline improve cash conversion without shifting more work toward clinical teams. CMS reported in January 2026 that Medicare Fee-for-Service improper payments reached 6.55% or USD 28.83 billion for fiscal 2025. The measure does not represent fraud and instead identifies documentation weaknesses that create avoidable review work across provider organizations. Claims platforms create commercial value by identifying incomplete records earlier and directing exceptions toward accountable staff before payer submission. Purchasing decisions therefore depend on fewer rejected claims and shorter follow-up cycles rather than broad software functionality.
National purchasing routes differ because reimbursement rules and data exchange obligations shape how providers validate coverage and submit claims. United States health systems often prioritize payer connectivity and denial prevention across complex commercial and public insurance mixes. British providers operate under nationally defined payment mechanisms that connect coded activity with contract values and service payments. NHS England published the 2026/27 payment scheme in March 2026 and established four payment mechanisms for covered secondary healthcare services. German institutions balance statutory billing requirements with electronic patient records while Japanese and South Korean providers use nationally coordinated eligibility or review systems. Healthcare interoperability solutions become more valuable as local reimbursement routes require administrative records to remain connected with clinical information. Technology providers therefore need local configuration expertise and service partners rather than one standardized deployment model.
Key Takeaways of Healthcare Reimbursement Optimization Market
- Demand for healthcare reimbursement optimization is driven by documentation gaps and payer edits that delay reimbursement, with the market growing from USD 480.7 million in 2025 to USD 510.5 million in 2026, reaching USD 931.6 million by 2036 at a 6.2% CAGR.
- By solution type, claims management holds the leading share at 39.6% in 2026, attributable to direct control over submission quality and denial prevention.
- Cloud-based deployment is the dominant mode, holding 43.9% share in 2026, underpinned by scalable payer connectivity and centralized rule updates.
- Hospitals lead end-user demand at 41.1% share in 2026, while eligibility verification holds 38.3% share, reflecting concentrated transaction volumes across provider workflows.
- Automation reduces manual review by directing incomplete records toward responsible staff, with provider investment easier to defend once denial reduction and cash acceleration are measured through consistent operating indicators.
- Japan and the UK form the upper growth group, while the United States combines large reimbursement volumes with fragmented payer rules and Germany depends on governed statutory integration.
- Competition centers on Optum, Oracle Health, Waystar, Experian Health, R1 RCM, Conifer Health Solutions, FinThrive, and athenahealth, with vendors differentiating through broad revenue workflow coverage, claim connectivity, and managed operations accountability.
-
Analyst Perspective
The real differentiator in reimbursement optimization isn't feature breadth but whether a platform's exception-handling holds up on messy, representative claims rather than clean demonstration records. Denial reduction claims mean little unless providers can trace them to specific documentation routes that catch incomplete records before submission rather than after a payer edit. Implementation contracts need clear integration ownership and response-time commitments up front, since administrative risk quietly reverts to provider staff whenever a vendor's coverage gaps surface mid-workflow rather than during procurement review.
-Anurag Sharma, Principal Analyst at Future Market Insights
Source: FMI's proprietary forecasting model and primary research
How is the Healthcare Reimbursement Optimization Market segmented?
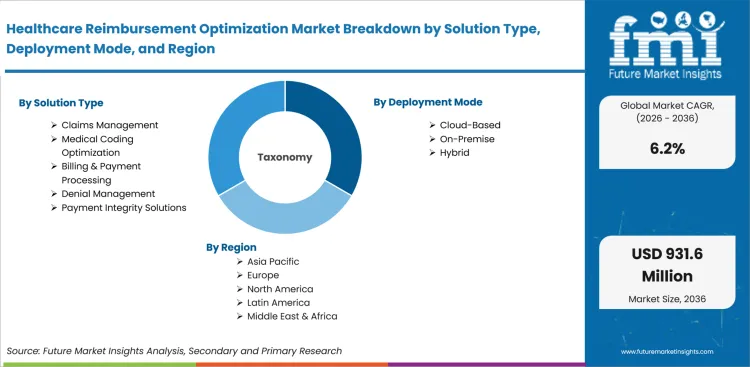
The healthcare reimbursement optimization industry is segmented by solution type; deployment mode; end user; function; and region.
The segmentation framework separates the operating task from the technology delivery model and the organization using each solution. Solution type covers claims management and coding optimization together with billing processing and denial management. It also includes payment integrity solutions that examine reimbursement accuracy across provider accounts and completed payer transactions. Deployment mode compares cloud-based environments with on-premise and hybrid configurations across different technology ownership models. End-user analysis distinguishes hospitals and physician practices from outpatient centers and diagnostic organizations with narrower administrative teams. Function analysis follows eligibility verification through claims submission and adjudication support across provider reimbursement workflows. It then covers revenue leakage detection and payment reconciliation across completed payer transactions and contract terms. Regional analysis measures how payment rules and digital infrastructure influence adoption across countries with different reimbursement systems.
What supports demand for claims management within the solution Type category?
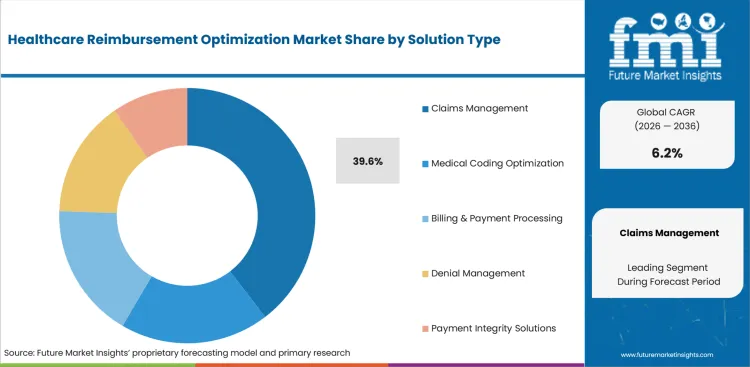
Claims management controls the point where coded encounters become payer-facing financial records and incomplete information becomes visible. Large health systems need one workflow for edits and attachments while specialist practices need simpler exception queues that protect limited billing capacity. CMS reported in March 2026 that standardized electronic claims attachments are projected to save about USD 781 million annually, attributable to national exchange standards. Medical billing outsourcing providers also depend on standardized claim data since scattered corrections weaken service efficiency across multiple payer routes.
- By solution, claims management is projected to hold 39.6% share in 2026, attributable to direct control over submission quality and preventable denial risk across provider organizations. Effective platforms preserve the relationship between clinical documentation and payer edits so staff can correct records without rebuilding the complete claim.
- Hospitals and physician practices adopt claims management for different operating reasons across their reimbursement teams. Hospitals need scalable queues across service lines while smaller practices need focused automation that limits manual follow-up. Both groups value traceable corrections that identify the responsible department and specify the required action for resolution.
How does Cloud-Based delivery shape demand within the deployment mode category?
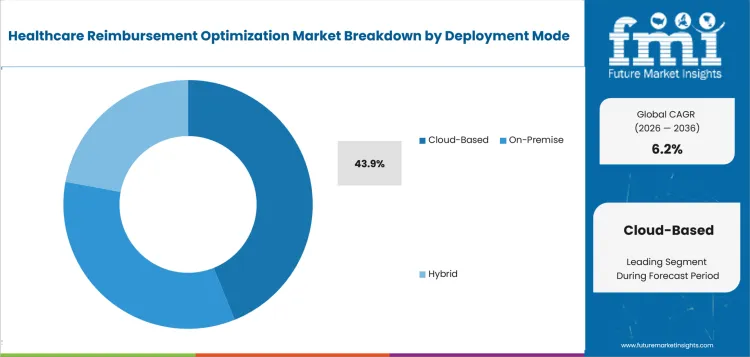
Cloud deployment centralizes rule updates and payer connections across organizations that maintain several clinical and financial systems. National health IT infrastructure now provides a broad technical base for hosted reimbursement applications across hospitals and ambulatory organizations. The Office of the National Coordinator reported in June 2026 that 91% of office-based physicians and more than 99% of nonfederal acute hospitals used certified electronic health records in 2024. Healthcare cloud infrastructure therefore supports reimbursement tools that require current interfaces and common security controls across distributed locations.
- In 2026, cloud-based solutions are forecast to represent 43.9% share, underpinned by centralized configuration and faster payer-rule updates across large geographically distributed provider networks. Subscription delivery also reduces local infrastructure requirements for organizations that lack specialized revenue technology staff.
- Multi-site provider groups favor hosted environments that distribute workflow changes without separate upgrades at each location. Adoption slows if connectivity failures interrupt eligibility checks or claim submission across provider locations during daily operations. Contracts therefore need defined availability targets and clear responsibility for interface maintenance during routine operations.
How are hospitals positioned within the end user category?
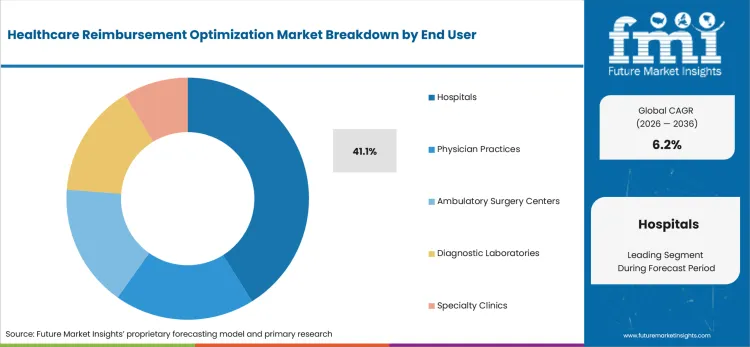
Hospitals manage high claim volumes across emergency care and surgery together with outpatient diagnostics and specialty services. Reimbursement optimization must connect clinical documentation with patient access and contract rules across several departments. The operating challenge grows as payer information reaches staff through different systems and transaction formats. Hospital finance leaders therefore favor platforms that provide enterprise visibility while preserving service-line accountability for unresolved exceptions.
- Hospitals are estimated to account for 41.1% share in 2026, owing to complex claims and large administrative workforces across inpatient and outpatient service lines. Enterprise platforms can identify recurring denial causes across departments rather than treating each rejected claim as an isolated billing event.
- Hospital adoption is strengthened by digital healthcare transformation that connects financial decisions with current clinical information. The Office of the National Coordinator reported in April 2026 that 75% of hospitals used real-time prescription benefit tools for some payers during 2025. Similar connectivity expectations raise the value of reimbursement workflows that present coverage information during patient service preparation.
What makes eligibility verification central to the function category?
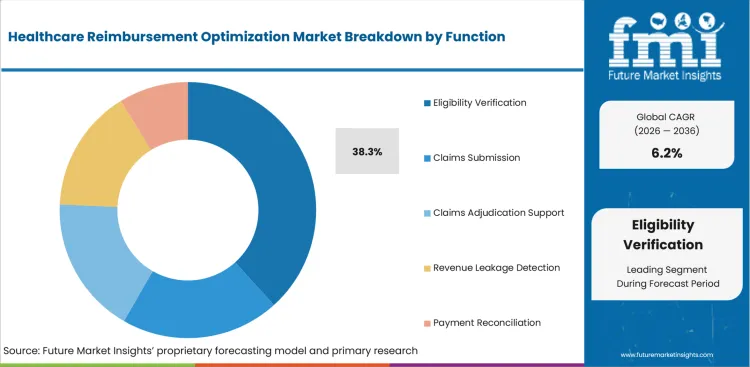
Eligibility verification establishes whether payer records and benefit information support the planned service before downstream billing work begins. Errors at this point can produce avoidable denials and delayed patient communication across registration teams. CMS states that covered payers must implement Provider Access and Prior Authorization application programming interfaces by January 1 2027. FHIR prior authorization standards create a direct pathway for reimbursement platforms to connect coverage checks with structured authorization data.
- Eligibility verification is anticipated to hold 38.3% share in 2026, enabled by the financial effect of correcting coverage information early across patient service workflows. Provider teams can redirect uncertain accounts before treatment scheduling or claim preparation creates additional administrative work.
- Patient access teams use eligibility tools to confirm plan status and identify authorization requirements during registration. Adoption depends on payer connectivity and dependable response quality rather than transaction speed alone during registration. Poor results can create false confidence and transfer errors toward later billing teams during claim preparation.
What are the drivers, restraints, and opportunities in the Healthcare Reimbursement Optimization Market?
Reimbursement complexity supports investment in automation that prevents avoidable claim work and preserves accountability across provider teams. Growth remains constrained by integration risk while standardized payer interfaces create a commercial opening for governed workflows and measurable financial results.
- Driver: Prior authorization and claim review requirements increase administrative work across provider organizations that manage several payer rule sets.
- Restraint: Integration failures and cybersecurity disruptions can interrupt core reimbursement transactions across hospitals and physician practices.
- Opportunity: Standardized payer interfaces can connect eligibility and authorization data with provider workflows through consistent technical requirements.
Prior authorization workload is one of the significant growth driver for reimbursement optimization tools that organize payer rules and incomplete documentation. The American Medical Association reported in May 2026 that physicians completed about forty prior authorizations weekly and spent thirteen hours on the work. A governed prior authorization workflow can reduce repeated status checks and direct exceptions toward trained staff. Provider organizations gain the strongest benefit once approval timing and denial causes remain visible across clinical and financial teams.
Transaction concentration leads to a material restraint because one service interruption can block claim and payment activity across many providers. The United States Department of Health and Human Services described the Change Healthcare cybersecurity incident as unprecedented in magnitude and widespread impact in its March 2025 guidance. Hospitals therefore require tested continuity routes and clear data responsibilities across clearinghouses and technology partners. Implementation contracts that omit recovery procedures can expose provider cash flow to infrastructure failures outside local control.
Standardized payer interfaces create an opportunity to connect coverage information with provider action during service preparation. CMS explains that impacted payers must support Prior Authorization application programming interfaces and publish selected operational metrics under current interoperability requirements. Healthcare IT outsourcing can provide configuration and monitoring capacity for organizations that lack dedicated interface teams. Commercial success depends on maintaining accurate payer connections while giving provider staff understandable exception queues and accountable support routes.
Which country CAGRs are profiled in the Healthcare Reimbursement Optimization Market?
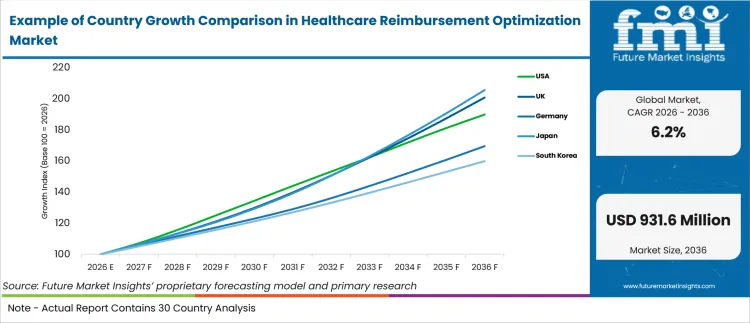
| Country | CAGR |
|---|---|
| USA | 6.6% |
| UK | 7.2% |
| Germany | 5.4% |
| Japan | 7.5% |
| South Korea | 4.8% |
How do country-level CAGRs compare in the healthcare reimbursement optimization market?
The five-country comparison forms three broad growth groups rather than one uniform adoption path across national reimbursement systems. Japan and the UK occupy the upper range through different institutional mechanisms and provider payment structures. The United States follows through a large reimbursement system that combines public programs with fragmented commercial payer requirements. Germany and South Korea record more measured rates despite established healthcare infrastructure and nationally governed digital processes. Each position reflects the approved forecast values rather than a general ranking of national healthcare performance.
- Japan and the UK form the upper group through different administrative foundations across their provider systems. Japan relies on digital eligibility infrastructure while the UK uses nationally administered payment mechanisms across secondary care providers.
- The United States occupies the middle position through large transaction volumes and established provider technology networks. Large claim volumes support technology investment while payer fragmentation increases configuration and service requirements across individual contracts.
- Germany follows through a statutory operating environment that rewards governed integration across hospital reimbursement processes. Hospital diversity and formal digital requirements can lengthen implementation decisions across providers with different technical capacity.
- South Korea records the most measured forecast among the five profiled markets despite advanced national review infrastructure. Structured review processes support automation while changing evidence requirements create continuing workflow adjustments across hospital teams.
- The spread across these markets remains moderate and does not erase meaningful differences in reimbursement administration. Similar forecast rates can still produce different service models and commercial entry costs across national provider systems.
Country entry decisions should therefore examine payment governance and available support routes rather than treating CAGR as a complete adoption measure. The full report provides country-level CAGR analysis across North America; Latin America; Europe; East Asia; South Asia; Oceania; and the Middle East and Africa.
Country-wise Analysis
- United States providers manage reimbursement across Medicare and Medicaid together with commercial plans that maintain different payment and authorization rules. The national market is projected to expand at 6.6% CAGR through 2036, supported by established payer connectivity and provider technology investment. CMS issued the 2026 Medicare Physician Fee Schedule final rule in October 2025 and made its payment policies effective from January 2026. Established clearinghouse connections and mature healthcare analytics capabilities support deployment across large health systems with specialized revenue teams. Fragmented payer requirements remain a material friction because interface maintenance and denial rules can vary across contracts. Provider organizations therefore need implementation partners that combine payer connectivity with reliable local support and accountable service recovery.
- English NHS providers operate through nationally defined payment mechanisms that connect activity records with commissioner payments and contract rules. The UK market is forecast to rise at 7.2% CAGR between 2026 and 2036, underpinned by nationally administered payment mechanisms. NHS England reported in April 2025 that low-volume activity block payments removed around 500,000 transactions from the system. National rules provide a clear implementation route for standardized reimbursement workflows across secondary care providers and commissioner relationships. Local contract adjustments and annual payment reviews create material configuration work for provider finance teams. Suppliers need current coding support and service coverage that reflects NHS commissioning relationships rather than commercial insurance assumptions.
- German hospitals bill within a statutory framework that combines regulated reimbursement with formal documentation and digital record requirements. The national market is estimated to advance at 5.4% CAGR during the forecast period, shaped by regulated billing requirements and varied hospital integration capacity. Destatis reported in November 2025 that 1,841 hospitals treated 17.5 million inpatient cases during 2024. The electronic patient record supports structured administrative information across statutory insurance and creates a stronger integration foundation. Hospital diversity remains a commercial friction because university centers and smaller regional facilities maintain different integration capacity. Technology providers need German-language support and implementation partners that understand local billing governance together with hospital system interfaces.
- Japanese medical institutions use online eligibility confirmation as a routine entry point for insured patient administration. System adoption in Japan is anticipated to expand at 7.5% CAGR from 2026 to 2036, reinforced by national eligibility infrastructure and digital administration. The Ministry of Health reported in November 2025 that conventional health insurance cards would expire on December 1 and promoted My Number eligibility checks. Broad provider coverage creates a direct enabler for connected reimbursement applications across hospitals and community medical facilities. Reader procurement and onsite vendor work remain material frictions for facilities with limited technical staffing and remote service access. Suppliers need compatible hardware support and local maintenance routes that prevent eligibility interruptions during registration.
- South Korean hospitals submit structured review information through HIRA within a nationally coordinated insurance environment. The national market is predicted to grow at 4.8% CAGR by 2036, associated with structured review infrastructure and frequent submission-rule updates. HIRA announced in February 2025 that required review-data items were reduced from 430 to 221 effective March 2025. Centralized review infrastructure enables consistent software configuration and training across provider groups that submit standardized reimbursement evidence. Changing submission specifications remain a material friction because hospital teams must revise internal data capture and validation routines. Technology partners need Korean-language service and dependable updates that match HIRA operating changes across hospital submission workflows.
Who are the notable companies in the Healthcare Reimbursement Optimization Market?
Optum, Oracle Health, athenahealth, Inc., Waystar, Experian Health, R1 RCM Inc., FinThrive, and Conifer Health Solutions
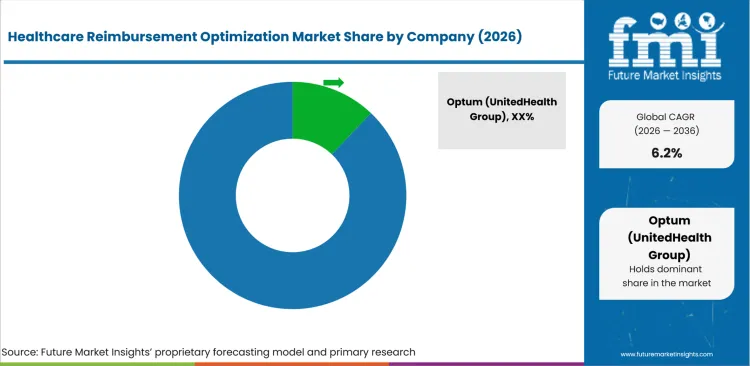
The competitive field combines broad revenue platforms with focused claim and patient access technology across provider reimbursement workflows. Official product descriptions show that Optum and Oracle Health cover several reimbursement stages while Waystar and Experian Health concentrate on financial clearance and claim performance. R1 RCM and Conifer Health Solutions add managed operating models for provider organizations with limited internal capacity. FinThrive emphasizes revenue integrity and analytics while athenahealth connects ambulatory billing with established practice workflows. Patient engagement platforms increasingly overlap with reimbursement preparation through estimates and coverage communication across patient access teams. Capability depth and service accountability therefore matter more than corporate size during provider vendor selection processes.
- Optum and Oracle Health connect claim preparation with broader clinical workflows while athenahealth supports ambulatory practice reimbursement operations.
- Waystar and Experian Health focus on financial clearance; FinThrive adds claim performance and revenue analytics capabilities across provider organizations.
- R1 RCM and Conifer Health Solutions combine technology with managed operations that place daily workflow accountability inside service contracts.
Competitive Benchmarking: Healthcare Reimbursement Optimization Market
| Company | Claims and Denial Management | Eligibility and Patient Access | Payment Integrity and Analytics | Geographic Reach |
|---|---|---|---|---|
| Optum | High | High | High | North America |
| Oracle Health | High | Medium | High | Global |
| athenahealth, Inc. | High | High | Medium | United States |
| Waystar | High | High | High | United States |
| Experian Health | High | High | High | United States |
| R1 RCM Inc. | High | High | High | United States |
| FinThrive | High | Medium | High | United States |
| Conifer Health Solutions | High | High | Medium | United States |
Scoring basis: For Claims and Denial Management, High requires dedicated claim workflow plus denial prevention or recovery. Medium requires direct but narrower claim support while Low requires one documented claim step within the defined reimbursement workflow. For Eligibility and Patient Access, High requires eligibility together with authorization and financial clearance across one documented commercial offering. Medium requires two core access functions while Low requires one documented function within patient access operations. For Payment Integrity and Analytics, High requires contract or payment variance analysis together with revenue integrity capabilities. Medium requires reporting plus selected payment review while Low requires basic operational reporting without documented revenue integrity functions. Geographic reach reflects documented commercial availability for the assessed offering rather than broader parent-company presence across unrelated healthcare categories.
Key Developments in the Healthcare Reimbursement Optimization Market
- In January 2026, Waystar introduced agentic intelligence capabilities for revenue cycle workflows across its platform. The company reported that the technology reduced manual claim correction work by about 40% during early use across provider organizations.
- In October 2025, R1 RCM: R1 launched Phare as a revenue operating system and announced Singing River Health System as an early partner. The platform combines workflow intelligence with operational services across the revenue cycle and places measurable execution inside one managed operating model.
- In June 2026, athenahealth announced more than eighty AI-native revenue cycle management features across its network. The capabilities address claim preparation and administrative work within ambulatory practices that need automation inside established clinical software workflows. The development extends automation through existing practice workflows and reduces the need for separate point solutions across smaller provider organizations.
- In June 2026, FinThrive launched Denials Prevention Manager to identify claim risks before submission through models trained on billions of claims. The product extends the company’s Fusion platform with preventive workflow guidance for revenue teams reviewing claim risk prior to submission.
Key Players in the Healthcare Reimbursement Optimization Market
Claims and Payment Technology Providers
- Waystar
- Experian Health
- FinThrive
Managed Revenue Cycle Providers
- Optum
- R1 RCM Inc.
- Conifer Health Solutions
Integrated Health Platform Providers
- athenahealth, Inc.
- Oracle Health
Healthcare Reimbursement Optimization Market - Report Scope
| Coverage field | Report scope |
|---|---|
| Market breakdown | By Solution Type, Deployment Mode, End User, Function, and Region |
| Market Definition | The healthcare reimbursement optimization market covers software and services that improve eligibility; claims; denials; payment integrity; and related provider revenue workflows. |
| Regions Covered | North America, Latin America, Western Europe, Eastern Europe, East Asia, South Asia and Pacific, and Middle East and Africa |
| Countries Covered | USA, UK, Germany, Japan, South Korea |
| Key Companies Profiled | Optum, Oracle Health, athenahealth, Inc., Waystar, Experian Health, R1 RCM Inc., FinThrive, Conifer Health Solutions |
| Forecast Period | 2026 to 2036 |
| Approach | Hybrid market sizing framework integrating segment structure analysis, country operating conditions, company benchmarking, and reimbursement evaluation. |
Healthcare Reimbursement Optimization Market - Research Methodology
| Method | Approach |
|---|---|
| Primary Research | FMI analysts gathered input from manufacturers, service providers, technology developers, distributors, end users, procurement teams, and subject-matter experts. Interviews examined purchasing decisions, product or service evaluation, adoption barriers, approval requirements, pricing considerations, and expectations for technical or commercial support. Respondents were also asked what evidence is required before a trial, pilot, or initial order develops into regular purchasing. |
| Desk Research | Desk research covered government statistics, regulatory publications, trade data, industry associations, technical literature, standards, company filings, product information, and official corporate announcements. Sources were reviewed for relevance, publication date, geographic coverage, and consistency with the defined market scope. Claims relating to performance, applications, approvals, capacity, investment, and commercial activity were retained only when supported by credible public evidence. |
| Market Sizing and Forecasting | The market model combined the baseline value with historical performance, segment structure, pricing and volume indicators, adoption levels, company participation, and country-level demand conditions. Forecast assumptions considered economic activity, investment trends, regulatory developments, technology adoption, purchasing cycles, supply availability, and barriers to wider market use. Segment and regional estimates were reconciled before the final market total was calculated. |
| Data Validation | Estimates were checked against multiple independent indicators, including public data, company activity, trade patterns, industry developments, and findings from primary interviews. Validation also tested whether products, services, applications, and company revenues fell within the defined market boundaries. Adjacent categories, unsupported claims, overlapping revenues, and activities without direct market relevance were excluded to reduce double counting and maintain consistency across segments and countries. |
Healthcare Reimbursement Optimization Market by Segments
Healthcare Reimbursement Optimization Market segmented by Solution Type:
- Claims Management
- Medical Coding Optimization
- Billing & Payment Processing
- Denial Management
- Payment Integrity Solutions
Healthcare Reimbursement Optimization Market segmented by Deployment Mode:
- Cloud-Based
- On-Premise
- Hybrid
Healthcare Reimbursement Optimization Market segmented by End User:
- Hospitals
- Physician Practices
- Ambulatory Surgery Centers
- Diagnostic Laboratories
- Specialty Clinics
Healthcare Reimbursement Optimization Market segmented by Function:
- Eligibility Verification
- Claims Submission
- Claims Adjudication Support
- Revenue Leakage Detection
- Payment Reconciliation
Healthcare Reimbursement Optimization Market by Region:
- North America
- United States
- Canada
- Latin America
- Brazil
- Mexico
- Argentina
- Chile
- Western Europe
- Germany
- France
- United Kingdom
- Italy
- Spain
- Benelux
- Nordics
- Eastern Europe
- Poland
- Czech Republic
- Romania
- Hungary
- East Asia
- China
- Japan
- South Korea
- South Asia and Pacific
- India
- ASEAN
- Australia and New Zealand
- Middle East and Africa
- GCC Countries
- South Africa
- Türkiye
- Israel
Research Sources and Bibliography
- Centers for Medicare & Medicaid Services. (2026, January 15).
- NHS England. (2026, March 26).
- Centers for Medicare & Medicaid Services. (2026, March 20).
- Office of the National Coordinator for Health Information Technology. (2026, June).
- Office of the National Coordinator for Health Information Technology. (2026, April).
- Centers for Medicare & Medicaid Services. (2026, April 14).
- American Medical Association. (2026, May 13).
- USA Department of Health and Human Services. (2025, March 14).
- Centers for Medicare & Medicaid Services. (2026, July 17).
- Centers for Medicare & Medicaid Services. (2025, October 31).
- NHS England. (2025, April 4).
- Statistisches Bundesamt (Destatis). (2025, November 6).
- Bundesministerium für Gesundheit. (2025, April 10).
- [Ministry of Health, Labour and Welfare]. (2025, November 10).
- [Ministry of Health, Labour and Welfare]. (n.d.).
- [Health Insurance Review and Assessment Service]. (2025, February 25).
- R1 RCM. (2025, October 22).
- athenahealth. (2026, June 3).
- FinThrive. (2026, June 8).
This bibliography is provided for reader reference and is not exhaustive. The full report contains the complete reference list and detailed citations
This Report Answers
- How large is the healthcare reimbursement optimization market in 2026 and 2036?
- Which administrative pressures support investment in healthcare reimbursement optimization?
- Why does Claims Management hold the largest Solution Type share in 2026?
- How does cloud deployment influence payer connectivity and system maintenance?
- Why do hospitals account for the largest End User share in 2026?
- How do country growth rates compare across USA, UK, Germany, Japan, and South Korea?
- Which companies provide integrated platforms or managed revenue operations?
- What limits adoption across fragmented payer and provider technology environments?
- How can standardized interfaces improve eligibility and authorization workflows?
Frequently Asked Questions
How big is the Healthcare Reimbursement Optimization Market in 2026?
The healthcare reimbursement optimization market is valued at USD 510.5 million in 2026 and is forecast to reach USD 931.6 million by 2036. Growth reflects hospitals investing in revenue cycle management as claims accuracy and documentation discipline improve cash conversion without shifting more work toward clinical teams.
What is the CAGR of the Healthcare Reimbursement Optimization Market from 2026 to 2036?
The healthcare reimbursement optimization market grows at a CAGR of 6.2% between 2026 and 2036, supported by prior authorization and claim review requirements that increase administrative work across provider organizations managing several payer rule sets.
Which solution type leads the Healthcare Reimbursement Optimization Market?
Claims management accounts for 39.6% of the healthcare reimbursement optimization market by solution type in 2026, attributable to direct control over submission quality and preventable denial risk across provider organizations and reimbursement teams.
How much will the Healthcare Reimbursement Optimization Market add between 2026 and 2036?
The healthcare reimbursement optimization market is set to add USD 421.1 million between 2026 and 2036, growing from USD 510.5 million to USD 931.6 million as claims management and denial-prevention platforms extend across a widening base of hospital and physician-practice reimbursement workflows.
Who are the leading companies in the Healthcare Reimbursement Optimization Market?
Five companies lead the healthcare reimbursement optimization market, including Optum, Oracle Health, Waystar, Experian Health, and R1 RCM, competing through integrated revenue platforms, managed operations, and claims connectivity and financial clearance capabilities.
Preview the report firsthand - request a free sample
Get SampleGet the brochure for pricing and purchase details.
Get PDFTable of Content
- Key Takeaways
- Market Size and CAGR
- Top Growth Driver
- Fastest Growing Segment
- Leading Region
- Key Companies
- Emerging Opportunities
- Executive Summary
- Global Market Outlook
- Demand-side Trends
- Supply-side Trends
- Technology Roadmap Analysis
- Analysis and Recommendations
- Analyst Perspective (What is happening? Why now? What should investors know?)
- Key Questions Answered
- How large is the market?
- What is the CAGR?
- What are key trends?
- Which region dominates?
- Who are the leaders?
- Market Overview
- Market Coverage / Taxonomy
- Market Definition / Scope / Limitations
- Research Methodology
- Chapter Orientation
- Analytical Lens and Working Hypotheses
- Market Structure, Signals, and Trend Drivers
- Benchmarking and Cross-market Comparability
- Market Sizing, Forecasting, and Opportunity Mapping
- Research Design and Evidence Framework
- Desk Research Programme (Secondary Evidence)
- Expert Input and Fieldwork (Primary Evidence)
- Tooling, Models, and Reference Databases
- Data Engineering and Model Build
- Quality Assurance and Audit Trail
- Market Background
- Market Dynamics (Drivers, Restraints, Opportunity, Trends)
- Scenario Forecast (Optimistic, Likely, Conservative)
- Impact Analysis
- AI Impact
- Sustainability Impact
- Regulatory Impact
- Technology Impact
- Consumer / Buyer Analysis
- Purchase Drivers
- Adoption Barriers
- Buyer Journey
- Opportunity Map Analysis
- Product Life Cycle Analysis
- Supply Chain Analysis
- Investment Feasibility Matrix
- Value Chain Analysis
- PESTLE and Porter's Analysis
- Regulatory Landscape
- Regional Parent Market Outlook
- Production and Consumption Statistics
- Import and Export Statistics
- Global Market Analysis and Forecast, 2021 to 2036
- Historical Market Size Value (USD Million) Analysis, 2021 to 2025
- Current and Future Market Size Value (USD Million) Projections, 2026 to 2036
- Y-o-Y Growth Trend Analysis
- Absolute $ Opportunity Analysis
- Global Market Pricing Analysis, 2021 to 2036
- Global Market Analysis and Forecast, By Solution Type, 2021 to 2036
- Introduction / Key Findings
- Historical Market Size Value (USD Million) Analysis By Solution Type, 2021 to 2025
- Current and Future Market Size Value (USD Million) Analysis and Forecast By Solution Type, 2026 to 2036
- Claims Management
- Medical Coding Optimization
- Billing & Payment Processing
- Denial Management
- Payment Integrity Solutions
- Claims Management
- Y-o-Y Growth Trend Analysis By Solution Type, 2021 to 2025
- Absolute $ Opportunity Analysis By Solution Type, 2026 to 2036
- Global Market Analysis and Forecast, By Deployment Mode, 2021 to 2036
- Introduction / Key Findings
- Historical Market Size Value (USD Million) Analysis By Deployment Mode, 2021 to 2025
- Current and Future Market Size Value (USD Million) Analysis and Forecast By Deployment Mode, 2026 to 2036
- Cloud-Based
- On-Premise
- Hybrid
- Cloud-Based
- Y-o-Y Growth Trend Analysis By Deployment Mode, 2021 to 2025
- Absolute $ Opportunity Analysis By Deployment Mode, 2026 to 2036
- Global Market Analysis and Forecast, By End User, 2021 to 2036
- Introduction / Key Findings
- Historical Market Size Value (USD Million) Analysis By End User, 2021 to 2025
- Current and Future Market Size Value (USD Million) Analysis and Forecast By End User, 2026 to 2036
- Hospitals
- Physician Practices
- Ambulatory Surgery Centers
- Diagnostic Laboratories
- Specialty Clinics
- Hospitals
- Y-o-Y Growth Trend Analysis By End User, 2021 to 2025
- Absolute $ Opportunity Analysis By End User, 2026 to 2036
- Global Market Analysis and Forecast, By Function, 2021 to 2036
- Introduction / Key Findings
- Historical Market Size Value (USD Million) Analysis By Function, 2021 to 2025
- Current and Future Market Size Value (USD Million) Analysis and Forecast By Function, 2026 to 2036
- Eligibility Verification
- Claims Submission
- Claims Adjudication Support
- Revenue Leakage Detection
- Payment Reconciliation
- Eligibility Verification
- Y-o-Y Growth Trend Analysis By Function, 2021 to 2025
- Absolute $ Opportunity Analysis By Function, 2026 to 2036
- Global Market Analysis and Forecast, By Region, 2021 to 2036
- Introduction
- Historical Market Size Value (USD Million) Analysis By Region, 2021 to 2025
- Current Market Size Value (USD Million) Analysis and Forecast By Region, 2026 to 2036
- North America
- Latin America
- Western Europe
- Eastern Europe
- East Asia
- South Asia and Pacific
- Middle East & Africa
- Market Attractiveness Analysis By Region
- North America Market Analysis and Forecast, By Country, 2021 to 2036
- Historical Market Size Value (USD Million) Trend Analysis By Market Taxonomy, 2021 to 2025
- Market Size Value (USD Million) Forecast By Market Taxonomy, 2026 to 2036
- By Country
- USA
- Canada
- By Solution Type
- By Deployment Mode
- By End User
- By Function
- By Country
- Market Attractiveness Analysis
- By Country
- By Solution Type
- By Deployment Mode
- By End User
- By Function
- Key Takeaways
- Latin America Market Analysis and Forecast, By Country
- Historical Market Size Value (USD Million) Trend Analysis By Market Taxonomy, 2021 to 2025
- Market Size Value (USD Million) Forecast By Market Taxonomy, 2026 to 2036
- By Country
- Brazil
- Mexico
- Chile
- Rest of Latin America
- By Solution Type
- By Deployment Mode
- By End User
- By Function
- By Country
- Market Attractiveness Analysis
- By Country
- By Solution Type
- By Deployment Mode
- By End User
- By Function
- Key Takeaways
- Western Europe Market Analysis and Forecast, By Country
- Historical Market Size Value (USD Million) Trend Analysis By Market Taxonomy, 2021 to 2025
- Market Size Value (USD Million) Forecast By Market Taxonomy, 2026 to 2036
- By Country
- Germany
- UK
- Italy
- Spain
- France
- Nordic
- BENELUX
- Rest of Western Europe
- By Solution Type
- By Deployment Mode
- By End User
- By Function
- By Country
- Market Attractiveness Analysis
- By Country
- By Solution Type
- By Deployment Mode
- By End User
- By Function
- Key Takeaways
- Eastern Europe Market Analysis and Forecast, By Country
- Historical Market Size Value (USD Million) Trend Analysis By Market Taxonomy, 2021 to 2025
- Market Size Value (USD Million) Forecast By Market Taxonomy, 2026 to 2036
- By Country
- Russia
- Poland
- Hungary
- Balkan & Baltic
- Rest of Eastern Europe
- By Solution Type
- By Deployment Mode
- By End User
- By Function
- By Country
- Market Attractiveness Analysis
- By Country
- By Solution Type
- By Deployment Mode
- By End User
- By Function
- Key Takeaways
- East Asia Market Analysis and Forecast, By Country
- Historical Market Size Value (USD Million) Trend Analysis By Market Taxonomy, 2021 to 2025
- Market Size Value (USD Million) Forecast By Market Taxonomy, 2026 to 2036
- By Country
- China
- Japan
- South Korea
- By Solution Type
- By Deployment Mode
- By End User
- By Function
- By Country
- Market Attractiveness Analysis
- By Country
- By Solution Type
- By Deployment Mode
- By End User
- By Function
- Key Takeaways
- South Asia and Pacific Market Analysis and Forecast, By Country
- Historical Market Size Value (USD Million) Trend Analysis By Market Taxonomy, 2021 to 2025
- Market Size Value (USD Million) Forecast By Market Taxonomy, 2026 to 2036
- By Country
- India
- ASEAN
- Australia & New Zealand
- Rest of South Asia and Pacific
- By Solution Type
- By Deployment Mode
- By End User
- By Function
- By Country
- Market Attractiveness Analysis
- By Country
- By Solution Type
- By Deployment Mode
- By End User
- By Function
- Key Takeaways
- Middle East & Africa Market Analysis and Forecast, By Country
- Historical Market Size Value (USD Million) Trend Analysis By Market Taxonomy, 2021 to 2025
- Market Size Value (USD Million) Forecast By Market Taxonomy, 2026 to 2036
- By Country
- Kingdom of Saudi Arabia
- Other GCC Countries
- Türkiye
- South Africa
- Other African Union
- Rest of Middle East & Africa
- By Solution Type
- By Deployment Mode
- By End User
- By Function
- By Country
- Market Attractiveness Analysis
- By Country
- By Solution Type
- By Deployment Mode
- By End User
- By Function
- Key Takeaways
- Key Countries Market Analysis
- USA
- Pricing Analysis
- Market Share Analysis, 2025
- By Solution Type
- By Deployment Mode
- By End User
- By Function
- Canada
- Pricing Analysis
- Market Share Analysis, 2025
- By Solution Type
- By Deployment Mode
- By End User
- By Function
- Mexico
- Pricing Analysis
- Market Share Analysis, 2025
- By Solution Type
- By Deployment Mode
- By End User
- By Function
- Brazil
- Pricing Analysis
- Market Share Analysis, 2025
- By Solution Type
- By Deployment Mode
- By End User
- By Function
- Chile
- Pricing Analysis
- Market Share Analysis, 2025
- By Solution Type
- By Deployment Mode
- By End User
- By Function
- Germany
- Pricing Analysis
- Market Share Analysis, 2025
- By Solution Type
- By Deployment Mode
- By End User
- By Function
- UK
- Pricing Analysis
- Market Share Analysis, 2025
- By Solution Type
- By Deployment Mode
- By End User
- By Function
- Italy
- Pricing Analysis
- Market Share Analysis, 2025
- By Solution Type
- By Deployment Mode
- By End User
- By Function
- Spain
- Pricing Analysis
- Market Share Analysis, 2025
- By Solution Type
- By Deployment Mode
- By End User
- By Function
- France
- Pricing Analysis
- Market Share Analysis, 2025
- By Solution Type
- By Deployment Mode
- By End User
- By Function
- India
- Pricing Analysis
- Market Share Analysis, 2025
- By Solution Type
- By Deployment Mode
- By End User
- By Function
- ASEAN
- Pricing Analysis
- Market Share Analysis, 2025
- By Solution Type
- By Deployment Mode
- By End User
- By Function
- Australia & New Zealand
- Pricing Analysis
- Market Share Analysis, 2025
- By Solution Type
- By Deployment Mode
- By End User
- By Function
- China
- Pricing Analysis
- Market Share Analysis, 2025
- By Solution Type
- By Deployment Mode
- By End User
- By Function
- Japan
- Pricing Analysis
- Market Share Analysis, 2025
- By Solution Type
- By Deployment Mode
- By End User
- By Function
- South Korea
- Pricing Analysis
- Market Share Analysis, 2025
- By Solution Type
- By Deployment Mode
- By End User
- By Function
- Russia
- Pricing Analysis
- Market Share Analysis, 2025
- By Solution Type
- By Deployment Mode
- By End User
- By Function
- Poland
- Pricing Analysis
- Market Share Analysis, 2025
- By Solution Type
- By Deployment Mode
- By End User
- By Function
- Hungary
- Pricing Analysis
- Market Share Analysis, 2025
- By Solution Type
- By Deployment Mode
- By End User
- By Function
- Kingdom of Saudi Arabia
- Pricing Analysis
- Market Share Analysis, 2025
- By Solution Type
- By Deployment Mode
- By End User
- By Function
- Türkiye
- Pricing Analysis
- Market Share Analysis, 2025
- By Solution Type
- By Deployment Mode
- By End User
- By Function
- South Africa
- Pricing Analysis
- Market Share Analysis, 2025
- By Solution Type
- By Deployment Mode
- By End User
- By Function
- USA
- Market Structure Analysis
- Competition Dashboard
- Competition Benchmarking
- Market Share Analysis of Top Players
- By Regional
- By Solution Type
- By Deployment Mode
- By End User
- By Function
- Emerging Startups
- Innovation Benchmarking
- Competition Analysis
- Competition Deep Dive
- Optum (UnitedHealth Group)
- Overview
- Product Portfolio
- Profitability by Market Segments
- Sales Footprint
- Strategy Overview
- Marketing Strategy
- Product Strategy
- Channel Strategy
- Change Healthcare
- McKesson Corporation
- Epic Systems Corporation
- Oracle Health
- Athenahealth, Inc.
- Waystar
- Experian Health
- R1 RCM Inc.
- Conifer Health Solutions
- Optum (UnitedHealth Group)
- Case Studies
- Success Stories
- Recent Developments
- Competition Deep Dive
- Assumptions & Acronyms Used


