Hinged Food Containers Market Size and Share Forecast Outlook 2025 to 2035

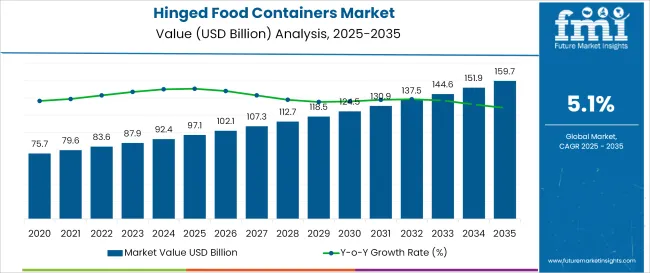
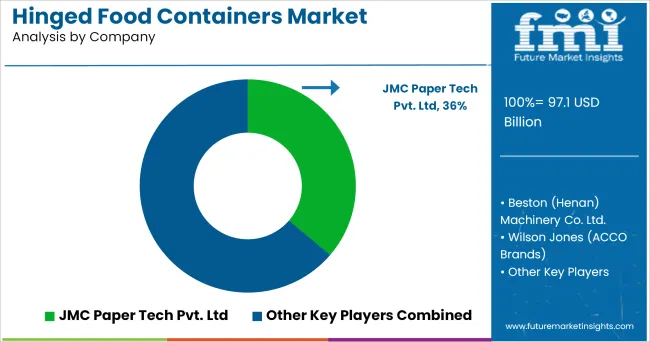
The hinged food containers market is projected to grow from USD 97.1 billion in 2025 to USD 167.8 billion by 2035, registering a CAGR of 5.1% during the forecast period. Sales in 2024 reached USD 92.3 billion. This growth has been driven by increasing demand for convenient and sustainable food packaging solutions.

The rise of online food delivery platforms and changing consumer lifestyles have significantly increased the need for durable and eco-friendly containers. Advancements in packaging technologies, including insulated and microwave-safe designs, are further fueling adoption across the foodservice sector. However, challenges such as stringent government regulations on plastic usage and fluctuating raw material costs impact manufacturing expenses.

In January 2024, Sabert Corporation, a leading global manufacturer of innovative food packaging solutions, has announced the launch of its new Pulp Hinged Containers and Pulp Portion Cups, further expanding its popular line of sustainable and compostable products.

“As demand grows for sustainable food packaging, we engineered our Pulp Hinged Containers and Portion Cups to provide the ideal blend of convenience and quality while also being better for the environment,” said Stephny Halstead, Vice President of Marketing and New Product Development, Sabert. “We understand the importance of providing high-quality packaging solutions that meet our customers’ functional needs and align with their unique environmental goals.”

Metric Value
Market Size (2025E) USD 97.1 billion
Market Value (2035F) USD 167.8 billion
CAGR (2025 to 2035) 5.1%

The hinged food containers market has been significantly influenced by the increasing demand for sustainable and environmentally friendly packaging solutions. Manufacturers have been transitioning towards biodegradable and recyclable materials to align with environmental sustainability goals and meet consumer preferences for eco-conscious products.

Innovations in material science have led to the development of hinged food containers that not only provide superior protection but also minimize environmental impact. Additionally, advancements in manufacturing technologies have enabled the production of customizable and efficient hinged food containers, catering to a wide range of applications across different industries.

Looking ahead, the Hinged Food Containers Market is poised for continued growth, driven by the ongoing expansion of the food delivery sector and the increasing emphasis on sustainable packaging solutions. The market's trajectory suggests a steady rise in demand for innovative, eco-friendly hinged food containers that cater to both consumer preferences and regulatory requirements.

Companies investing in research and development to create durable, cost-effective, and environmentally friendly hinged food containers are expected to gain a competitive edge. The integration of advanced materials and ergonomic designs will likely play a crucial role in shaping the future of the hinged food containers market.

Analyzing Hinged Food Containers Market by Top Investment Segment

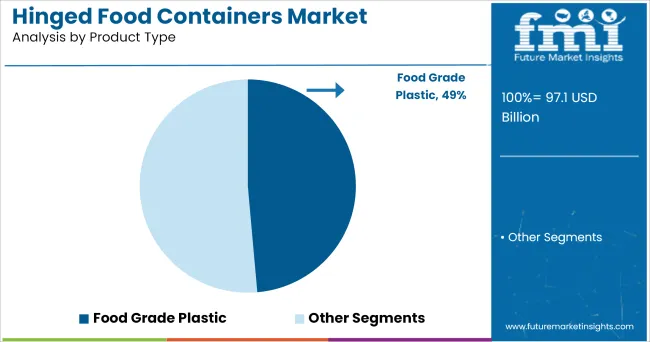
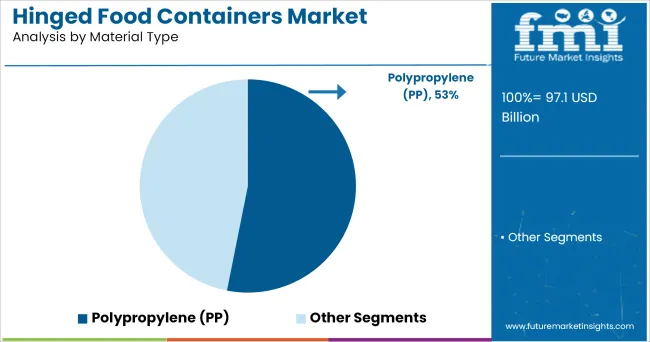
The market is segmented based on product type, material type, end-use industry, and region. By product type, the market includes food grade plastic, microwave safe, freezer safe, easily stackable, and others. In terms of material type, the market is categorized into polypropylene (PP), polyethylene terephthalate (PET), polystyrene (PS), bagasse, paperboard, and polylactic acid (PLA)/compostable materials.

By end-use industry, the market comprises quick service restaurants (QSR), catering services, institutional foodservice, supermarkets & delis, bakery & confectionery, and meal delivery services. Regionally, the market is analyzed across North America, Latin America, East Asia, South Asia & Pacific, Eastern Europe, Western Europe, Oceania, and the Middle East & Africa.

Microwave-Safe Containers Preferred for Heat Retention and Convenience

Microwave-safe hinged food containers have been estimated to account for 41.8% of the total market share in 2025, owing to their compatibility with reheating and takeaway convenience. These containers have been widely used across QSRs, meal delivery platforms, and cafeterias for their ability to maintain food quality during reheating.

Consumer preference for heat-and-eat packaging has driven rapid adoption across urban and semi-urban markets. Safe polymer compositions and compliance with FDA and EU food safety norms have further reinforced their dominance. Polypropylene (PP) and CPET-based microwave-safe containers have been developed with added insulation and warp-resistance features. Lidded designs with steam vents have been introduced to prevent condensation and preserve food texture. Custom molding has enabled compatibility with varied cuisines and portion sizes.

Foodservice operators have integrated microwave-safe containers into packaging lines to support delivery and in-store pickup channels. These formats have been favored for minimizing cross-contamination and ensuring hygiene during transport. Labeling with reheating instructions has improved user experience and customer trust.

Compliance with recyclable or reusable standards has also been prioritized to meet sustainability targets. Investments have been made in R&D to develop dual-use packaging suitable for both microwave and freezer applications. Recycled content and mono-material options have been increasingly launched to align with global ESG goals. Market growth is expected to be driven by expanding meal kit services and prepared food retailing.

QSR Chains Identified as Primary End User of Hinged Food Containers

Quick service restaurants (QSR) have been projected to represent 34.5% of the hinged food container market share in 2025, owing to high-volume demand for takeaway, delivery, and dine-out services. Containers used in this sector have been required to be leak-proof, tamper-evident, and microwave-compatible. Multiple compartments and stackable designs have been favored to facilitate combo meals and efficient handling.

QSR packaging has been critical to brand image, convenience, and food safety assurance. Standardized formats have been deployed by global chains to streamline operations across locations and vendors. Branding has been supported through embossing and in-mold labeling on hinged containers. Tamper-proof locking mechanisms have been added to prevent spills and ensure customer confidence. Sustainability has been promoted via recyclable plastics and compostable alternatives.

QSR brands have collaborated with packaging manufacturers to develop containers tailored to regional cuisines and delivery formats. Data from delivery platforms has been used to optimize packaging design for temperature retention and durability. With high transaction frequency, packaging reliability has been critical to customer retention and service consistency.

Automation-ready formats have been preferred to support high-throughput kitchen operations. Global expansion of QSR brands and the surge in online ordering have reinforced container demand in this segment. Hinged containers have been aligned with food safety regulations and third-party delivery requirements. Demand for tamper-evident packaging has increased due to food hygiene concerns.

Challenges and Opportunities

Challenges

Environmental Concerns and Regulatory Restrictions

The single-use plastic packaging has garnered regulatory pressures which is one of the major challenges in the hinged food containers market. To help reduce environmental waste, many governments have imposed plastic bans and sustainability mandates, forcing manufacturers to look for eco-friendly substitutes.

However, that biodegradable and compostable materials have a higher production cost per item, which creates an obstacle to their widespread uptake, especially for small & mid-sized food companies. Maintaining cost-effectiveness while still meeting environmental regulations can be a massive challenge for companies.

Opportunities

Rising Demand for Sustainable and Innovative Packaging

The trends toward sustainable food packaging solutions provide an opportunity for companies to service this need by creating biodegradable, recyclable, and reusable hinged food containers. Molded fiber, bagasse, PLA (polylactic acid), and other plant-based material innovations are becoming increasingly mainstream.

Food delivery services and takeaway culture are also on the rise, leading to the greater need for leak-proof, thermally insulated, and durable containers. The trend towards sustainability, personalization, and the Internet of Things (IoT) remains, and businesses that adopt more eco-friendly, customizable, and intelligent packaging will be in demand as consumer preferences and regulations evolve.

Country-wise Outlook

United States

Geographically, hinged food containers market in North America is expected to witness unprecedented growth due to several factors such as, growing food delivery services, increasing customer budget for sustainable packaging and strict regulations on plastic waste.

Moreover, the growing implementation of biodegradable and compostable packaging solutions is also contributing to the market growth. Another crucial end-user is hinged food containers from QSRs (quick-service restaurants) and convenience stores which supports the constant growth of the market.

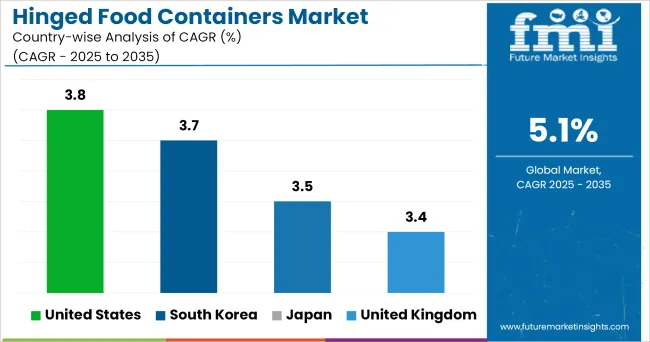
Country CAGR (2025 to 2035)
United States 3.8%

United Kingdom

Demand for hinged food containers in the United Kingdom is on the rise, driven by growing consumer preference for sustainable packaging options and government directives on the use of single-use plastics. The popularity of online food delivery services and food takeout culture is increasing the demand for innovative and sustainable container options.

Country CAGR (2025 to 2035)
United Kingdom 3.4%

European Union

The hinged food containers market in the European Union region is anticipated to witness steady growth owing to stringent environmental regulations, growing focus on sustainable packaging and increasing popularity of takeout food services. The market growth of Germany, France and Italy are leading the momentum with biodegradable and recyclable packaging materials.

Country CAGR (2025 to 2035)
European Union 3.6%

Japan

Japan food containers in hinged category segment is flourishing steadily due to presence of well-entrenched convenience store culture, high demand for ready to eat meals and innovation in sustainable packaging materials. Market growth is also being driven by a growing trend towards green and refillable containers, as well as government regulations to reduce plastic waste.

Country CAGR (2025 to 2035)
Japan 3.5%

South Korea

Rapid growth of online food delivery platforms in the country, increased awareness regarding sustainable packaging, and stringent government policies concerning plastic reduction are playing an instrumental role in driving the target market in South Korea. The market is being driven by the increasing demand for instant food packaging that is composed of high-quality raw materials and heat resistance, as well as the demand for compostable food packaging materials.

Country CAGR (2025 to 2035)
South Korea 3.7%

Competitive Outlook

The hinged food containers market is driven by the increasing demand for sustainable and convenient food packaging solutions. These packaging solutions come with secure closure features, leak-protection, recyclability, etc., owing to which are most favoured in certain end user segments such as food service, retail, and appetizer delivery. Manufacturers have focused on sustainable materials, innovative locking systems, and improved insulation properties to appeal to consumer preferences.

Important Companies

  • Pactiv Evergreen Inc.-Provides environmentally friendly food packaging, such as fiber-based and compostable hinged containers.
  • Eco-Products, Inc.-Provides biodegradable food packaging solutions using renewable materials
  • Novolex Holdings, Inc.-Custom food container solutions with integrated locking system.
  • Placon Corporation-Here are durable, transparent, hinged containers that promote product visibility and help keep food fresher longer.

Key Segmentation

By Product Type:

  • Food Grade Plastic
  • Microwave Safe
  • Freezer Safe
  • Easily Stackable
  • Others

By Material Type:

  • Polypropylene (PP)
  • Polyethylene Terephthalate (PET)
  • Polystyrene (PS)
  • Bagasse
  • Paperboard
  • Polylactic Acid (PLA)/Compostable Materials

By End-Use Industry:

  • Quick Service Restaurants (QSR)
  • Catering Services
  • Institutional Foodservice
  • Supermarkets & Delis
  • Bakery & Confectionery
  • Meal Delivery Services

By Region:

  • North America
  • Latin America
  • East Asia
  • South Asia & Pacific
  • Eastern Europe
  • Western Europe
  • Oceania
  • Middle East & Africa

Table of Content

  1. Executive Summary
    • Global Market Outlook
    • Demand-side Trends
    • Supply-side Trends
    • Technology Roadmap Analysis
    • Analysis and Recommendations
  2. Market Overview
    • Market Coverage / Taxonomy
    • Market Definition / Scope / Limitations
  3. Market Background
    • Market Dynamics
      • Drivers
      • Restraints
      • Opportunity
      • Trends
    • Scenario Forecast
      • Demand in Optimistic Scenario
      • Demand in Likely Scenario
      • Demand in Conservative Scenario
    • Opportunity Map Analysis
    • Product Life Cycle Analysis
    • Supply Chain Analysis
      • Supply Side Participants and their Roles
        • Producers
        • Mid-Level Participants (Traders/ Agents/ Brokers)
        • Wholesalers and Distributors
      • Value Added and Value Created at Node in the Supply Chain
      • List of Raw Material Suppliers
      • List of Existing and Potential Buyer’s
    • Investment Feasibility Matrix
    • Value Chain Analysis
      • Profit Margin Analysis
      • Wholesalers and Distributors
      • Retailers
    • PESTLE and Porter’s Analysis
    • Regulatory Landscape
      • By Key Regions
      • By Key Countries
    • Regional Parent Market Outlook
    • Production and Consumption Statistics
    • Import and Export Statistics
  4. Global Market Analysis 2020 to 2024 and Forecast, 2025 to 2035
    • Historical Market Size Value (USD Million) & Volume (Units) Analysis, 2020 to 2024
    • Current and Future Market Size Value (USD Million) & Volume (Units) Projections, 2025 to 2035
      • Y-o-Y Growth Trend Analysis
      • Absolute $ Opportunity Analysis
  5. Global Market Analysis 2020 to 2024 and Forecast 2025 to 2035, By Product Type
    • Introduction / Key Findings
    • Historical Market Size Value (USD Million) & Volume (Units) Analysis By Product Type, 2020 to 2024
    • Current and Future Market Size Value (USD Million) & Volume (Units) Analysis and Forecast By Product Type, 2025 to 2035
      • Food Grade Plastic
      • Microwave Safe
      • Freezer Safe
      • Easily Stackable
      • Others
    • Y-o-Y Growth Trend Analysis By Product Type, 2020 to 2024
    • Absolute $ Opportunity Analysis By Product Type, 2025 to 2035
  6. Global Market Analysis 2020 to 2024 and Forecast 2025 to 2035, By Material Type
    • Introduction / Key Findings
    • Historical Market Size Value (USD Million) & Volume (Units) Analysis By Material Type, 2020 to 2024
    • Current and Future Market Size Value (USD Million) & Volume (Units) Analysis and Forecast By Material Type, 2025 to 2035
      • Polypropylene (PP)
      • Polyethylene Terephthalate (PET)
      • Polystyrene (PS)
      • Bagasse
      • Paperboard
      • Polylactic Acid (PLA)/Compostable Materials
    • Y-o-Y Growth Trend Analysis By Material Type, 2020 to 2024
    • Absolute $ Opportunity Analysis By Material Type, 2025 to 2035
  7. Global Market Analysis 2020 to 2024 and Forecast 2025 to 2035, By End-Use Industry
    • Introduction / Key Findings
    • Historical Market Size Value (USD Million) & Volume (Units) Analysis By End-Use Industry, 2020 to 2024
    • Current and Future Market Size Value (USD Million) & Volume (Units) Analysis and Forecast By End-Use Industry, 2025 to 2035
      • Quick Service Restaurants (QSR)
      • Catering Services
      • Institutional Foodservice
      • Supermarkets & Delis
      • Bakery & Confectionery
      • Meal Delivery Services
    • Y-o-Y Growth Trend Analysis By End-Use Industry, 2020 to 2024
    • Absolute $ Opportunity Analysis By End-Use Industry, 2025 to 2035
  8. Global Market Analysis 2020 to 2024 and Forecast 2025 to 2035, By Region
    • Introduction
    • Historical Market Size Value (USD Million) & Volume (Units) Analysis By Region, 2020 to 2024
    • Current Market Size Value (USD Million) & Volume (Units) Analysis and Forecast By Region, 2025 to 2035
      • North America
      • Latin America
      • Europe
      • East Asia
      • South Asia
      • Oceania
      • MEA
    • Market Attractiveness Analysis By Region
  9. North America Market Analysis 2020 to 2024 and Forecast 2025 to 2035, By Country
    • Historical Market Size Value (USD Million) & Volume (Units) Trend Analysis By Market Taxonomy, 2020 to 2024
    • Market Size Value (USD Million) & Volume (Units) Forecast By Market Taxonomy, 2025 to 2035
      • By Country
        • USA
        • Canada
      • By Product Type
      • By Material Type
      • By End-Use Industry
    • Market Attractiveness Analysis
      • By Country
      • By Product Type
      • By Material Type
      • By End-Use Industry
    • Key Takeaways
  10. Latin America Market Analysis 2020 to 2024 and Forecast 2025 to 2035, By Country
    • Historical Market Size Value (USD Million) & Volume (Units) Trend Analysis By Market Taxonomy, 2020 to 2024
    • Market Size Value (USD Million) & Volume (Units) Forecast By Market Taxonomy, 2025 to 2035
      • By Country
        • Brazil
        • Mexico
        • Argentina
        • Chile
        • Peru
        • Rest of Latin America
      • By Product Type
      • By Material Type
      • By End-Use Industry
    • Market Attractiveness Analysis
      • By Country
      • By Product Type
      • By Material Type
      • By End-Use Industry
    • Key Takeaways
  11. Europe Market Analysis 2020 to 2024 and Forecast 2025 to 2035, By Country
    • Historical Market Size Value (USD Million) & Volume (Units) Trend Analysis By Market Taxonomy, 2020 to 2024
    • Market Size Value (USD Million) & Volume (Units) Forecast By Market Taxonomy, 2025 to 2035
      • By Country
        • Germany
        • Italy
        • France
        • UK
        • Spain
        • Russia
        • BENELUX
        • Rest of Europe
      • By Product Type
      • By Material Type
      • By End-Use Industry
    • Market Attractiveness Analysis
      • By Country
      • By Product Type
      • By Material Type
      • By End-Use Industry
    • Key Takeaways
  12. East Asia Market Analysis 2020 to 2024 and Forecast 2025 to 2035, By Country
    • Historical Market Size Value (USD Million) & Volume (Units) Trend Analysis By Market Taxonomy, 2020 to 2024
    • Market Size Value (USD Million) & Volume (Units) Forecast By Market Taxonomy, 2025 to 2035
      • By Country
        • China
        • Japan
        • South Korea
      • By Product Type
      • By Material Type
      • By End-Use Industry
    • Market Attractiveness Analysis
      • By Country
      • By Product Type
      • By Material Type
      • By End-Use Industry
    • Key Takeaways
  13. South Asia Market Analysis 2020 to 2024 and Forecast 2025 to 2035, By Country
    • Historical Market Size Value (USD Million) & Volume (Units) Trend Analysis By Market Taxonomy, 2020 to 2024
    • Market Size Value (USD Million) & Volume (Units) Forecast By Market Taxonomy, 2025 to 2035
      • By Country
        • India
        • Thailand
        • Malaysia
        • Indonesia
        • Rest of South Asia
      • By Product Type
      • By Material Type
      • By End-Use Industry
    • Market Attractiveness Analysis
      • By Country
      • By Product Type
      • By Material Type
      • By End-Use Industry
    • Key Takeaways
  14. Oceania Market Analysis 2020 to 2024 and Forecast 2025 to 2035, By Country
    • Historical Market Size Value (USD Million) & Volume (Units) Trend Analysis By Market Taxonomy, 2020 to 2024
    • Market Size Value (USD Million) & Volume (Units) Forecast By Market Taxonomy, 2025 to 2035
      • By Country
        • Australia
        • New Zealand
      • By Product Type
      • By Material Type
      • By End-Use Industry
    • Market Attractiveness Analysis
      • By Country
      • By Product Type
      • By Material Type
      • By End-Use Industry
    • Key Takeaways
  15. MEA Market Analysis 2020 to 2024 and Forecast 2025 to 2035, By Country
    • Historical Market Size Value (USD Million) & Volume (Units) Trend Analysis By Market Taxonomy, 2020 to 2024
    • Market Size Value (USD Million) & Volume (Units) Forecast By Market Taxonomy, 2025 to 2035
      • By Country
        • GCC
        • Rest of MEA
      • By Product Type
      • By Material Type
      • By End-Use Industry
    • Market Attractiveness Analysis
      • By Country
      • By Product Type
      • By Material Type
      • By End-Use Industry
    • Key Takeaways
  16. Key Countries Market Analysis
    • USA
      • Pricing Analysis
      • Market Share Analysis, 2024
        • By Product Type
        • By Material Type
        • By End-Use Industry
    • Canada
      • Pricing Analysis
      • Market Share Analysis, 2024
        • By Product Type
        • By Material Type
        • By End-Use Industry
    • Brazil
      • Pricing Analysis
      • Market Share Analysis, 2024
        • By Product Type
        • By Material Type
        • By End-Use Industry
    • Mexico
      • Pricing Analysis
      • Market Share Analysis, 2024
        • By Product Type
        • By Material Type
        • By End-Use Industry
    • Argentina
      • Pricing Analysis
      • Market Share Analysis, 2024
        • By Product Type
        • By Material Type
        • By End-Use Industry
  17. Market Structure Analysis
    • Competition Dashboard
    • Competition Benchmarking
    • Market Share Analysis of Top Players
      • By Regional
      • By Product Type
      • By Material Type
      • By End-Use Industry
  18. Competition Analysis
    • Competition Deep Dive
      • Dart Container Corporation
        • Overview
        • Product Portfolio
        • Profitability by Market Segments (Product/Age /Sales Channel/Region)
        • Sales Footprint
        • Strategy Overview
          • Marketing Strategy
          • Product Strategy
          • Channel Strategy
      • Sabert Corporation
        • Overview
        • Product Portfolio
        • Profitability by Market Segments (Product/Age /Sales Channel/Region)
        • Sales Footprint
        • Strategy Overview
          • Marketing Strategy
          • Product Strategy
          • Channel Strategy
      • Anchor Packaging
        • Overview
        • Product Portfolio
        • Profitability by Market Segments (Product/Age /Sales Channel/Region)
        • Sales Footprint
        • Strategy Overview
          • Marketing Strategy
          • Product Strategy
          • Channel Strategy
      • Genpak LLC
        • Overview
        • Product Portfolio
        • Profitability by Market Segments (Product/Age /Sales Channel/Region)
        • Sales Footprint
        • Strategy Overview
          • Marketing Strategy
          • Product Strategy
          • Channel Strategy
      • Pactiv Evergreen Inc.
        • Overview
        • Product Portfolio
        • Profitability by Market Segments (Product/Age /Sales Channel/Region)
        • Sales Footprint
        • Strategy Overview
          • Marketing Strategy
          • Product Strategy
          • Channel Strategy
      • Eco-Products, Inc.
        • Overview
        • Product Portfolio
        • Profitability by Market Segments (Product/Age /Sales Channel/Region)
        • Sales Footprint
        • Strategy Overview
          • Marketing Strategy
          • Product Strategy
          • Channel Strategy
      • Novolex Holdings, Inc.
        • Overview
        • Product Portfolio
        • Profitability by Market Segments (Product/Age /Sales Channel/Region)
        • Sales Footprint
        • Strategy Overview
          • Marketing Strategy
          • Product Strategy
          • Channel Strategy
      • Placon Corporation
        • Overview
        • Product Portfolio
        • Profitability by Market Segments (Product/Age /Sales Channel/Region)
        • Sales Footprint
        • Strategy Overview
          • Marketing Strategy
          • Product Strategy
          • Channel Strategy
      • Cambro
        • Overview
        • Product Portfolio
        • Profitability by Market Segments (Product/Age /Sales Channel/Region)
        • Sales Footprint
        • Strategy Overview
          • Marketing Strategy
          • Product Strategy
          • Channel Strategy
      • Amcor plc
        • Overview
        • Product Portfolio
        • Profitability by Market Segments (Product/Age /Sales Channel/Region)
        • Sales Footprint
        • Strategy Overview
          • Marketing Strategy
          • Product Strategy
          • Channel Strategy
  19. Assumptions & Acronyms Used
  20. Research Methodology

List of Tables

  • Table 1: Global Market Value (USD Million) Forecast by Region, 2020-2035
  • Table 2: Global Market Volume (Units) Forecast by Region, 2020-2035
  • Table 3: Global Market Value (USD Million) Forecast by Product Type, 2020-2035
  • Table 4: Global Market Volume (Units) Forecast by Product Type, 2020-2035
  • Table 5: Global Market Value (USD Million) Forecast by Material Type, 2020-2035
  • Table 6: Global Market Volume (Units) Forecast by Material Type, 2020-2035
  • Table 7: Global Market Value (USD Million) Forecast by End-Use Industry, 2020-2035
  • Table 8: Global Market Volume (Units) Forecast by End-Use Industry, 2020-2035
  • Table 9: North America Market Value (USD Million) Forecast by Country, 2020-2035
  • Table 10: North America Market Volume (Units) Forecast by Country, 2020-2035
  • Table 11: North America Market Value (USD Million) Forecast by Product Type, 2020-2035
  • Table 12: North America Market Volume (Units) Forecast by Product Type, 2020-2035
  • Table 13: North America Market Value (USD Million) Forecast by Material Type, 2020-2035
  • Table 14: North America Market Volume (Units) Forecast by Material Type, 2020-2035
  • Table 15: North America Market Value (USD Million) Forecast by End-Use Industry, 2020-2035
  • Table 16: North America Market Volume (Units) Forecast by End-Use Industry, 2020-2035
  • Table 17: Latin America Market Value (USD Million) Forecast by Country, 2020-2035
  • Table 18: Latin America Market Volume (Units) Forecast by Country, 2020-2035
  • Table 19: Latin America Market Value (USD Million) Forecast by Product Type, 2020-2035
  • Table 20: Latin America Market Volume (Units) Forecast by Product Type, 2020-2035
  • Table 21: Latin America Market Value (USD Million) Forecast by Material Type, 2020-2035
  • Table 22: Latin America Market Volume (Units) Forecast by Material Type, 2020-2035
  • Table 23: Latin America Market Value (USD Million) Forecast by End-Use Industry, 2020-2035
  • Table 24: Latin America Market Volume (Units) Forecast by End-Use Industry, 2020-2035
  • Table 25: Europe Market Value (USD Million) Forecast by Country, 2020-2035
  • Table 26: Europe Market Volume (Units) Forecast by Country, 2020-2035
  • Table 27: Europe Market Value (USD Million) Forecast by Product Type, 2020-2035
  • Table 28: Europe Market Volume (Units) Forecast by Product Type, 2020-2035
  • Table 29: Europe Market Value (USD Million) Forecast by Material Type, 2020-2035
  • Table 30: Europe Market Volume (Units) Forecast by Material Type, 2020-2035
  • Table 31: Europe Market Value (USD Million) Forecast by End-Use Industry, 2020-2035
  • Table 32: Europe Market Volume (Units) Forecast by End-Use Industry, 2020-2035
  • Table 33: East Asia Market Value (USD Million) Forecast by Country, 2020-2035
  • Table 34: East Asia Market Volume (Units) Forecast by Country, 2020-2035
  • Table 35: East Asia Market Value (USD Million) Forecast by Product Type, 2020-2035
  • Table 36: East Asia Market Volume (Units) Forecast by Product Type, 2020-2035
  • Table 37: East Asia Market Value (USD Million) Forecast by Material Type, 2020-2035
  • Table 38: East Asia Market Volume (Units) Forecast by Material Type, 2020-2035
  • Table 39: East Asia Market Value (USD Million) Forecast by End-Use Industry, 2020-2035
  • Table 40: East Asia Market Volume (Units) Forecast by End-Use Industry, 2020-2035
  • Table 41: South Asia Market Value (USD Million) Forecast by Country, 2020-2035
  • Table 42: South Asia Market Volume (Units) Forecast by Country, 2020-2035
  • Table 43: South Asia Market Value (USD Million) Forecast by Product Type, 2020-2035
  • Table 44: South Asia Market Volume (Units) Forecast by Product Type, 2020-2035
  • Table 45: South Asia Market Value (USD Million) Forecast by Material Type, 2020-2035
  • Table 46: South Asia Market Volume (Units) Forecast by Material Type, 2020-2035
  • Table 47: South Asia Market Value (USD Million) Forecast by End-Use Industry, 2020-2035
  • Table 48: South Asia Market Volume (Units) Forecast by End-Use Industry, 2020-2035
  • Table 49: Oceania Market Value (USD Million) Forecast by Country, 2020-2035
  • Table 50: Oceania Market Volume (Units) Forecast by Country, 2020-2035
  • Table 51: Oceania Market Value (USD Million) Forecast by Product Type, 2020-2035
  • Table 52: Oceania Market Volume (Units) Forecast by Product Type, 2020-2035
  • Table 53: Oceania Market Value (USD Million) Forecast by Material Type, 2020-2035
  • Table 54: Oceania Market Volume (Units) Forecast by Material Type, 2020-2035
  • Table 55: Oceania Market Value (USD Million) Forecast by End-Use Industry, 2020-2035
  • Table 56: Oceania Market Volume (Units) Forecast by End-Use Industry, 2020-2035
  • Table 57: MEA Market Value (USD Million) Forecast by Country, 2020-2035
  • Table 58: MEA Market Volume (Units) Forecast by Country, 2020-2035
  • Table 59: MEA Market Value (USD Million) Forecast by Product Type, 2020-2035
  • Table 60: MEA Market Volume (Units) Forecast by Product Type, 2020-2035
  • Table 61: MEA Market Value (USD Million) Forecast by Material Type, 2020-2035
  • Table 62: MEA Market Volume (Units) Forecast by Material Type, 2020-2035
  • Table 63: MEA Market Value (USD Million) Forecast by End-Use Industry, 2020-2035
  • Table 64: MEA Market Volume (Units) Forecast by End-Use Industry, 2020-2035

List of Figures

  • Figure 1: Global Market Value (USD Million) by Product Type, 2025-2035
  • Figure 2: Global Market Value (USD Million) by Material Type, 2025-2035
  • Figure 3: Global Market Value (USD Million) by End-Use Industry, 2025-2035
  • Figure 4: Global Market Value (USD Million) by Region, 2025-2035
  • Figure 5: Global Market Value (USD Million) Analysis by Region, 2020-2035
  • Figure 6: Global Market Volume (Units) Analysis by Region, 2020-2035
  • Figure 7: Global Market Value Share (%) and BPS Analysis by Region, 2025-2035
  • Figure 8: Global Market Y-o-Y Growth (%) Projections by Region, 2025-2035
  • Figure 9: Global Market Value (USD Million) Analysis by Product Type, 2020-2035
  • Figure 10: Global Market Volume (Units) Analysis by Product Type, 2020-2035
  • Figure 11: Global Market Value Share (%) and BPS Analysis by Product Type, 2025-2035
  • Figure 12: Global Market Y-o-Y Growth (%) Projections by Product Type, 2025-2035
  • Figure 13: Global Market Value (USD Million) Analysis by Material Type, 2020-2035
  • Figure 14: Global Market Volume (Units) Analysis by Material Type, 2020-2035
  • Figure 15: Global Market Value Share (%) and BPS Analysis by Material Type, 2025-2035
  • Figure 16: Global Market Y-o-Y Growth (%) Projections by Material Type, 2025-2035
  • Figure 17: Global Market Value (USD Million) Analysis by End-Use Industry, 2020-2035
  • Figure 18: Global Market Volume (Units) Analysis by End-Use Industry, 2020-2035
  • Figure 19: Global Market Value Share (%) and BPS Analysis by End-Use Industry, 2025-2035
  • Figure 20: Global Market Y-o-Y Growth (%) Projections by End-Use Industry, 2025-2035
  • Figure 21: Global Market Attractiveness by Product Type, 2025-2035
  • Figure 22: Global Market Attractiveness by Material Type, 2025-2035
  • Figure 23: Global Market Attractiveness by End-Use Industry, 2025-2035
  • Figure 24: Global Market Attractiveness by Region, 2025-2035
  • Figure 25: North America Market Value (USD Million) by Product Type, 2025-2035
  • Figure 26: North America Market Value (USD Million) by Material Type, 2025-2035
  • Figure 27: North America Market Value (USD Million) by End-Use Industry, 2025-2035
  • Figure 28: North America Market Value (USD Million) by Country, 2025-2035
  • Figure 29: North America Market Value (USD Million) Analysis by Country, 2020-2035
  • Figure 30: North America Market Volume (Units) Analysis by Country, 2020-2035
  • Figure 31: North America Market Value Share (%) and BPS Analysis by Country, 2025-2035
  • Figure 32: North America Market Y-o-Y Growth (%) Projections by Country, 2025-2035
  • Figure 33: North America Market Value (USD Million) Analysis by Product Type, 2020-2035
  • Figure 34: North America Market Volume (Units) Analysis by Product Type, 2020-2035
  • Figure 35: North America Market Value Share (%) and BPS Analysis by Product Type, 2025-2035
  • Figure 36: North America Market Y-o-Y Growth (%) Projections by Product Type, 2025-2035
  • Figure 37: North America Market Value (USD Million) Analysis by Material Type, 2020-2035
  • Figure 38: North America Market Volume (Units) Analysis by Material Type, 2020-2035
  • Figure 39: North America Market Value Share (%) and BPS Analysis by Material Type, 2025-2035
  • Figure 40: North America Market Y-o-Y Growth (%) Projections by Material Type, 2025-2035
  • Figure 41: North America Market Value (USD Million) Analysis by End-Use Industry, 2020-2035
  • Figure 42: North America Market Volume (Units) Analysis by End-Use Industry, 2020-2035
  • Figure 43: North America Market Value Share (%) and BPS Analysis by End-Use Industry, 2025-2035
  • Figure 44: North America Market Y-o-Y Growth (%) Projections by End-Use Industry, 2025-2035
  • Figure 45: North America Market Attractiveness by Product Type, 2025-2035
  • Figure 46: North America Market Attractiveness by Material Type, 2025-2035
  • Figure 47: North America Market Attractiveness by End-Use Industry, 2025-2035
  • Figure 48: North America Market Attractiveness by Country, 2025-2035
  • Figure 49: Latin America Market Value (USD Million) by Product Type, 2025-2035
  • Figure 50: Latin America Market Value (USD Million) by Material Type, 2025-2035
  • Figure 51: Latin America Market Value (USD Million) by End-Use Industry, 2025-2035
  • Figure 52: Latin America Market Value (USD Million) by Country, 2025-2035
  • Figure 53: Latin America Market Value (USD Million) Analysis by Country, 2020-2035
  • Figure 54: Latin America Market Volume (Units) Analysis by Country, 2020-2035
  • Figure 55: Latin America Market Value Share (%) and BPS Analysis by Country, 2025-2035
  • Figure 56: Latin America Market Y-o-Y Growth (%) Projections by Country, 2025-2035
  • Figure 57: Latin America Market Value (USD Million) Analysis by Product Type, 2020-2035
  • Figure 58: Latin America Market Volume (Units) Analysis by Product Type, 2020-2035
  • Figure 59: Latin America Market Value Share (%) and BPS Analysis by Product Type, 2025-2035
  • Figure 60: Latin America Market Y-o-Y Growth (%) Projections by Product Type, 2025-2035
  • Figure 61: Latin America Market Value (USD Million) Analysis by Material Type, 2020-2035
  • Figure 62: Latin America Market Volume (Units) Analysis by Material Type, 2020-2035
  • Figure 63: Latin America Market Value Share (%) and BPS Analysis by Material Type, 2025-2035
  • Figure 64: Latin America Market Y-o-Y Growth (%) Projections by Material Type, 2025-2035
  • Figure 65: Latin America Market Value (USD Million) Analysis by End-Use Industry, 2020-2035
  • Figure 66: Latin America Market Volume (Units) Analysis by End-Use Industry, 2020-2035
  • Figure 67: Latin America Market Value Share (%) and BPS Analysis by End-Use Industry, 2025-2035
  • Figure 68: Latin America Market Y-o-Y Growth (%) Projections by End-Use Industry, 2025-2035
  • Figure 69: Latin America Market Attractiveness by Product Type, 2025-2035
  • Figure 70: Latin America Market Attractiveness by Material Type, 2025-2035
  • Figure 71: Latin America Market Attractiveness by End-Use Industry, 2025-2035
  • Figure 72: Latin America Market Attractiveness by Country, 2025-2035
  • Figure 73: Europe Market Value (USD Million) by Product Type, 2025-2035
  • Figure 74: Europe Market Value (USD Million) by Material Type, 2025-2035
  • Figure 75: Europe Market Value (USD Million) by End-Use Industry, 2025-2035
  • Figure 76: Europe Market Value (USD Million) by Country, 2025-2035
  • Figure 77: Europe Market Value (USD Million) Analysis by Country, 2020-2035
  • Figure 78: Europe Market Volume (Units) Analysis by Country, 2020-2035
  • Figure 79: Europe Market Value Share (%) and BPS Analysis by Country, 2025-2035
  • Figure 80: Europe Market Y-o-Y Growth (%) Projections by Country, 2025-2035
  • Figure 81: Europe Market Value (USD Million) Analysis by Product Type, 2020-2035
  • Figure 82: Europe Market Volume (Units) Analysis by Product Type, 2020-2035
  • Figure 83: Europe Market Value Share (%) and BPS Analysis by Product Type, 2025-2035
  • Figure 84: Europe Market Y-o-Y Growth (%) Projections by Product Type, 2025-2035
  • Figure 85: Europe Market Value (USD Million) Analysis by Material Type, 2020-2035
  • Figure 86: Europe Market Volume (Units) Analysis by Material Type, 2020-2035
  • Figure 87: Europe Market Value Share (%) and BPS Analysis by Material Type, 2025-2035
  • Figure 88: Europe Market Y-o-Y Growth (%) Projections by Material Type, 2025-2035
  • Figure 89: Europe Market Value (USD Million) Analysis by End-Use Industry, 2020-2035
  • Figure 90: Europe Market Volume (Units) Analysis by End-Use Industry, 2020-2035
  • Figure 91: Europe Market Value Share (%) and BPS Analysis by End-Use Industry, 2025-2035
  • Figure 92: Europe Market Y-o-Y Growth (%) Projections by End-Use Industry, 2025-2035
  • Figure 93: Europe Market Attractiveness by Product Type, 2025-2035
  • Figure 94: Europe Market Attractiveness by Material Type, 2025-2035
  • Figure 95: Europe Market Attractiveness by End-Use Industry, 2025-2035
  • Figure 96: Europe Market Attractiveness by Country, 2025-2035
  • Figure 97: East Asia Market Value (USD Million) by Product Type, 2025-2035
  • Figure 98: East Asia Market Value (USD Million) by Material Type, 2025-2035
  • Figure 99: East Asia Market Value (USD Million) by End-Use Industry, 2025-2035
  • Figure 100: East Asia Market Value (USD Million) by Country, 2025-2035
  • Figure 101: East Asia Market Value (USD Million) Analysis by Country, 2020-2035
  • Figure 102: East Asia Market Volume (Units) Analysis by Country, 2020-2035
  • Figure 103: East Asia Market Value Share (%) and BPS Analysis by Country, 2025-2035
  • Figure 104: East Asia Market Y-o-Y Growth (%) Projections by Country, 2025-2035
  • Figure 105: East Asia Market Value (USD Million) Analysis by Product Type, 2020-2035
  • Figure 106: East Asia Market Volume (Units) Analysis by Product Type, 2020-2035
  • Figure 107: East Asia Market Value Share (%) and BPS Analysis by Product Type, 2025-2035
  • Figure 108: East Asia Market Y-o-Y Growth (%) Projections by Product Type, 2025-2035
  • Figure 109: East Asia Market Value (USD Million) Analysis by Material Type, 2020-2035
  • Figure 110: East Asia Market Volume (Units) Analysis by Material Type, 2020-2035
  • Figure 111: East Asia Market Value Share (%) and BPS Analysis by Material Type, 2025-2035
  • Figure 112: East Asia Market Y-o-Y Growth (%) Projections by Material Type, 2025-2035
  • Figure 113: East Asia Market Value (USD Million) Analysis by End-Use Industry, 2020-2035
  • Figure 114: East Asia Market Volume (Units) Analysis by End-Use Industry, 2020-2035
  • Figure 115: East Asia Market Value Share (%) and BPS Analysis by End-Use Industry, 2025-2035
  • Figure 116: East Asia Market Y-o-Y Growth (%) Projections by End-Use Industry, 2025-2035
  • Figure 117: East Asia Market Attractiveness by Product Type, 2025-2035
  • Figure 118: East Asia Market Attractiveness by Material Type, 2025-2035
  • Figure 119: East Asia Market Attractiveness by End-Use Industry, 2025-2035
  • Figure 120: East Asia Market Attractiveness by Country, 2025-2035
  • Figure 121: South Asia Market Value (USD Million) by Product Type, 2025-2035
  • Figure 122: South Asia Market Value (USD Million) by Material Type, 2025-2035
  • Figure 123: South Asia Market Value (USD Million) by End-Use Industry, 2025-2035
  • Figure 124: South Asia Market Value (USD Million) by Country, 2025-2035
  • Figure 125: South Asia Market Value (USD Million) Analysis by Country, 2020-2035
  • Figure 126: South Asia Market Volume (Units) Analysis by Country, 2020-2035
  • Figure 127: South Asia Market Value Share (%) and BPS Analysis by Country, 2025-2035
  • Figure 128: South Asia Market Y-o-Y Growth (%) Projections by Country, 2025-2035
  • Figure 129: South Asia Market Value (USD Million) Analysis by Product Type, 2020-2035
  • Figure 130: South Asia Market Volume (Units) Analysis by Product Type, 2020-2035
  • Figure 131: South Asia Market Value Share (%) and BPS Analysis by Product Type, 2025-2035
  • Figure 132: South Asia Market Y-o-Y Growth (%) Projections by Product Type, 2025-2035
  • Figure 133: South Asia Market Value (USD Million) Analysis by Material Type, 2020-2035
  • Figure 134: South Asia Market Volume (Units) Analysis by Material Type, 2020-2035
  • Figure 135: South Asia Market Value Share (%) and BPS Analysis by Material Type, 2025-2035
  • Figure 136: South Asia Market Y-o-Y Growth (%) Projections by Material Type, 2025-2035
  • Figure 137: South Asia Market Value (USD Million) Analysis by End-Use Industry, 2020-2035
  • Figure 138: South Asia Market Volume (Units) Analysis by End-Use Industry, 2020-2035
  • Figure 139: South Asia Market Value Share (%) and BPS Analysis by End-Use Industry, 2025-2035
  • Figure 140: South Asia Market Y-o-Y Growth (%) Projections by End-Use Industry, 2025-2035
  • Figure 141: South Asia Market Attractiveness by Product Type, 2025-2035
  • Figure 142: South Asia Market Attractiveness by Material Type, 2025-2035
  • Figure 143: South Asia Market Attractiveness by End-Use Industry, 2025-2035
  • Figure 144: South Asia Market Attractiveness by Country, 2025-2035
  • Figure 145: Oceania Market Value (USD Million) by Product Type, 2025-2035
  • Figure 146: Oceania Market Value (USD Million) by Material Type, 2025-2035
  • Figure 147: Oceania Market Value (USD Million) by End-Use Industry, 2025-2035
  • Figure 148: Oceania Market Value (USD Million) by Country, 2025-2035
  • Figure 149: Oceania Market Value (USD Million) Analysis by Country, 2020-2035
  • Figure 150: Oceania Market Volume (Units) Analysis by Country, 2020-2035
  • Figure 151: Oceania Market Value Share (%) and BPS Analysis by Country, 2025-2035
  • Figure 152: Oceania Market Y-o-Y Growth (%) Projections by Country, 2025-2035
  • Figure 153: Oceania Market Value (USD Million) Analysis by Product Type, 2020-2035
  • Figure 154: Oceania Market Volume (Units) Analysis by Product Type, 2020-2035
  • Figure 155: Oceania Market Value Share (%) and BPS Analysis by Product Type, 2025-2035
  • Figure 156: Oceania Market Y-o-Y Growth (%) Projections by Product Type, 2025-2035
  • Figure 157: Oceania Market Value (USD Million) Analysis by Material Type, 2020-2035
  • Figure 158: Oceania Market Volume (Units) Analysis by Material Type, 2020-2035
  • Figure 159: Oceania Market Value Share (%) and BPS Analysis by Material Type, 2025-2035
  • Figure 160: Oceania Market Y-o-Y Growth (%) Projections by Material Type, 2025-2035
  • Figure 161: Oceania Market Value (USD Million) Analysis by End-Use Industry, 2020-2035
  • Figure 162: Oceania Market Volume (Units) Analysis by End-Use Industry, 2020-2035
  • Figure 163: Oceania Market Value Share (%) and BPS Analysis by End-Use Industry, 2025-2035
  • Figure 164: Oceania Market Y-o-Y Growth (%) Projections by End-Use Industry, 2025-2035
  • Figure 165: Oceania Market Attractiveness by Product Type, 2025-2035
  • Figure 166: Oceania Market Attractiveness by Material Type, 2025-2035
  • Figure 167: Oceania Market Attractiveness by End-Use Industry, 2025-2035
  • Figure 168: Oceania Market Attractiveness by Country, 2025-2035
  • Figure 169: MEA Market Value (USD Million) by Product Type, 2025-2035
  • Figure 170: MEA Market Value (USD Million) by Material Type, 2025-2035
  • Figure 171: MEA Market Value (USD Million) by End-Use Industry, 2025-2035
  • Figure 172: MEA Market Value (USD Million) by Country, 2025-2035
  • Figure 173: MEA Market Value (USD Million) Analysis by Country, 2020-2035
  • Figure 174: MEA Market Volume (Units) Analysis by Country, 2020-2035
  • Figure 175: MEA Market Value Share (%) and BPS Analysis by Country, 2025-2035
  • Figure 176: MEA Market Y-o-Y Growth (%) Projections by Country, 2025-2035
  • Figure 177: MEA Market Value (USD Million) Analysis by Product Type, 2020-2035
  • Figure 178: MEA Market Volume (Units) Analysis by Product Type, 2020-2035
  • Figure 179: MEA Market Value Share (%) and BPS Analysis by Product Type, 2025-2035
  • Figure 180: MEA Market Y-o-Y Growth (%) Projections by Product Type, 2025-2035
  • Figure 181: MEA Market Value (USD Million) Analysis by Material Type, 2020-2035
  • Figure 182: MEA Market Volume (Units) Analysis by Material Type, 2020-2035
  • Figure 183: MEA Market Value Share (%) and BPS Analysis by Material Type, 2025-2035
  • Figure 184: MEA Market Y-o-Y Growth (%) Projections by Material Type, 2025-2035
  • Figure 185: MEA Market Value (USD Million) Analysis by End-Use Industry, 2020-2035
  • Figure 186: MEA Market Volume (Units) Analysis by End-Use Industry, 2020-2035
  • Figure 187: MEA Market Value Share (%) and BPS Analysis by End-Use Industry, 2025-2035
  • Figure 188: MEA Market Y-o-Y Growth (%) Projections by End-Use Industry, 2025-2035
  • Figure 189: MEA Market Attractiveness by Product Type, 2025-2035
  • Figure 190: MEA Market Attractiveness by Material Type, 2025-2035
  • Figure 191: MEA Market Attractiveness by End-Use Industry, 2025-2035
  • Figure 192: MEA Market Attractiveness by Country, 2025-2035

Frequently Asked Questions

What was the overall size of the hinged food containers market in 2025?

The overall market size for the hinged food containers market was USD 97.1 billion in 2025.

How big is the hinged food containers market expected to be in 2035?

The hinged food containers market is expected to reach USD 167.8 billion in 2035.

What will drive the demand for the hinged food containers market during the forecast period?

The demand for hinged food containers is expected to rise due to increasing demand for sustainable and convenient food packaging solutions.

List the top five countries contributing to the hinged food containers market.

The top five countries driving the development of the hinged food containers market are the USA, Germany, China, Japan, and the UK.

Which segment in type is expected to lead in the hinged food containers market?

Microwave and freezer-safe containers are expected to command a significant share over the assessment period.

Explore Similar Insights

Future Market Insights

Hinged Food Containers Market