

- Market Size (2026)
- 760.7 Mn
- Forecast (2036)
- USD 1784.4 Mn
- CAGR (2026 to 2036)
- 8.9%
How big is the Inflatable Flood Barriers Market in 2026?
USD 760.7 million in 2026 and USD 1,784.4 million by 2036 at a 8.9% CAGR.
Sales in inflatable flood barriers market are projected to grow at 8.9% CAGR through 2036, driving valuation to USD 1,784.4 million by 2036 from USD 760.7 million in 2026. Flood exposure is forcing municipalities to replace sandbag routines with deployable systems that protect openings before water reaches assets. NOAA NCEI reported that the United States sustained 403 billion-dollar weather and climate disasters during 1980 to 2024.
India and China are expected to emphasize city drainage gaps, public works storage and rapid emergency deployment as urban flood exposure increases. United States accounts are projected to focus on tender documentation, test records and insurance-linked mitigation logic. Municipal buyers are likely to prefer suppliers that prove stored barriers can deploy quickly and return to service after cleaning.
Municipal agencies and public works departments are expected to purchase inflatable barriers to protect road crossings and public buildings before crews arrive. Emergency managers evaluate tube geometry and anchoring steps due to the labor burden of temporary flood response. Industrial facility managers also compare reusable barrier kits against shutdown exposure and insurance requirements. Procurement teams that track crisis management spending need evidence that stored barriers deploy quickly and return to service after cleaning.
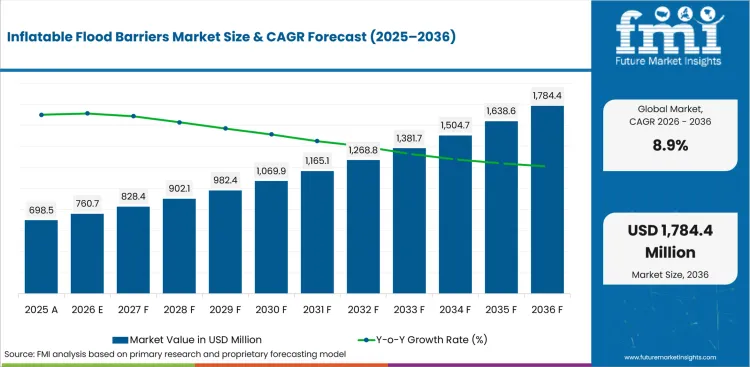
Summary of the Inflatable Flood Barriers Market
| Market Signal | Commercial Impact |
|---|---|
| Demand and Growth Drivers | Flood-response readiness is expected to move spending toward reusable temporary barriers. Documentation needs are projected to keep municipal tender teams focused on deployment proof.
|
| Product and Segment View | Direct OEM routes, temporary emergency deployment and municipal agencies are expected to anchor 2026 demand. Water-filled barriers and urban flood defense are forecast to shape specification checks.
|
| Geography and Growth Outlook | India and China are expected to form the higher-expansion tier under urban flood mitigation programs. The United States, Europe and Japan are projected to grow under documentation-led replacement cycles.
|
| Competitive Landscape | Competition is moderately concentrated around flood-barrier specialists and civil-protection suppliers. Procurement evaluation is expected to center on deployment speed and referenceable public-asset installations.
|
| Analyst Perspective | Inflatable flood barriers are emergency assets that must prove readiness before water reaches the site. Procurement teams need confidence in storage, deployment, anchoring and cleaning routines after the first event.
|
How is the Inflatable Flood Barriers Market segmented?
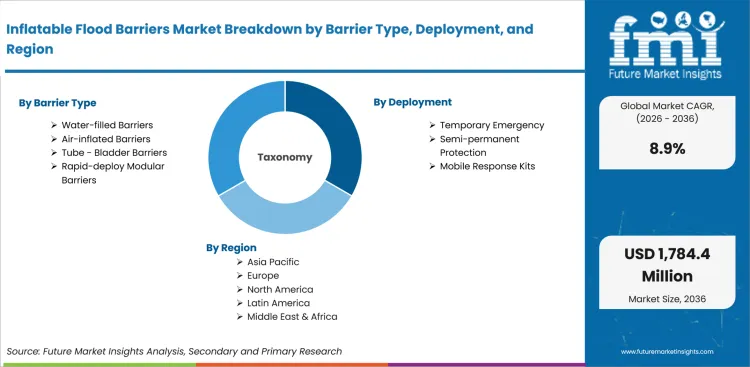
The inflatable flood barriers industry is segmented by barrier type, deployment, application, end use, sales channel and region.
The inflatable flood barriers market is segmented by barrier type, deployment, application, end use, sales channel and region. By barrier type, the market covers water-filled barriers, air-inflated barriers, tube and bladder barriers, and rapid-deploy modular barriers. By deployment, it covers temporary emergency, semi-permanent protection, and mobile response kits. By application, it covers urban flood defense, industrial site protection, coastal and river defense, and building entry protection. By end use, it covers municipal agencies, industrial facilities, commercial buildings, and emergency services. By sales channel, it covers direct OEM, emergency equipment distributors, and government procurement. Regional coverage includes North America, Latin America, Europe, East Asia, South Asia and Pacific, and Middle East and Africa.
How does direct OEM shape purchasing within the sales channel category?
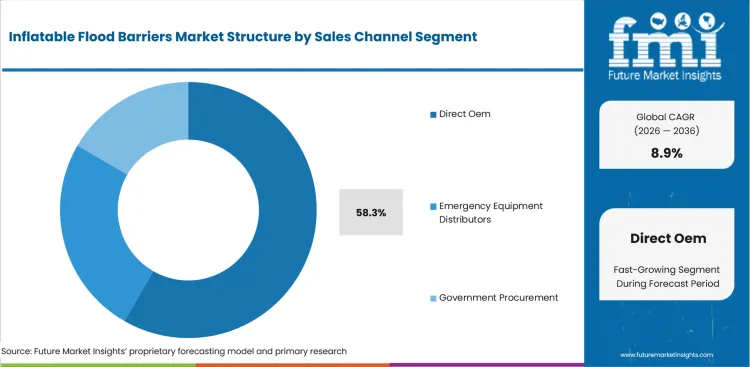
Direct OEM purchasing is shaped by municipal tender teams that need one accountable source for tube design and field training. FEMA updated its Flood Mitigation Assistance Grant Program page in May 2026 for fiscal year 2024 support. The funding context increases scrutiny of supplier documents before public agencies approve repeat barrier purchases.
- By sales channel, direct OEM is projected to account for 58.3% share in 2026 driven by warranty clarity and direct handover control. The FEMA funding notice in May 2026 placed up to USD 600.0 million in flood mitigation support, which raises the value of tender-ready deployment files.
- Direct OEM purchasing is witnessing demand from public works departments owing to cleaner responsibility for anchoring and repair. Teams comparing dewatering pump demand also prefer one contact point for flood-response equipment that must be stored and reused after storms.
What supports temporary emergency deployment within the deployment category?
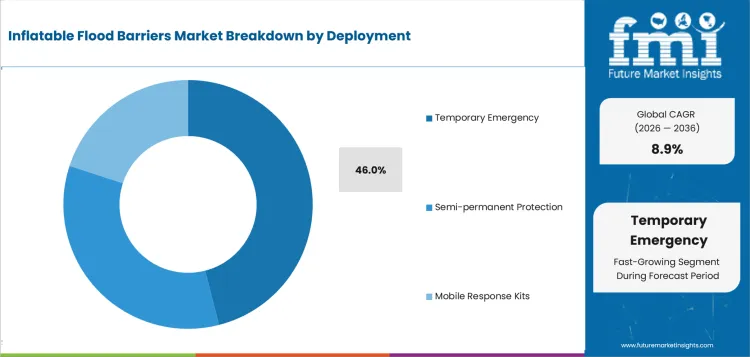
Temporary emergency deployment depends on products that crews stage before water reaches roads or building entrances. UNDRR described floods in its May 2025 hazard exploration as a recurring weather-related disaster risk. The frequency of flood events keeps temporary barriers inside response inventories where storage and redeployment speed affect purchase decisions.
- By deployment, temporary emergency is estimated to hold 46.0% share in 2026 owing to seasonal stockpiling and fast setup needs. UNDRR reported in May 2025 that floods account for 35-40% of weather-related disaster occurrences, which supports stored kits for exposed districts.
- Demand for temporary emergency barriers is expected to grow among emergency services attributable to short warning times and labor limits. Municipal teams coordinating storm water cleaning services need portable systems that reduce sandbag handling before crews clear blocked drainage routes.
How do municipal agencies evaluate end-use demand?
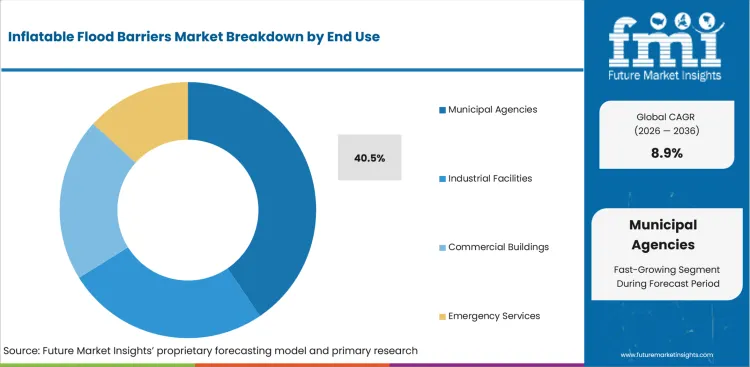
Municipal agencies evaluate inflatable barriers against public-road access duties and public-asset protection before annual response budgets close. India Press Information Bureau described urban flood-risk management approvals in October 2025 for seven metro cities. The funding context puts supplier training and modular barrier handling inside municipal evaluation before wider purchases.
- Municipal agencies are forecast to capture 40.5% of end-use demand in 2026 attributable to public-asset protection duties. India Press Information Bureau reported INR 3075.65 crore in urban flood-risk outlay during October 2025. The outlay supports city procurement for modular protection that protects road entries and drainage-adjacent public assets.
- Municipal agencies are increasingly purchasing inflatable barriers led by drainage stress and road-closure costs. City engineering teams using smart water grid planning prefer products that connect flood mapping to practical crew staging before monsoon or storm events.
What drives water-filled barriers within the barrier type category?
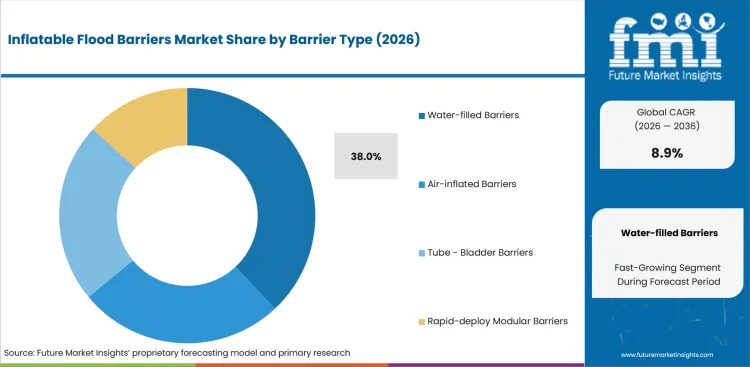
Water-filled barrier selection reflects municipal need for ballast strength without heavy permanent foundations at temporary flood lines. FloodBreak described in 2024 a Des Moines wastewater project using a barrier across a pump headworks opening. The project example keeps reusable barrier handling tied to site-specific water pressure and clear closure behavior.
- The barrier type category is forecast to be led by water-filled barriers at 38.0% share in 2026 due to ballast behavior and reusable tube handling. FloodBreak described a 105-foot gate in 2024, which keeps full-width protection proof central to specification review.
- Water-filled barriers are drawing attention from industrial facility managers shaped by temporary perimeter needs and lower civil-work disruption. Facilities prefer tube systems that match gate openings and utility yards without forcing permanent construction at every exposed location.
How does urban flood defense influence application demand?
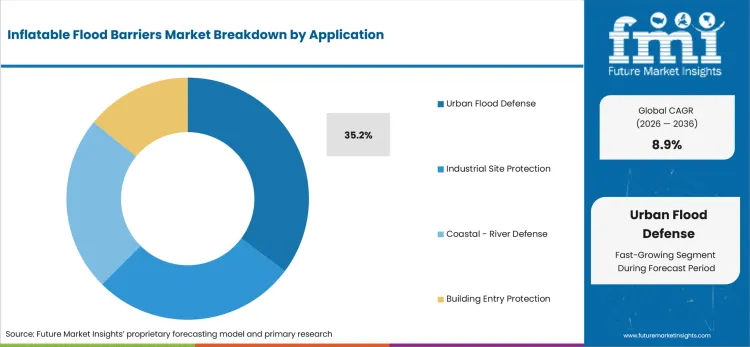
Urban flood defense purchases are shaped by blocked drains and fast street-level flooding around underpasses. South Korea Ministry of Environment reported in July 2025 that stormwater inlets in management zones had been inspected before flood season. The figure connects drainage maintenance with demand for surface barriers that crews place before runoff peaks.
- Urban flood defense is likely to capture 35.2% application share in 2026 attributable to underpass exposure and public-building protection. South Korea Ministry of Environment reported 95.1% stormwater inlet inspection progress in July 2025, which reinforces city flood-response readiness.
- Sales of urban flood defense barriers are forecast to gain traction in dense city corridors reinforced by shorter deployment windows. City crews need lightweight tubes and clear fill instructions before road closures or building entrances become active flood points.
What are the drivers, restraints, and opportunities in the Inflatable Flood Barriers Market?
Near-term purchases are being shaped by flood-response readiness, municipal budget timing, and resilience-funding access outlined below.
- Driver: Public works departments are expected to purchase reusable barriers for flood-prone roads and public facilities before emergency labor becomes constrained.
- Restraint: Municipal adoption is anticipated to slow where tender teams lack training proof and clear responsibility for stored barrier maintenance.
- Opportunity: Resilience funding is projected to open supplier access where barriers link flood maps to deployable public works equipment.
Public works teams are expected to increase interest in reusable barriers that reduce sandbag labor and speed road protection. The UK Environment Agency reported in September 2025 that a GBP 2.65 billion investment had been announced for flood defences in England. The funding environment supports procurement of documented products that reduce site preparation and seasonal labor exposure.
Budget holders are likely to delay adoption if barrier responsibility is unclear after the first flood event. FEMA announced in March 2025 that federally funded projects were no longer subject to one floodplain standard from March 25, 2025. Changing standards keep tender teams focused on documentation and performance claims before approving products for public sites.
Resilience funding is expected to favor suppliers that connect flood exposure files to stored response kits and training records. Geodesign reported in November 2024 that ASML used FM Approved barriers to address riverine flood exposure at its San Jose campus. The same qualification mindset supports digital elevation models and local flood planning before field crews receive equipment.
Which country CAGRs are profiled in the Inflatable Flood Barriers Market?
.webp "Top Country Growth Comparison Inflatable Flood Barriers Market Cagr (2026 2036)")
| Country | CAGR |
|---|---|
| United States | 7.95% |
| China | 10.15% |
| India | 11.15% |
| Germany | 7.55% |
| United Kingdom | 7.75% |
| Japan | 7.35% |
| South Korea | 8.75% |
Source: FMI's proprietary forecasting model and primary research
How do country-level CAGRs compare in the Inflatable Flood Barriers Market?
Country growth is expected to differ by flood-risk funding and public sourcing discipline across the profiled markets. India is projected at 11.15% CAGR and China is forecast at 10.15% CAGR due to larger urban mitigation programs. Rest of World is estimated at 9.15% CAGR under wider adaptation spending and uneven monitoring capacity. South Korea is predicted at 8.75% CAGR owing to monitored river upgrades and city drainage controls. The United States is anticipated at 7.95% CAGR and the United Kingdom is projected at 7.75% CAGR under documented flood-defence spending. Germany is expected at 7.55% CAGR and Japan is forecast at 7.35% CAGR due to approval reviews linked to underground rainwater collection.
- Inflatable flood barrier demand in the United States is anticipated to advance at 7.95% CAGR over the assessment period, driven by coastal storm exposure and local hazard mitigation grants. NOAA Office for Coastal Management reported in June 2026 that tropical cyclones caused over USD 1.5 trillion in USA damage from 1980 to 2024. The loss profile increases attention on deployable barriers for utilities, campuses and public access points. County emergency managers still require proof that stored systems work after several storm seasons and inspection cycles. AquaFence and FloodBreak are positioned to gain traction where engineered documentation and public-sector references shape awards.
- China is estimated to post 10.15% CAGR over the forecast period, supported by water conservancy investment and city drainage upgrades. The State Council reported in September 2025 that water conservancy facility investment would exceed 5.4 trillion yuan during 2021-2025. The capital base supports procurement of temporary flood equipment near rivers, transport hubs and industrial parks. Provincial tenders still emphasize local service access and delivery scale before agencies approve stockpile contracts. Suppliers with tested tube formats are expected to receive stronger consideration in accounts that require rapid city-level stockpiling.
- India’s inflatable flood barriers outlook is projected to record 11.15% CAGR during the assessment period, attributable to urban flood programs and state-led mitigation spending. India Press Information Bureau reported in February 2026 that total flood affected areas were assessed at 21.213 Mha. The exposure keeps portable protection relevant for metro drainage corridors and public-building entrances during monsoon planning. State disaster authorities must balance low price with training support before monsoon procurement schedules close. Municipal agencies are expected to concentrate purchases among suppliers that demonstrate field setup before seasonal tenders close.
- Germany’s inflatable flood barriers sector is forecast to rise at 7.55% CAGR over the forecast period, shaped by civil-protection mapping and response documentation. Germany’s Federal Office of Civil Protection reported in 2025 that Copernicus Emergency Management Service had 11 activations in Germany during 2024. The mapping activity supports barriers used for temporary municipal protection and infrastructure response during river emergencies. Local agencies still expect documented compatibility with drills and emergency stockrooms before recurring framework awards. Format-specific barrier programs are expected to draw attention from civil-protection teams in flood-prone river districts.
- United Kingdom sales are predicted to expand at 7.75% CAGR by 2036, reinforced by public flood-defence targets and response equipment planning. GOV.UK reported in April 2026 that flood defences had better protected 61,898 properties during 2024/25 and 2025/26. The result keeps councils focused on movable systems that supplement capital works during high-water periods. Local authorities also test supplier service response under framework purchasing rules before widening stocked equipment lists. Flood Control International and Geodesign Barriers are positioned to gain traction where council tenders value UK references and certified demountable systems.
- Japan barrier demand is projected to advance at 7.35% CAGR through 2036 due to heavy-rain planning and site-level disaster drills. Japan Meteorological Agency reported in 2025 that total precipitation in western Japan had risen by approximately 6.7% over the past 40 years. The rainfall trend supports portable barriers for low-lying public facilities and transport access points during heavy-rain alerts. Local governments still require compact storage and simple maintenance due to limited urban space. Suppliers with lighter tube systems are expected to receive stronger consideration in accounts that require rapid installation by small crews.
- South Korea’s inflatable flood barrier demand is forecast to expand at 8.75% CAGR by 2036, led by national-river upgrades and monitored urban drainage programs. South Korea Ministry of Environment reported in January 2025 that 20 rivers had been upgraded to national-river status. The upgrade opens procurement routes for levee support, drainage facilities and temporary protection along vulnerable corridors. City teams still evaluate compatibility with CCTV-led risk monitoring and emergency alerts before stockpiling seasonal barriers. Emergency equipment distributors are expected to draw attention from local governments seeking stocked barrier kits before flood season.
Who are the notable companies in the Inflatable Flood Barriers Market?
AquaFence, FloodBreak, NoFloods, IBS Technics, FlexBarrier, Tiger Dam, Rapidam, Flood Control International, HESCO and Geodesign Barriers are the notable companiesshaping this market.
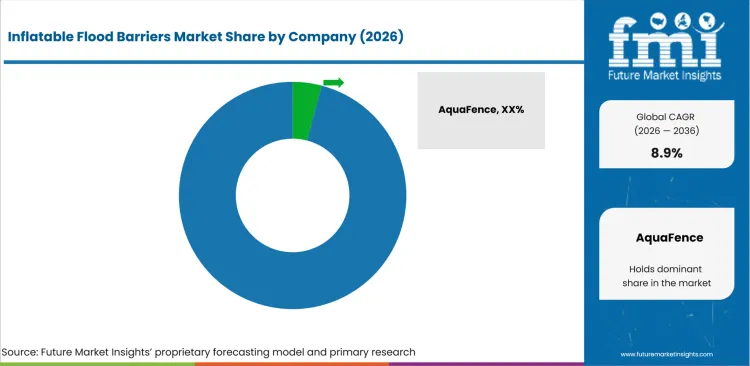
The competitive base is moderately concentrated around specialist flood-protection manufacturers and civil-protection suppliers serving public and industrial accounts. Established firms hold account access through tested product families and public-sector references that reduce tender uncertainty. Smaller regional suppliers compete through fast delivery and narrow application expertise for building entries or temporary walls. Competition centers on deployment proof, storage footprint and service response before municipalities approve repeat orders. Public works departments comparing geosynthetic protection systems also look for maintenance records before adding barriers to flood-response inventories.
- Specification-heavy projects favor AquaFence, FloodBreak and IBS Technics due to engineered site files and documented barrier behavior. Municipal engineers use these records to reduce approval time on entrances, utility assets and transport-adjacent flood paths. The practical gain is lower review friction before project teams approve repeat purchases across several protected sites.
- Portable response programs place NoFloods, Tiger Dam and Rapidam in a different competitive role. Emergency teams evaluate fill steps, storage volume and crew training before choosing water-filled or air-supported systems. The group serves agencies that need equipment staged before storms without permanent civil works.
- Installed protection and civic-asset programs keep Flood Control International and Geodesign Barriers visible in councils and commercial campuses. Their competitive basis is demountable barrier experience and certification-led documents for property-level risk programs. Procurement teams use that proof to align temporary flood protection with property-level risk plans.
- Emergency stockpile accounts give HESCO and flexible-barrier suppliers access to disaster-response budgets during public works planning. These suppliers fit situations that require transportable perimeter protection and simple field instructions under pressure. Companies that combine clear deployment manuals with local service partners are expected to hold account access after first use.
Competitive Benchmarking: Inflatable Flood Barriers Market
| Company | Deployment proof | Municipal access | Temporary response fit | Service reach |
|---|---|---|---|---|
| AquaFence | High | Strong | Medium | Global |
| FloodBreak | High | Strong | Medium | Global |
| NoFloods | Strong | Medium | High | Global |
| IBS Technics | High | Medium | Medium | Regional |
| FlexBarrier | Medium | Regional | Strong | Regional |
| Tiger Dam | Strong | Medium | High | Global |
| Rapidam | Strong | Medium | High | Regional |
| Flood Control International | High | Strong | Medium | Global |
| HESCO | Medium | Strong | High | Global |
| Geodesign Barriers | High | Strong | Medium | Global |
Source: Future Market Insights competitive analysis, 2026. Ratings reflect relative portfolio relevance and workflow fit. Service capability and geographic reach shape the remaining comparison.
Key Developments in the Inflatable Flood Barriers Market
- In December 2025, FloodBreak published notable installation updates highlighting the deployment of passive flood barriers across infrastructure sites in the United States. The update focused on automatic flood protection systems designed to safeguard critical facilities without requiring manual closure during flood events.
- In November 2024, NoFloods reported that its flood barriers protected the Bryggen UNESCO waterfront district in Bergen during severe weather conditions. The project involved the deployment of temporary flood protection measures for a historic waterfront area vulnerable to inundation.
- In November 2024, Geodesign Barriers reported that ASML implemented FM Approved flood barriers at its San Jose research and development campus. The installation was designed to address potential 500-year flood risks and incorporated monitoring data from nearby river-gauge systems.
Key Players in the Inflatable Flood Barriers Market
Engineered flood-barrier specialists
- AquaFence
- FloodBreak
- IBS Technics
Portable emergency barrier suppliers
- NoFloods
- FlexBarrier
- Tiger Dam
- Rapidam
Civil protection and demountable barrier suppliers
- Flood Control International
- HESCO
- Geodesign Barriers
Inflatable Flood Barriers Market - Report Scope
| Coverage field | Report scope |
|---|---|
| Market breakdown | Inflatable Flood Barriers Market Breakdown By Barrier Type, Deployment, Application, End Use, Sales Channel, and Region |
| Market Definition | Inflatable flood barriers are reusable water-filled or air-supported temporary flood-protection systems used by municipal agencies, emergency teams and facility managers to block floodwater at vulnerable assets. |
| Regions Covered | North America, Latin America, Europe, East Asia, South Asia and Pacific, and Middle East and Africa |
| Countries Covered | United States, China, India, Germany, United Kingdom, Japan, South Korea and 30+ countries |
| Key Companies Profiled | AquaFence, FloodBreak, NoFloods, IBS Technics, FlexBarrier, Tiger Dam, Rapidam, Flood Control International, HESCO and Geodesign Barriers |
| Forecast Period | 2026 to 2036 |
| Approach | Hybrid bottom-up and top-down methodology using deployment mode, municipal procurement, country flood-risk funding and supplier service reach |
Source: Future Market Insights - analysis driven by proprietary forecasting models and primary research
Inflatable Flood Barriers Market - Research Methodology
| Method | Approach |
| Primary Research | FMI analysts gathered input from manufacturers, service providers, technology developers, distributors, end users, procurement teams, and subject-matter experts. Interviews examined purchasing decisions, product or service evaluation, adoption barriers, approval requirements, pricing considerations, and expectations for technical or commercial support. Respondents were also asked what evidence is required before a trial, pilot, or initial order develops into regular purchasing. |
| Desk Research | Desk research covered government statistics, regulatory publications, trade data, industry associations, technical literature, standards, company filings, product information, and official corporate announcements. Sources were reviewed for relevance, publication date, geographic coverage, and consistency with the defined market scope. Claims relating to performance, applications, approvals, capacity, investment, and commercial activity were retained only when supported by credible public evidence. |
| Market Sizing and Forecasting | The market model combined the baseline value with historical performance, segment structure, pricing and volume indicators, adoption levels, company participation, and country-level demand conditions. Forecast assumptions considered economic activity, investment trends, regulatory developments, technology adoption, purchasing cycles, supply availability, and barriers to wider market use. Segment and regional estimates were reconciled before the final market total was calculated. |
| Data Validation | Estimates were checked against multiple independent indicators, including public data, company activity, trade patterns, industry developments, and findings from primary interviews. Validation also tested whether products, services, applications, and company revenues fell within the defined market boundaries. Adjacent categories, unsupported claims, overlapping revenues, and activities without direct market relevance were excluded to reduce double counting and maintain consistency across segments and countries. |
Inflatable Flood Barriers Market by Segments
Inflatable Flood Barriers Market segmented by Barrier Type:
- Water-filled Barriers
- Air-inflated Barriers
- Tube / Bladder Barriers
- Rapid-deploy Modular Barriers
Inflatable Flood Barriers Market segmented by Deployment:
- Temporary Emergency
- Semi-permanent Protection
- Mobile Response Kits
Inflatable Flood Barriers Market segmented by Application:
- Urban Flood Defense
- Industrial Site Protection
- Coastal / River Defense
- Building Entry Protection
Inflatable Flood Barriers Market segmented by End Use:
- Municipal Agencies
- Industrial Facilities
- Commercial Buildings
- Emergency Services
Inflatable Flood Barriers Market segmented by Sales Channel:
- Direct OEM
- Emergency Equipment Distributors
- Government Procurement
Inflatable Flood Barriers Market by Region:
- North America
- United States
- Canada
- Latin America
- Brazil
- Mexico
- Argentina
- Europe
- Germany
- United Kingdom
- France
- Italy
- Spain
- East Asia
- China
- Japan
- South Korea
- South Asia and Pacific
- India
- Australia
- ASEAN countries
- Middle East and Africa
- GCC countries
- South Africa
- Rest of Middle East and Africa
Research Sources and Bibliography
- National Oceanic and Atmospheric Administration. (2025). Billion-Dollar Weather and Climate Disasters. NOAA National Centers for Environmental Information.
- Federal Emergency Management Agency. (2026, May). Flood Mitigation Assistance Grant Program. FEMA.
- Environment Agency. (2025, September). Flood and coastal erosion risk management report: 1 April 2024 to 31 March 2025. GOV.UK.
- GOV.UK. (2026, April). Better flood protection target exceeded. GOV.UK.
- Press Information Bureau. (2026, February). Projects under Flood Management and Border Areas Programme. Ministry of Jal Shakti.
- Press Information Bureau. (2025, October). It will benefit Assam, Kerala, Madhya Pradesh, Odisha, Tamil Nadu and West Bengal. Ministry of Home Affairs.
- State Council of the People’s Republic of China. (2025, September). China’s water conservancy investment to exceed 5.4 trln yuan during 2021-2025 period. State Council.
- World Meteorological Organization. (2025, September). From drought to deluge: WMO report highlights increasingly erratic water cycle. WMO.
- United Nations Office for Disaster Risk Reduction. (2025, May). GAR 2025 Hazard explorations: Floods. UNDRR.
- Japan Meteorological Agency. (2025). Climate Change in Japan 2025. JMA.
- Federal Office of Civil Protection and Disaster Assistance. (2025). Bevölkerungsschutz 2 | 2025. BBK.
- Ministry of Environment. (2025, January). Press Release. Republic of Korea Ministry of Environment.
- Ministry of Environment. (2025, July). Press Release. Republic of Korea Ministry of Environment.
- FloodBreak. (2025, December). Notable 2025 Installations Strengthening Flood Resilience. FloodBreak.
- FloodBreak. (2024). Des Moines Metropolitan Wastewater Reclamation Authority. FloodBreak.
- NoFloods. (2024, November). Flood Barriers Safeguard Bryggen UNESCO Site from Flooding. NoFloods.
- NoFloods. (2025, March). NoFloods: The Ultimate Road Flood Protection Barrier. NoFloods.
- Geodesign Barriers. (2024, November). ASML Fortifies Silicon Valley Campus Against 500-Year Floods with FM Approved Barriers. Geodesign Barriers.
- Flood Control International. (2024, December). 30 Years of Flood Control. Flood Control International.
- HESCO. (2025). Case Studies. HESCO.
This bibliography is provided for reader reference and uses primary government sources alongside standards-body and company sources.
This Report Answers
- What value is forecast for the inflatable flood barriers market in 2026 and by 2036?
- What CAGR is forecast for the inflatable flood barriers market from 2026 to 2036?
- Which barrier type and deployment segments shape demand across application and end-use categories?
- Which flood-response pressures support adoption among municipalities and facility managers?
- How do country CAGRs differ across the profiled markets?
- Which companies compete across deployment proof, municipal access and service reach?
- How does FMI validate forecasts using hybrid bottom-up and top-down methodology?
- What should public works and facility teams address before broader account expansion?
- How do documentation review and flood-risk rules affect vendor selection?
Frequently Asked Questions
What is driving growth in the Inflatable Flood Barriers Market?
Growth is being driven by flood-response readiness and demand for reusable temporary barriers. Municipal agencies and public works teams need faster alternatives to sandbag routines.
Who are the key players in the Inflatable Flood Barriers Market?
Key players include AquaFence, FloodBreak, NoFloods, IBS Technics, FlexBarrier, Tiger Dam, Rapidam, Flood Control International, HESCO and Geodesign Barriers. Competition centers on deployment proof and municipal access.
What is a significant restraint in the Inflatable Flood Barriers Market?
A significant restraint is unclear responsibility for training, storage and maintenance. Tender teams may delay adoption when deployment proof and post-event support are weak.
Why should executives track the Inflatable Flood Barriers Market?
Executives should track this market due to its link with public-asset protection and business continuity. The category affects flood-response planning before water reaches roads, building entrances and utility spaces.
What business problem does the Inflatable Flood Barriers Market address?
The market addresses floodwater entry at public and industrial assets before permanent construction is funded. Inflatable systems give crews a stored response option that replaces labor-heavy sandbag work during storm escalation.
What should procurement leaders evaluate before selecting suppliers?
Procurement leaders should evaluate deployment proof and anchoring guidance before reviewing training support and service response. They should also review whether the supplier has reference sites in municipal or industrial flood protection.
What limits return on investment for buyers?
Return on investment is expected to weaken if barriers require too much labor during setup. Poor storage discipline and unclear maintenance ownership also reduce the value of reusable systems.
How do suppliers build long-term account confidence?
Suppliers build confidence by providing clear fill instructions, repair guidance and post-flood inspection support. Account teams should document field deployments so repeat orders rely on proof instead of claims.
Preview the report firsthand - request a free sample
Get SampleGet the brochure for pricing and purchase details.
Get PDFTable of Content
- Key Takeaways
- Market Size and CAGR
- Top Growth Driver
- Fastest Growing Segment
- Leading Region
- Key Companies
- Emerging Opportunities
- Executive Summary
- Global Market Outlook
- Demand-side Trends
- Supply-side Trends
- Technology Roadmap Analysis
- Analysis and Recommendations
- Analyst Perspective (What is happening? Why now? What should investors know?)
- Key Questions Answered
- How large is the market?
- What is the CAGR?
- What are key trends?
- Which region dominates?
- Who are the leaders?
- Market Overview
- Market Coverage / Taxonomy
- Market Definition / Scope / Limitations
- Research Methodology
- Chapter Orientation
- Analytical Lens and Working Hypotheses
- Market Structure, Signals, and Trend Drivers
- Benchmarking and Cross-market Comparability
- Market Sizing, Forecasting, and Opportunity Mapping
- Research Design and Evidence Framework
- Desk Research Programme (Secondary Evidence)
- Expert Input and Fieldwork (Primary Evidence)
- Tooling, Models, and Reference Databases
- Data Engineering and Model Build
- Quality Assurance and Audit Trail
- Market Background
- Market Dynamics (Drivers, Restraints, Opportunity, Trends)
- Scenario Forecast (Optimistic, Likely, Conservative)
- Impact Analysis
- AI Impact
- Sustainability Impact
- Regulatory Impact
- Technology Impact
- Consumer / Buyer Analysis
- Purchase Drivers
- Adoption Barriers
- Buyer Journey
- Opportunity Map Analysis
- Product Life Cycle Analysis
- Supply Chain Analysis
- Investment Feasibility Matrix
- Value Chain Analysis
- PESTLE and Porter's Analysis
- Regulatory Landscape
- Regional Parent Market Outlook
- Production and Consumption Statistics
- Import and Export Statistics
- Global Market Analysis and Forecast, 2021 to 2036
- Historical Market Size Value (USD Million) & Volume (Unit) Analysis, 2021 to 2025
- Current and Future Market Size Value (USD Million) & Volume (Unit) Projections, 2026 to 2036
- Y-o-Y Growth Trend Analysis
- Absolute $ Opportunity Analysis
- Global Market Pricing Analysis, 2021 to 2036
- Global Market Analysis and Forecast, By Barrier Type, 2021 to 2036
- Introduction / Key Findings
- Historical Market Size Value (USD Million) & Volume (Unit) Analysis By Barrier Type, 2021 to 2025
- Current and Future Market Size Value (USD Million) & Volume (Unit) Analysis and Forecast By Barrier Type, 2026 to 2036
- Water-filled Barriers
- Air-inflated Barriers
- Tube - Bladder Barriers
- Rapid-deploy Modular Barriers
- Water-filled Barriers
- Y-o-Y Growth Trend Analysis By Barrier Type, 2021 to 2025
- Absolute $ Opportunity Analysis By Barrier Type, 2026 to 2036
- Global Market Analysis and Forecast, By Deployment, 2021 to 2036
- Introduction / Key Findings
- Historical Market Size Value (USD Million) & Volume (Unit) Analysis By Deployment, 2021 to 2025
- Current and Future Market Size Value (USD Million) & Volume (Unit) Analysis and Forecast By Deployment, 2026 to 2036
- Temporary Emergency
- Semi-permanent Protection
- Mobile Response Kits
- Temporary Emergency
- Y-o-Y Growth Trend Analysis By Deployment, 2021 to 2025
- Absolute $ Opportunity Analysis By Deployment, 2026 to 2036
- Global Market Analysis and Forecast, By Application, 2021 to 2036
- Introduction / Key Findings
- Historical Market Size Value (USD Million) & Volume (Unit) Analysis By Application, 2021 to 2025
- Current and Future Market Size Value (USD Million) & Volume (Unit) Analysis and Forecast By Application, 2026 to 2036
- Urban Flood Defense
- Industrial Site Protection
- Coastal - River Defense
- Building Entry Protection
- Urban Flood Defense
- Y-o-Y Growth Trend Analysis By Application, 2021 to 2025
- Absolute $ Opportunity Analysis By Application, 2026 to 2036
- Global Market Analysis and Forecast, By End Use, 2021 to 2036
- Introduction / Key Findings
- Historical Market Size Value (USD Million) & Volume (Unit) Analysis By End Use, 2021 to 2025
- Current and Future Market Size Value (USD Million) & Volume (Unit) Analysis and Forecast By End Use, 2026 to 2036
- Municipal Agencies
- Industrial Facilities
- Commercial Buildings
- Emergency Services
- Municipal Agencies
- Y-o-Y Growth Trend Analysis By End Use, 2021 to 2025
- Absolute $ Opportunity Analysis By End Use, 2026 to 2036
- Global Market Analysis and Forecast, By Sales Channel, 2021 to 2036
- Introduction / Key Findings
- Historical Market Size Value (USD Million) & Volume (Unit) Analysis By Sales Channel, 2021 to 2025
- Current and Future Market Size Value (USD Million) & Volume (Unit) Analysis and Forecast By Sales Channel, 2026 to 2036
- Direct Oem
- Emergency Equipment Distributors
- Government Procurement
- Direct Oem
- Y-o-Y Growth Trend Analysis By Sales Channel, 2021 to 2025
- Absolute $ Opportunity Analysis By Sales Channel, 2026 to 2036
- Global Market Analysis and Forecast, By Region, 2021 to 2036
- Introduction
- Historical Market Size Value (USD Million) & Volume (Unit) Analysis By Region, 2021 to 2025
- Current Market Size Value (USD Million) & Volume (Unit) Analysis and Forecast By Region, 2026 to 2036
- North America
- Latin America
- Western Europe
- Eastern Europe
- East Asia
- South Asia and Pacific
- Middle East & Africa
- Market Attractiveness Analysis By Region
- North America Market Analysis and Forecast, By Country, 2021 to 2036
- Historical Market Size Value (USD Million) & Volume (Unit) Trend Analysis By Market Taxonomy, 2021 to 2025
- Market Size Value (USD Million) & Volume (Unit) Forecast By Market Taxonomy, 2026 to 2036
- By Country
- USA
- Canada
- Mexico
- By Barrier Type
- By Deployment
- By Application
- By End Use
- By Sales Channel
- By Country
- Market Attractiveness Analysis
- By Country
- By Barrier Type
- By Deployment
- By Application
- By End Use
- By Sales Channel
- Key Takeaways
- Latin America Market Analysis and Forecast, By Country
- Historical Market Size Value (USD Million) & Volume (Unit) Trend Analysis By Market Taxonomy, 2021 to 2025
- Market Size Value (USD Million) & Volume (Unit) Forecast By Market Taxonomy, 2026 to 2036
- By Country
- Brazil
- Chile
- Rest of Latin America
- By Barrier Type
- By Deployment
- By Application
- By End Use
- By Sales Channel
- By Country
- Market Attractiveness Analysis
- By Country
- By Barrier Type
- By Deployment
- By Application
- By End Use
- By Sales Channel
- Key Takeaways
- Western Europe Market Analysis and Forecast, By Country
- Historical Market Size Value (USD Million) & Volume (Unit) Trend Analysis By Market Taxonomy, 2021 to 2025
- Market Size Value (USD Million) & Volume (Unit) Forecast By Market Taxonomy, 2026 to 2036
- By Country
- Germany
- UK
- Italy
- Spain
- France
- Nordic
- BENELUX
- Rest of Western Europe
- By Barrier Type
- By Deployment
- By Application
- By End Use
- By Sales Channel
- By Country
- Market Attractiveness Analysis
- By Country
- By Barrier Type
- By Deployment
- By Application
- By End Use
- By Sales Channel
- Key Takeaways
- Eastern Europe Market Analysis and Forecast, By Country
- Historical Market Size Value (USD Million) & Volume (Unit) Trend Analysis By Market Taxonomy, 2021 to 2025
- Market Size Value (USD Million) & Volume (Unit) Forecast By Market Taxonomy, 2026 to 2036
- By Country
- Russia
- Poland
- Hungary
- Balkan & Baltic
- Rest of Eastern Europe
- By Barrier Type
- By Deployment
- By Application
- By End Use
- By Sales Channel
- By Country
- Market Attractiveness Analysis
- By Country
- By Barrier Type
- By Deployment
- By Application
- By End Use
- By Sales Channel
- Key Takeaways
- East Asia Market Analysis and Forecast, By Country
- Historical Market Size Value (USD Million) & Volume (Unit) Trend Analysis By Market Taxonomy, 2021 to 2025
- Market Size Value (USD Million) & Volume (Unit) Forecast By Market Taxonomy, 2026 to 2036
- By Country
- China
- Japan
- South Korea
- By Barrier Type
- By Deployment
- By Application
- By End Use
- By Sales Channel
- By Country
- Market Attractiveness Analysis
- By Country
- By Barrier Type
- By Deployment
- By Application
- By End Use
- By Sales Channel
- Key Takeaways
- South Asia and Pacific Market Analysis and Forecast, By Country
- Historical Market Size Value (USD Million) & Volume (Unit) Trend Analysis By Market Taxonomy, 2021 to 2025
- Market Size Value (USD Million) & Volume (Unit) Forecast By Market Taxonomy, 2026 to 2036
- By Country
- India
- ASEAN
- Australia & New Zealand
- Rest of South Asia and Pacific
- By Barrier Type
- By Deployment
- By Application
- By End Use
- By Sales Channel
- By Country
- Market Attractiveness Analysis
- By Country
- By Barrier Type
- By Deployment
- By Application
- By End Use
- By Sales Channel
- Key Takeaways
- Middle East & Africa Market Analysis and Forecast, By Country
- Historical Market Size Value (USD Million) & Volume (Unit) Trend Analysis By Market Taxonomy, 2021 to 2025
- Market Size Value (USD Million) & Volume (Unit) Forecast By Market Taxonomy, 2026 to 2036
- By Country
- Kingdom of Saudi Arabia
- Other GCC Countries
- Türkiye
- South Africa
- Other African Union
- Rest of Middle East & Africa
- By Barrier Type
- By Deployment
- By Application
- By End Use
- By Sales Channel
- By Country
- Market Attractiveness Analysis
- By Country
- By Barrier Type
- By Deployment
- By Application
- By End Use
- By Sales Channel
- Key Takeaways
- Key Countries Market Analysis
- USA
- Pricing Analysis
- Market Share Analysis, 2025
- By Barrier Type
- By Deployment
- By Application
- By End Use
- By Sales Channel
- Canada
- Pricing Analysis
- Market Share Analysis, 2025
- By Barrier Type
- By Deployment
- By Application
- By End Use
- By Sales Channel
- Mexico
- Pricing Analysis
- Market Share Analysis, 2025
- By Barrier Type
- By Deployment
- By Application
- By End Use
- By Sales Channel
- Brazil
- Pricing Analysis
- Market Share Analysis, 2025
- By Barrier Type
- By Deployment
- By Application
- By End Use
- By Sales Channel
- Chile
- Pricing Analysis
- Market Share Analysis, 2025
- By Barrier Type
- By Deployment
- By Application
- By End Use
- By Sales Channel
- Germany
- Pricing Analysis
- Market Share Analysis, 2025
- By Barrier Type
- By Deployment
- By Application
- By End Use
- By Sales Channel
- UK
- Pricing Analysis
- Market Share Analysis, 2025
- By Barrier Type
- By Deployment
- By Application
- By End Use
- By Sales Channel
- Italy
- Pricing Analysis
- Market Share Analysis, 2025
- By Barrier Type
- By Deployment
- By Application
- By End Use
- By Sales Channel
- Spain
- Pricing Analysis
- Market Share Analysis, 2025
- By Barrier Type
- By Deployment
- By Application
- By End Use
- By Sales Channel
- France
- Pricing Analysis
- Market Share Analysis, 2025
- By Barrier Type
- By Deployment
- By Application
- By End Use
- By Sales Channel
- India
- Pricing Analysis
- Market Share Analysis, 2025
- By Barrier Type
- By Deployment
- By Application
- By End Use
- By Sales Channel
- ASEAN
- Pricing Analysis
- Market Share Analysis, 2025
- By Barrier Type
- By Deployment
- By Application
- By End Use
- By Sales Channel
- Australia & New Zealand
- Pricing Analysis
- Market Share Analysis, 2025
- By Barrier Type
- By Deployment
- By Application
- By End Use
- By Sales Channel
- China
- Pricing Analysis
- Market Share Analysis, 2025
- By Barrier Type
- By Deployment
- By Application
- By End Use
- By Sales Channel
- Japan
- Pricing Analysis
- Market Share Analysis, 2025
- By Barrier Type
- By Deployment
- By Application
- By End Use
- By Sales Channel
- South Korea
- Pricing Analysis
- Market Share Analysis, 2025
- By Barrier Type
- By Deployment
- By Application
- By End Use
- By Sales Channel
- Russia
- Pricing Analysis
- Market Share Analysis, 2025
- By Barrier Type
- By Deployment
- By Application
- By End Use
- By Sales Channel
- Poland
- Pricing Analysis
- Market Share Analysis, 2025
- By Barrier Type
- By Deployment
- By Application
- By End Use
- By Sales Channel
- Hungary
- Pricing Analysis
- Market Share Analysis, 2025
- By Barrier Type
- By Deployment
- By Application
- By End Use
- By Sales Channel
- Kingdom of Saudi Arabia
- Pricing Analysis
- Market Share Analysis, 2025
- By Barrier Type
- By Deployment
- By Application
- By End Use
- By Sales Channel
- Türkiye
- Pricing Analysis
- Market Share Analysis, 2025
- By Barrier Type
- By Deployment
- By Application
- By End Use
- By Sales Channel
- South Africa
- Pricing Analysis
- Market Share Analysis, 2025
- By Barrier Type
- By Deployment
- By Application
- By End Use
- By Sales Channel
- USA
- Market Structure Analysis
- Competition Dashboard
- Competition Benchmarking
- Market Share Analysis of Top Players
- By Regional
- By Barrier Type
- By Deployment
- By Application
- By End Use
- By Sales Channel
- Emerging Startups
- Innovation Benchmarking
- Competition Analysis
- Competition Deep Dive
- AquaFence
- Overview
- Product Portfolio
- Profitability by Market Segments (Product/Region/Sales Channel)
- Sales Footprint
- Strategy Overview
- Marketing Strategy
- Product Strategy
- Channel Strategy
- FloodBreak
- NoFloods
- IBS Technics
- FlexBarrier
- Tiger Dam
- Rapidam
- Flood Control International
- HESCO
- Geodesign Barriers
- AquaFence
- Case Studies
- Success Stories
- Recent Developments
- Competition Deep Dive
- Assumptions & Acronyms Used


