Innovation Management Market Outlook (2022 to 2032)

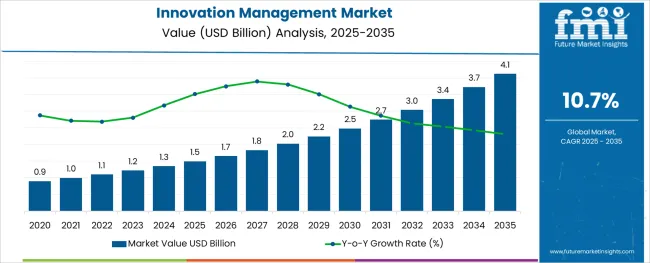
The innovation management market is projected to have a significant CAGR of 10.7% during the period of 2022 to 2032.

The Innovation Management Market is predicted to grow from USD 1.1 Billion in 2022 to USD 3.1 Billion in 2032. Previously, the market grew at a faster rate of 12.6% per year from 2015 to 2021, culminating in a market worth USD 1 Billion in 2021.

Firms' increased focus on developing new, innovative, and personalized products, as well as consumer demand for new and inventive items to fulfill their expectations, are driving the innovation management market.

Due to a variety of benefits, such as the rise in digitization and the emerging trend of workplace transformation, reduced costs, efficient collaborations, and reduced time to market new products, innovation management solutions are rapidly gaining acceptance by large enterprises and SMEs around the world.

Attributes Details
Innovation Management Market CAGR (2022 to 2032) 10.7%
Innovation Management Market Size (2022) USD 1.1 Billion
Innovation Management Market Size (2032) USD 3.1 Billion

What Thrives the Innovation Management Market

Open innovation is the sharing of ideas and knowledge among stakeholders, such as enterprise employees, business partners, the general public, and customers, in order to improve products, services, and business processes for a better customer experience and increased income.

Open innovation is comparable to crowd-sourcing innovation. It begins with product and service enhancement suggestions and progresses to open business model innovation. It establishes a strong connection between stakeholders, such as businesses, their staff, and their customers.

Enterprise management teams can predict ideas that can generate revenue and improve the customer experience based on the exchange of ideas. This would also help the company maintain its market competitiveness by increasing brand reliability. The ideas generated by crowd-sourcing can help businesses improve their operational efficiency.

What Restrains the Innovation Management Market?

Enterprises can improve their business processes by deploying innovation management systems. However, it has been shown that there are no quantifiable criteria for evaluating the return on investment (ROI) generated by the utilization of these innovation management products and services.

As a result, businesses that use innovation management solutions are unable to deliver consistent returns on investment. Innovation management systems must be integrated with various organizations' adopted strategies in order to determine particular Key Performance Indicators (KPIs) that can be used to track the level of stakeholder participation in innovations, such as consumers, partners, and employees.

To track and ascribe business value generated by innovations, companies must examine the appropriate KPIs in accordance with top-level management.

What are the Lucrative Opportunities Present in the Innovation Management Market?

Almost every organization has undergone a digital transformation. The rapid advancement of technology has resulted in the development of a vast volume of data, which has increased the need for data storage and processing speed.

Innovation management systems have progressed practically in lockstep with technical advancement. Enterprises are making key decisions based on the ideas generated by various innovation management tools. The sectors could quickly increase their growth in the innovation management market if they take advantage of these enticing chances.

What are the Challenges in the Innovation Management Market?

Despite the fact that innovation management solutions have improved in recent years, the market's information security capabilities remain a serious concern. Enterprises are highly cautious about their communication channels, such as emails, instant messaging, and mobile communication, as they have a direct impact on the security and privacy of company data.

The majority of clients are unaware of the long-term benefits of expanding the innovation management market. As a result, it demonstrates their unwillingness to contribute a larger sum during the initial agreement.

What is the Segmentation Outlook of the Innovation Management Market?

The innovation management market is segmented into function, component, organizational size, deployment type, verticals, and region.

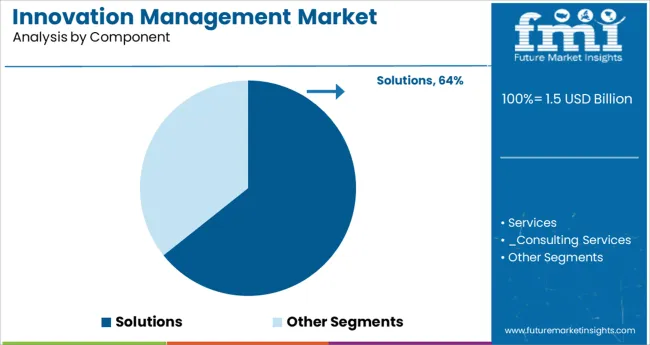
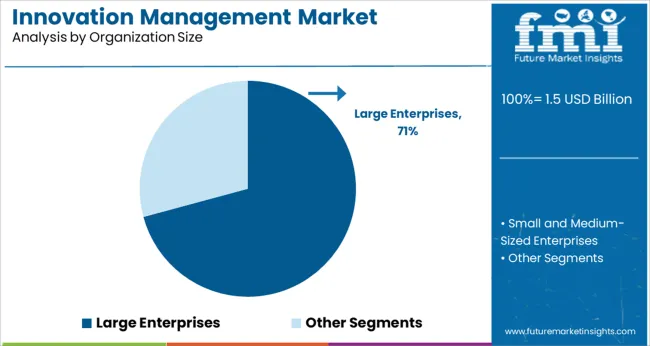
Depending on the size of the organization, when compared to SMEs, large companies are more likely to use innovation management solutions. The rapid use of cloud-based innovation management solutions by SMEs around the world has grown.

Which is the Leading Segment in the Innovation Management Market by Component?

With a predicted CAGR of 10.6%, services are the leading segment in the innovation management market. Consulting, system integration, and training, support, and maintenance are the three categories of innovation management services. Business consulting, maturity value consulting, business value consulting, business discovery, business alignment management, and business architecture management are some of the pre-deployment services offered by innovation management consulting services.

These consulting services assist businesses in using new technologies in order to transform their existing and traditional infrastructure into smart infrastructure.

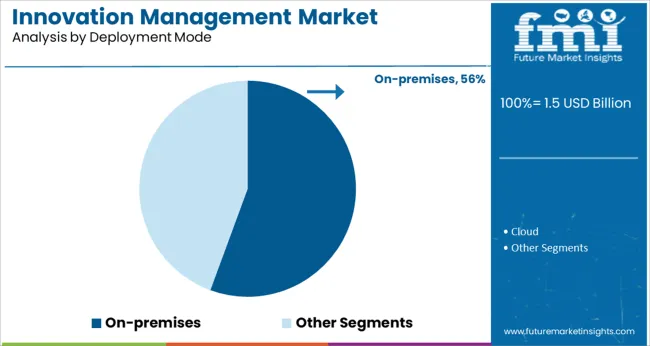
Which is the Leading Segment in the Innovation Management Market by Deployment Type?

In the global innovation management market, the cloud deployment category had the majority revenue share, with a predicted CAGR of 10.3%.

Cloud-based innovation management solutions are essential, as they provide a scalable and adaptable infrastructure for managing many devices and analyzing ideas from employees, customers, and partners.

Though cloud deployment makes it easier to implement innovation management solutions, it also comes with a number of significant challenges, including legal regulations, security and safety, operational control, reliability, transformation complexity, performance, content governance, and, most importantly, the promised Return on Investment (RoI) benefits.
Which is the Key Region in the Innovation Management Market?

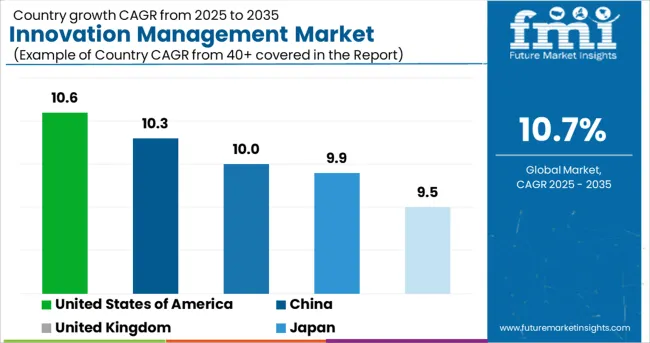
Regions CAGR (2022 to 2032)
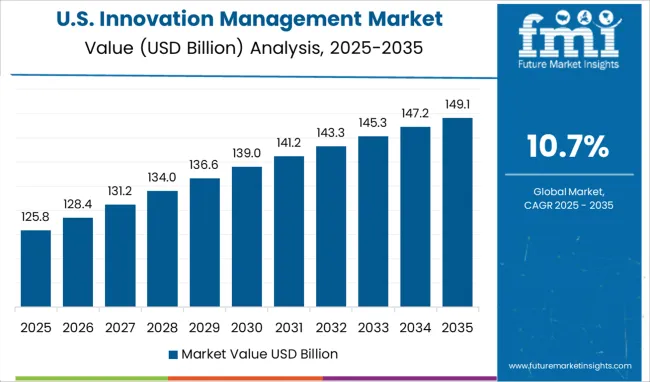
United States of America 10.6%
United Kingdom 10%
China 10.3%
Japan 9.9%
South Korea 9.5%

North America is estimated to account for the largest share of the market, with a projected CAGR of 10.6%. At the same time, the Asia-Pacific region is expected to grow at the fastest rate during the forecast period. The considerable growth in the innovation management market in North America may be attributed to technological advancements and the growing demand for innovative products to meet customer needs.

According to the FMI report, individual market-affecting factors and changes in regulation in the domestic market are also discussed in the national portion of the research, which have an impact on the market's current and future trends. Downstream and upstream value chain analysis, technological trends, and case studies are just a few of the data pieces used to anticipate market scenarios for individual countries.
How Competition Influences the Innovation Management Market?

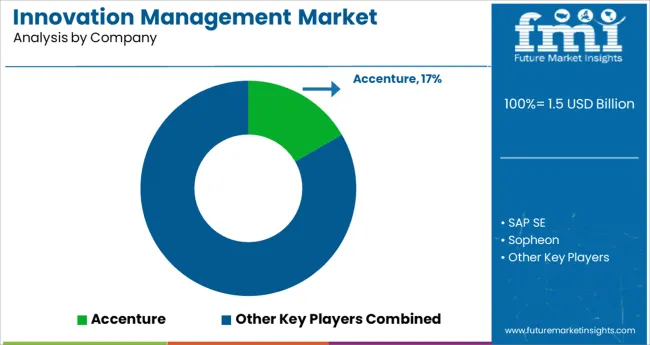
The development of innovative and efficient goods is the primary focus of players in the innovation management market. Research shows how the competitors are taking advantage of the opportunities present in the innovation management market.

Market companies continue to seek market expansion through a variety of important consolidations and acquisitions, advancement, developing interests in inventive work, and financially sound item portfolios. Some of the recent developments in the innovation management market are:

  • Aptage, a pioneer in the application of artificial intelligence and machine learning in work and portfolio management, was bought by Planview in July 2020. Planview sought to integrate AI and ML into their work management and portfolio management solutions with this acquisition.
  • With Big Data and Machine Learning, Qmarkets' most recent item release in May 2019 made significant progress in pushing forward management development and assisting customers with driving key job worries.
  • Planview updated its Agile setup in October 2019 by incorporating a Kanban-powered solution for automating its Agile team's catch expenses. The difficulties of spry scaling are no longer an issue. The Agile arrangement reduces development expenses, manual detailing time, and financial challenges as a result of this improvement.
  • Planview acquired Spigit, a development management programming provider, in December 2018. This guarding provides item and administration high-level abilities in assets and the advancement board.

Key players

  • Accenture
  • SAP SE
  • Sopheon
  • Planview
  • Qmarkets

Key Segments

By Component:

  • Solution
  • Services

By Deployment Type:

  • On-Premises
  • Cloud

By Function:

  • Product Development
  • Business Process

By Organizational Size:

  • Large Enterprise
  • Small & Medium Enterprise

By Vertical:

  • BSFI
  • Aerospace and Defense
  • Healthcare and Pharmaceuticals
  • Retail and eCommerce
  • Information Technology and Telecommunications
  • Government
  • Manufacturing
  • Transportation and Logistics
  • Others

By Region:

  • North America
  • Latin America
  • Europe
  • Asia Pacific
  • Middle East & Africa

Table of Content

  • 1. Executive Summary
  • 2. Market Overview
  • 3. Market Risks and Trends Assessment
  • 4. Market Background
  • 5. Key Success Factors
  • 6. Global Market Demand Analysis 2015 to 2021 and Forecast, 2022 to 2032
  • 7. Global Market Value Analysis 2015 to 2021 and Forecast, 2022 to 2032
  • 8. Global Market Analysis 2015 to 2021 and Forecast 2022 to 2032, By Component
    • 8.1. Solutions
    • 8.2. Services
      • 8.2.1. Consulting Services
      • 8.2.2. System Integration Services
      • 8.2.3. Training, Support, and Maintenance Services
  • 9. Global Market Analysis 2015 to 2021 and Forecast 2022 to 2032, By Organization Size
    • 91. Large Enterprises
    • 9.2. Small and Medium-Sized Enterprises
  • 10. Global Market Analysis 2015 to 2021 and Forecast 2022 to 2032, By Deployment Mode
    • 10.1. On-premises
    • 10.2. Cloud
  • 11. Global Market Analysis 2015 to 2021 and Forecast 2022 to 2032, By Vertical
    • 11.1. BFSI
    • 11.2. Aerospace and Defense
    • 11.3. Healthcare and Pharmaceuticals
    • 11.4. Retail and eCommerce
    • 11.5. Information Technology and Telecommunications
    • 11.6. Government
    • 11.7. Manufacturing
    • 11.8. Transportation and Logistics
    • 11.9. Others
  • 12. Global Market Analysis 2015 to 2021 and Forecast 2022 to 2032, By Function
    • 12.1. Product Development
    • 12.2. Business Processes
  • 13. Global Market Analysis 2015 to 2021 and Forecast 2022 to 2032, By Region
    • 13.1. North America
    • 13.2. Latin America
    • 13.3. Europe
    • 13.4. Asia Pacific
    • 13.5. Middle East and Africa (MEA)
  • 14. North America Market Analysis 2015 to 2021 and Forecast 2022 to 2032
  • 15. Latin America Market Analysis 2015 to 2021 and Forecast 2022 to 2032
  • 16. Europe Market Analysis 2015 to 2021 and Forecast 2022 to 2032
  • 17. Asia Pacific Market Analysis 2015 to 2021 and Forecast 2022 to 2032
  • 18. Middle East and Africa Market Analysis 2015 to 2021 and Forecast 2022 to 2032
  • 19. Key Countries Market Analysis 2015 to 2021 and Forecast 2022 to 2032
  • 20. Market Structure Analysis
  • 21. Competition Analysis
    • 21.1. Accenture
    • 21.2. SAP SE
    • 21.3. Sopheon
    • 21.4. Planview
    • 21.3. Qmarkets
    • 21.6. Brightidea
    • 21.7. Planbox
    • 21.8. HYPE
    • 21.9. IdeaScale
    • 21.10. Innosabi
  • 22. Assumptions and Acronyms Used
  • 23. Research Methodology

List of Tables

Table 1: Global Market Value (US$ Million), By Deployment Mode, 2015 to 2021

Table 2: Global Market Value (US$ Million), By Deployment Mode, 2022 to 2032

Table 3: Global Market Value (US$ Million), By Component, 2015 to 2021

Table 4: Global Market Value (US$ Million), By Component, 2022 to 2032

Table 5: Global Market Value (US$ Million), By Organization Size, 2015 to 2021

Table 6: Global Market Value (US$ Million), By Organization Size, 2022 to 2032

Table 7: Global Market Value (US$ Million), By Function, 2015 to 2021

Table 8: Global Market Value (US$ Million), By Function, 2022 to 2032

Table 9: Global Market Value (US$ Million), By Vertical, 2015 to 2021

Table 10: Global Market Value (US$ Million), By Vertical, 2022 to 2032

Table 11: Global Market, By Region, 2015 to 2021

Table 12: Global Market, By Region, 2022 to 2032

Table 13: North America Market Value (US$ Million), By Deployment Mode, 2015 to 2021

Table 14: North America Market Value (US$ Million), By Deployment Mode, 2022 to 2032

Table 15: North America Market Value (US$ Million), By Component, 2015 to 2021

Table 16: North America Market Value (US$ Million), By Component, 2022 to 2032

Table 17: North America Market Value (US$ Million), By Organization Size, 2015 to 2021

Table 18: North America Market Value (US$ Million), By Organization Size, 2022 to 2032

Table 19: North America Market Value (US$ Million), By Function, 2015 to 2021

Table 20: North America Market Value (US$ Million), By Function, 2022 to 2032

Table 21: North America Market Value (US$ Million), By Vertical, 2015 to 2021

Table 22: North America Market Value (US$ Million), By Vertical, 2022 to 2032

Table 23: North America Market, By Country, 2015 to 2021

Table 24: North America Market, By Country, 2022 to 2032

Table 25: Latin America Market Value (US$ Million), By Deployment Mode, 2015 to 2021

Table 26: Latin America Market Value (US$ Million), By Deployment Mode, 2022 to 2032

Table 27: Latin America Market Value (US$ Million), By Component, 2015 to 2021

Table 28: Latin America Market Value (US$ Million), By Component, 2022 to 2032

Table 29: Latin America Market Value (US$ Million), By Organization Size, 2015 to 2021

Table 30: Latin America Market Value (US$ Million), By Organization Size, 2022 to 2032

Table 31: Latin America Market Value (US$ Million), By Function, 2015 to 2021

Table 32: Latin America Market Value (US$ Million), By Function, 2022 to 2032

Table 33: Latin America Market Value (US$ Million), By Vertical, 2015 to 2021

Table 34: Latin America Market Value (US$ Million), By Vertical, 2022 to 2032

Table 35: Latin America Market, By Country, 2015 to 2021

Table 36: Latin America Market, By Country, 2022 to 2032

Table 37: Europe Market Value (US$ Million), By Deployment Mode, 2015 to 2021

Table 38: Europe Market Value (US$ Million), By Deployment Mode, 2022 to 2032

Table 39: Europe Market Value (US$ Million), By Component, 2015 to 2021

Table 40: Europe Market Value (US$ Million), By Component, 2022 to 2032

Table 41: Europe Market Value (US$ Million), By Organization Size, 2015 to 2021

Table 42: Europe Market Value (US$ Million), By Organization Size, 2022 to 2032

Table 43: Europe Market Value (US$ Million), By Function, 2015 to 2021

Table 44: Europe Market Value (US$ Million), By Function, 2022 to 2032

Table 45: Europe Market Value (US$ Million), By Vertical, 2015 to 2021

Table 46: Europe Market Value (US$ Million), By Vertical, 2022 to 2032

Table 47: Europe Market, By Country, 2015 to 2021

Table 48: Europe Market, By Country, 2022 to 2032

Table 49: Asia Pacific Market Value (US$ Million), By Deployment Mode, 2015 to 2021

Table 50: Asia Pacific Market Value (US$ Million), By Deployment Mode, 2022 to 2032

Table 51: Asia Pacific Market Value (US$ Million), By Component, 2015 to 2021

Table 52: Asia Pacific Market Value (US$ Million), By Component, 2022 to 2032

Table 53: Asia Pacific Market Value (US$ Million), By Organization Size, 2015 to 2021

Table 54: Asia Pacific Market Value (US$ Million), By Organization Size, 2022 to 2032

Table 55: Asia Pacific Market Value (US$ Million), By Function, 2015 to 2021

Table 56: Asia Pacific Market Value (US$ Million), By Function, 2022 to 2032

Table 57: Asia Pacific Market Value (US$ Million), By Vertical, 2015 to 2021

Table 58: Asia Pacific Market Value (US$ Million), By Vertical, 2022 to 2032

Table 59: Asia Pacific Market, By Country, 2015 to 2021

Table 60: Asia Pacific Market, By Country, 2022 to 2032

Table 61: MEA Market Value (US$ Million), By Deployment Mode, 2015 to 2021

Table 62: MEA Market Value (US$ Million), By Deployment Mode, 2022 to 2032

Table 63: MEA Market Value (US$ Million), By Component, 2015 to 2021

Table 64: MEA Market Value (US$ Million), By Component, 2022 to 2032

Table 65: MEA Market Value (US$ Million), By Organization Size, 2015 to 2021

Table 66: MEA Market Value (US$ Million), By Organization Size, 2022 to 2032

Table 67: MEA Market Value (US$ Million), By Function, 2015 to 2021

Table 68: MEA Market Value (US$ Million), By Function, 2022 to 2032

Table 69: MEA Market Value (US$ Million), By Vertical, 2015 to 2021

Table 70: MEA Market Value (US$ Million), By Vertical, 2022 to 2032

Table 71: MEA Market, By Country, 2015 to 2021

Table 72: MEA Market, By Country, 2022 to 2032

List of Figures

Figure 1: Global Market Value (US$ Million) and Year-on-Year Growth, 2015 to 2032

Figure 2: Global Market Absolute $ Historical Gain (2015 to 2021) and Opportunity (2022 to 2032), US$ Million

Figure 3: Global Market Share, By Deployment Mode, 2022 & 2032

Figure 4: Global Market Y-o-Y Growth Projections, By Deployment Mode - 2022 to 2032

Figure 5: Global Market Attractiveness Index, By Deployment Mode - 2022 to 2032

Figure 6: Global Market Share, By Component, 2022 & 2032

Figure 7: Global Market Y-o-Y Growth Projections, By Component - 2022 to 2032

Figure 8: Global Market Attractiveness Index, By Component - 2022 to 2032

Figure 9: Global Market Share, By Function, 2022 & 2032

Figure 10: Global Market Y-o-Y Growth Projections, By Function - 2022 to 2032

Figure 11: Global Market Attractiveness Index, By Function - 2022 to 2032

Figure 12: Global Market Share, By Organization Size, 2022 & 2032

Figure 13: Global Market Y-o-Y Growth Projections, By Organization Size - 2022 to 2032

Figure 14: Global Market Attractiveness Index, By Organization Size - 2022 to 2032

Figure 15: Global Market Share, By Vertical, 2022 & 2032

Figure 16: Global Market Y-o-Y Growth Projections, By Vertical - 2022 to 2032

Figure 17: Global Market Attractiveness Index, By Vertical - 2022 to 2032

Figure 18: Global Market Share, By Region, 2022 & 2032

Figure 19: Global Market Y-o-Y Growth Projections, By Region - 2022 to 2032

Figure 20: Global Market Attractiveness Index, By Region - 2022 to 2032

Figure 21: North America Market Value (US$ Million) and Year-on-Year Growth, 2015 to 2032

Figure 22: North America Market Absolute $ Historical Gain (2015 to 2021) and Opportunity (2022 to 2032), US$ Million

Figure 23: North America Market Share, By Deployment Mode, 2022 & 2032

Figure 24: North America Market Y-o-Y Growth Projections, By Deployment Mode - 2022 to 2032

Figure 25: North America Market Attractiveness Index, By Deployment Mode - 2022 to 2032

Figure 26: North America Market Share, By Component, 2022 & 2032

Figure 27: North America Market Y-o-Y Growth Projections, By Component - 2022 to 2032

Figure 28: North America Market Attractiveness Index, By Component - 2022 to 2032

Figure 29: North America Market Share, By Function, 2022 & 2032

Figure 30: North America Market Y-o-Y Growth Projections, By Function - 2022 to 2032

Figure 31: North America Market Attractiveness Index, By Function - 2022 to 2032

Figure 32: North America Market Share, By Organization Size, 2022 & 2032

Figure 33: North America Market Y-o-Y Growth Projections, By Organization Size - 2022 to 2032

Figure 34: North America Market Attractiveness Index, By Organization Size - 2022 to 2032

Figure 35: North America Market Share, By Vertical, 2022 & 2032

Figure 36: North America Market Y-o-Y Growth Projections, By Vertical - 2022 to 2032

Figure 37: North America Market Attractiveness Index, By Vertical - 2022 to 2032

Figure 38: North America Market Share, By Country, 2022 & 2032

Figure 39: North America Market Y-o-Y Growth Projections, By Country - 2022 to 2032

Figure 40: North America Market Attractiveness Index, By Country - 2022 to 2032

Figure 41: Latin America Market Value (US$ Million) and Year-on-Year Growth, 2015 to 2032

Figure 42: Latin America Market Absolute $ Historical Gain (2015 to 2021) and Opportunity (2022 to 2032), US$ Million

Figure 43: Latin America Market Share, By Deployment Mode, 2022 & 2032

Figure 44: Latin America Market Y-o-Y Growth Projections, By Deployment Mode - 2022 to 2032

Figure 45: Latin America Market Attractiveness Index, By Deployment Mode - 2022 to 2032

Figure 46: Latin America Market Share, By Component, 2022 & 2032

Figure 47: Latin America Market Y-o-Y Growth Projections, By Component - 2022 to 2032

Figure 48: Latin America Market Attractiveness Index, By Component - 2022 to 2032

Figure 49: Latin America Market Share, By Function, 2022 & 2032

Figure 50: Latin America Market Y-o-Y Growth Projections, By Function - 2022 to 2032

Figure 51: Latin America Market Attractiveness Index, By Function - 2022 to 2032

Figure 52: Latin America Market Share, By Organization Size, 2022 & 2032

Figure 53: Latin America Market Y-o-Y Growth Projections, By Organization Size - 2022 to 2032

Figure 54: Latin America Market Attractiveness Index, By Organization Size - 2022 to 2032

Figure 55: Latin America Market Share, By Vertical, 2022 & 2032

Figure 56: Latin America Market Y-o-Y Growth Projections, By Vertical - 2022 to 2032

Figure 57: Latin America Market Attractiveness Index, By Vertical - 2022 to 2032

Figure 58: Latin America Market Share, By Country, 2022 & 2032

Figure 59: Latin America Market Y-o-Y Growth Projections, By Country - 2022 to 2032

Figure 60: Latin America Market Attractiveness Index, By Country - 2022 to 2032

Figure 61: Europe Market Value (US$ Million) and Year-on-Year Growth, 2015 to 2032

Figure 62: Europe Market Absolute $ Historical Gain (2015 to 2021) and Opportunity (2022 to 2032), US$ Million

Figure 63: Europe Market Share, By Deployment Mode, 2022 & 2032

Figure 64: Europe Market Y-o-Y Growth Projections, By Deployment Mode - 2022 to 2032

Figure 65: Europe Market Attractiveness Index, By Deployment Mode - 2022 to 2032

Figure 66: Europe Market Share, By Component, 2022 & 2032

Figure 67: Europe Market Y-o-Y Growth Projections, By Component - 2022 to 2032

Figure 68: Europe Market Attractiveness Index, By Component - 2022 to 2032

Figure 69: Europe Market Share, By Function, 2022 & 2032

Figure 70: Europe Market Y-o-Y Growth Projections, By Function - 2022 to 2032

Figure 71: Europe Market Attractiveness Index, By Function - 2022 to 2032

Figure 72: Europe Market Share, By Organization Size, 2022 & 2032

Figure 73: Europe Market Y-o-Y Growth Projections, By Organization Size - 2022 to 2032

Figure 74: Europe Market Attractiveness Index, By Organization Size - 2022 to 2032

Figure 75: Europe Market Share, By Vertical, 2022 & 2032

Figure 76: Europe Market Y-o-Y Growth Projections, By Vertical - 2022 to 2032

Figure 77: Europe Market Attractiveness Index, By Vertical - 2022 to 2032

Figure 78: Europe Market Share, By Country, 2022 & 2032

Figure 79: Europe Market Y-o-Y Growth Projections, By Country - 2022 to 2032

Figure 80: Europe Market Attractiveness Index, By Country - 2022 to 2032

Figure 81: Asia Pacific Market Value (US$ Million) and Year-on-Year Growth, 2015 to 2032

Figure 82: Asia Pacific Market Absolute $ Historical Gain (2015 to 2021) and Opportunity (2022 to 2032), US$ Million

Figure 83: Asia Pacific Market Share, By Deployment Mode, 2022 & 2032

Figure 84: Asia Pacific Market Y-o-Y Growth Projections, By Deployment Mode - 2022 to 2032

Figure 85: Asia Pacific Market Attractiveness Index, By Deployment Mode - 2022 to 2032

Figure 86: Asia Pacific Market Share, By Component, 2022 & 2032

Figure 87: Asia Pacific Market Y-o-Y Growth Projections, By Component - 2022 to 2032

Figure 88: Asia Pacific Market Attractiveness Index, By Component - 2022 to 2032

Figure 89: Asia Pacific Market Share, By Function, 2022 & 2032

Figure 90: Asia Pacific Market Y-o-Y Growth Projections, By Function - 2022 to 2032

Figure 91: Asia Pacific Market Attractiveness Index, By Function - 2022 to 2032

Figure 92: Asia Pacific Market Share, By Organization Size, 2022 & 2032

Figure 93: Asia Pacific Market Y-o-Y Growth Projections, By Organization Size - 2022 to 2032

Figure 94: Asia Pacific Market Attractiveness Index, By Organization Size - 2022 to 2032

Figure 95: Asia Pacific Market Share, By Vertical, 2022 & 2032

Figure 96: Asia Pacific Market Y-o-Y Growth Projections, By Vertical - 2022 to 2032

Figure 97: Asia Pacific Market Attractiveness Index, By Vertical - 2022 to 2032

Figure 98: Asia Pacific Market Share, By Country, 2022 & 2032

Figure 99: Asia Pacific Market Y-o-Y Growth Projections, By Country - 2022 to 2032

Figure 100: Asia Pacific Market Attractiveness Index, By Country - 2022 to 2032

Figure 101: MEA Market Value (US$ Million) and Year-on-Year Growth, 2015 to 2032

Figure 102: MEA Market Absolute $ Historical Gain (2015 to 2021) and Opportunity (2022 to 2032), US$ Million

Figure 103: MEA Market Share, By Deployment Mode, 2022 & 2032

Figure 104: MEA Market Y-o-Y Growth Projections, By Deployment Mode - 2022 to 2032

Figure 105: MEA Market Attractiveness Index, By Deployment Mode - 2022 to 2032

Figure 106: MEA Market Share, By Component, 2022 & 2032

Figure 107: MEA Market Y-o-Y Growth Projections, By Component - 2022 to 2032

Figure 108: MEA Market Attractiveness Index, By Component - 2022 to 2032

Figure 109: MEA Market Share, By Function, 2022 & 2032

Figure 110: MEA Market Y-o-Y Growth Projections, By Function - 2022 to 2032

Figure 111: MEA Market Attractiveness Index, By Function - 2022 to 2032

Figure 112: MEA Market Share, By Organization Size, 2022 & 2032

Figure 113: MEA Market Y-o-Y Growth Projections, By Organization Size - 2022 to 2032

Figure 114: MEA Market Attractiveness Index, By Organization Size - 2022 to 2032

Figure 115: MEA Market Share, By Vertical, 2022 & 2032

Figure 116: MEA Market Y-o-Y Growth Projections, By Vertical - 2022 to 2032

Figure 117: MEA Market Attractiveness Index, By Vertical - 2022 to 2032

Figure 118: MEA Market Share, By Country, 2022 & 2032

Figure 119: MEA Market Y-o-Y Growth Projections, By Country - 2022 to 2032

Figure 120: MEA Market Attractiveness Index, By Country - 2022 to 2032

Frequently Asked Questions

What is the CAGR of the Innovation Management Market?

The Innovation Management Market is projected to have a CAGR of 10.7% in 2032.

Which is the Leading Region in the Innovation Management Market?

North America is the leading region, with an anticipated CAGR of 10.6% by 2032.

Which Segment Leads in the Innovation Management Market by Deployment Type?

Cloud leads the market with the projected CAGR of 10.3% by 2032.

What is the Growth Estimated for the Innovation Management Market by 2032?

The Innovation Management Market is predicted to grow USD 3.1 Billion by 2032.

Which Segment Leads in the Innovation Management Market by Component?

Services lead the market with the projected CAGR of 10.6% by 2032.

Explore Similar Insights

Future Market Insights

Innovation Management Market