Kegerator Equipment Market Outlook (2023 to 2033)

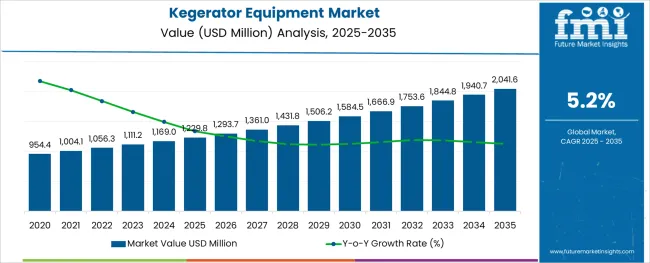
According to Future Market Insights' study, the kegerator equipment market is expected to grow at a CAGR of 5.2% over the estimated period. The industry value is expected to grow from US$ 1,111.2 million in 2023 to US$ 1,846.5 million by 2033.

The kegerator equipment market was worth US$ 1,057.2 million by the end of 2022.

Attributes Value
Kegerator Equipment Market Value 2023 US$ 1,111.2 million
Kegerator Equipment Market Forecast Value in 2033 US$ 1,846.5 million
Kegerator Equipment Market Expected CAGR (2023 to  2033) 5.2%
Global Market Share of USA, Germany, Japan, and Australia 66.6%

Some of the factors which might propel the market growth are:

  • A surging craft beer market.
  • Rapidly increasing luxury hotel market.
  • Burgeoning PBCL market, and its increasing popularity especially amongst the current generation youth.

Don't pay for what you don't need

Customize your report by selecting specific countries or regions and save 30%!

Historical Outlook versus Future Projections for Kegerator Equipment Market

The global market for kegerator equipment increased from US$ 1,446.5 million to US$ 1,057.2 million between 2018 and 2022, with a CAGR of 3.7%.

The industry has seen consistent growth over the past few years and is projected to continue this trend in the future. The industry is expected to continue its strong growth in the coming years. This is likely to be driven by the increasing popularity of craft beer and the continued expansion of the retail market.

During the forecast period, the global kegerator equipment market is anticipated to grow from US$ 1,111.2 billion in 2023 to US$ 1,846.5 billion by 2033, with a healthy CAGR of 5.2%.

Kegerator Equipment Market

Comparative View for Kegerator Equipment Market

Kegerator Equipment Market:

Attributes Kegerator Equipment Market
Anticipated CAGR (2023 to 2033) 5.2%
Market Value (2023) US$ 1111.2 million
Growth Factor Ability to store large quantities of bear and to retain their freshness for longer periods of time.
Future Opportunities The surging wine market represents huge opportunities for the market.
Market Trends The kegerator equipment is being currently utilized in the PBCL market in large quantities, which shows large prospects for the market.

Carbonated Beverages Market:

Attributes Carbonated Beverages Market
Anticipated CAGR (2023 to 2033) 5.4%
Market Value (2023) US$ 492.05 billion
Growth Factor Growing demand for premium drinks, coupled with increasing disposable income is expected to increase the demand for carbonated beverages.
Future Opportunities The availability of carbonated beverages in a number of flavors is expected to drive the sales of carbonated beverages during the forecast period.
Market Trends Currently, there are mobile-enabled applications that help us personalize the beverages based on our requirements.

Brewery Equipment Market:

Attributes Brewery Equipment Market
Anticipated CAGR (2023 to 2033) 5.2%
Market Value (2023) US$ 18.1 billion
Growth Factor Increased consumption of beer because of its health benefits is expected to surge the brewery equipment market during the forecast period.
Future Opportunities Growing consumption of craft beer is expected to surge the brewery equipment market during the forecast period.
Market Trends The key players operating in the market are on a mission to develop affordable brewery equipment.
Nandini Roy Choudhury

Principal Consultant

Talk to Analyst

Find your sweet spots for generating winning opportunities in this market.

Drivers for the Kegerator Equipment Market

Ability to store large quantities of beer and dispense without foam

One of the biggest advantages of using a kegerator is its ability to store large quantities of beer. This is expected to further increase the sales of kegerator equipment. Moreover, the ability to keep beer fresh for long periods of time and the ability to dispense beer without foam has surged the market share of the kegerator equipment.

Ease of beer dispensing

The process of dispensing beer becomes seamless using kegerator equipment, as a result of which these are being increasingly used in the brewery market. They are becoming increasingly popular as they allow people to enjoy fresh draft beer at home kegerator without having to invest in expensive brewing equipment.

Category-wise Insights

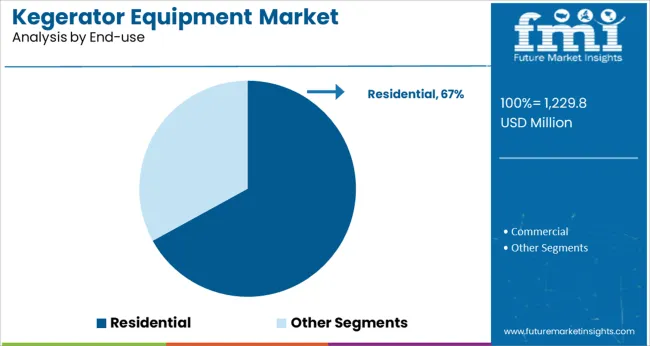
Based on the End Use, the Commercial Sector has the Highest Market Share

The commercial sector is responsible for a significant portion of the demand for kegerator equipment. This is due to the fact that businesses in the commercial sector often need to serve large quantities of beer at once, and kegerators are an efficient way to do so. In addition, commercial businesses often have a higher budget than individual consumers, so they are more likely to purchase high-end kegerator models.

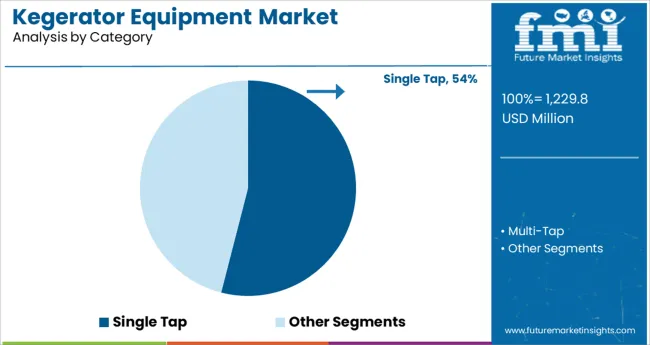
Based on the Category, the Multi-Tap Segment has the Highest Market Share

Multi-tap kegerator equipment has many advantages that make it a great choice for those who are looking for an efficient and effective way to dispense beer. Multi-tap kegerator equipment is able to provide a consistent flow of beer, meaning that there is less wastage and fewer foam pours.

Additionally, the ability to have multiple taps allows for a greater variety of beers on tap, which can be a big selling point for customers or guests. Finally, multi-tap kegerator equipment is easy to clean and maintain, which is an important consideration when choosing any type of keg system.

Based on the Application, the Draft Beer segment has the Highest Market Share

The draft beer segment has the largest market. This type of equipment is used to store and dispense kegs of beer. There are many different types and sizes of kegerators, but they all have one common purpose: to keep your draft beer cold and fresh, as a result of which the adoption of kegerator equipment has been increasing.

Kegerators also allow us to store multiple kegs of beer at once, so you always have a cold one on hand, as a result of which they are highly preferred in bars. They also help to maintain the carbonation in the beer, so it tastes fresher for longer.
Get the data you need at a Fraction of the cost

Personalize your report by choosing insights you need
and save 40%!

Country-wise Insights

Massive consumption of craft beer in North America represents huge opportunities for the Market

North America is expected to be the largest market during the forecast period.

North America is also the largest craft beer market, and as of 2022, North America had a market valuation of US$ 97 billion, which is roughly 40% of the global craft beer market. The major market driver of craft beer is the emergence of new flavors. The market is currently dominated by the current generation

The hotels, restaurants, and bars where craft beers are served are making use of the kegging equipment because of the shelf life associated with the usage of this equipment.

Apart from that, there is also an increase in the consumption of functional beverages worldwide. Based on the research conducted by FMI, the functional beverages market is expected to grow at a CAGR of nearly 6% during the forecast period. The inclination of youth towards flavored drinks is expected to drive the market.

The kegerator equipment can be used to store these beverages in bulk quantities. Owing to their ability to restore the freshness of the beverages for a long time, these are preferred by the manufacturers who are operating in the kegerator equipment market.

Moreover, the companies that are operating on the basis of achieving sustainable development, the application of kegerator equipment is of great significance as the kegs which are used in this equipment are reusable. Consequently, the accumulation of wastage reduces. Furthermore, the application of kegerator equipment also assists in freeing up space in the refrigerator.

How is the Kegerator Equipment market evolving in the United States?

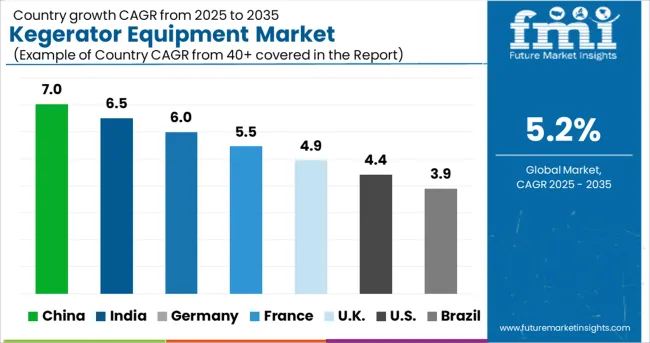
The USA accounted for 33.9% of the Global market with a value of US$ 377.0 million in 2023. The kegerator equipment market in the United States is evolving rapidly. In recent years, there has been an explosion in the number of new kegerator equipment manufacturers and suppliers. This has led to a more competitive market with lower prices and better-quality products.

One of the most notable trends in the kegerator equipment market is the move toward online sales. This is a result of the growing popularity of online shopping and the convenience it offers consumers. More and more kegerator equipment manufacturers are now selling their products online, which has made it easier for consumers to compare prices and find the best deals.

How is the Europe market expected to perform during the Forecast Period?

Europe is expected to be one of the most significant markets during the forecast period.

The region is mainly meant for wine consumption and is the largest wine market. Based on the research, the Europe wine market has a valuation of US$ 206 billion as of 2022, and the market is expected to surge further. One of the key reasons behind the increased consumption of wine is the health benefits associated with it, like being an antioxidant and assisting in the healthy functioning of the heart.

The ability of the kegerator equipment to dispense beer without foam is something that has caught the attention of wine manufacturers, and this might increase the demand for kegerator equipment during the forecast period. These also assist in winemaking.

The United Kingdom Market will grow at 6.4% CAGR between 2023 and 2033. The United Kingdom is home to some of the world's leading manufacturers of kegerator equipment, so it's no surprise that the country has a significant share of the global market.

How is India emerging in the Kegerator Equipment market?

The India kegerator equipment market will grow at 6.4% CAGR between 2023 and 2033. India is a key player in the global kegerator equipment market. India is expected to see significant growth in the kegerator equipment market over the next few years.

This growth will be driven by factors such as the increasing popularity of craft beer and the growing middle class. India presents a unique opportunity for manufacturers of kegerator equipment. The country's large population and rapidly growing economy make it an attractive market for companies looking to expand their business.

How is Japan performing in the Kegerator Equipment Market?

Japan is expected to be one of the best-performing Markets. Thanks to a growing whiskey market in the country, which makes Japan is one of the largest markets for kegerator equipment.

The whiskey market in Japan was valued at close to US$ 1.3 billion as of 2022 and is expected to grow further during the forecast period. The whiskey manufacturers are depending on the kegerator equipment because of its ability to retain the freshness of the drink for longer periods of time.

How is South Korea Market expected to perform during the Forecast Period?

The South Korean market is expected to showcase significant growth during the forecast period.

A huge PBCL market in South Korea is expected to increase the sales of kegerator equipment during the forecast period. A rising preference for alcoholic beverages, coupled with an increase in nightlife and late-night parties is the major factor that has led to an increase in the PBCL market in South Korea.

The PBCL market is making use of kegerator equipment because of its ability to store huge quantities of drinks in a single go, and at the same time assist in the seamless dispensing of beer.

Start-up Ecosystem

The start-ups operating in the kegerator equipment market are on a mission to diversify their offerings. Rather than just focusing on cold beverages, the focus is also on managing food.

Crafty was founded in 2015. It is a centralized platform that managed food, beverages, and supplies for the in-office, remote, and hybrid teams working across the globe. The start-up has been managing pantries, catering, café, and supplies across their clients.

In April 2022, the company managed to raise US$ 10 million in series A funding, which was led by Tribeca Venture Partners.

Till date, Craft has managed to raise US$ 15 million from Greycroft, OCA Ventures, Manifold, Firebrand, Rubicon Venture Capital.  
Competitive Landscape

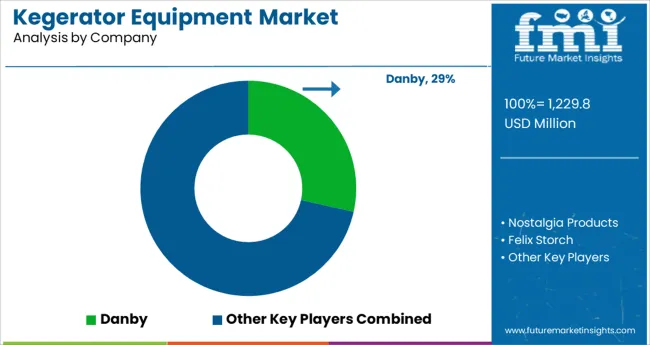
The kegerator equipment market is highly competitive with a large number of players. The market is also fragmented with small and medium-sized players. The competition in the market is intense with all the players trying to gain market share.

The key strategies adopted by the players in the market are product innovation, mergers and acquisitions, and expansion into new markets.

Some of the recent developments are:

  • In October 2022, Danby Appliances expands distribution equipment with Almo Corporation.
  • In June 2022, Haier ranked in Kantar BrandZ's top 100 most valuable global brands for 4 years in a row as the one and only IoT ecosystem brand.

Danby, Haier, and Versonel are taking up all the major steps to maintain the image of being the dominant forces in the market

Danby has been serving the niche for more than seven decades with a vision of creating truly innovative appliances that would offer unmatched features. The company has been able to evolve with time and has always offered solutions as per the situation.

Danby is currently one of the leading refrigeration and specialty appliance in North America, offering unique appliances loved by people. The company has operated on the principle of creating brilliant and inspired appliances to fit into its customer’s space. To ensure that the customer is taken care of, the company has been providing 12 months, 18 months, and 24-month warranties, that include parts, labor, and in-home service.

Haier is a world-class provider of a better life and digital transformation solutions. Haier has topped in Global Major Appliances Brand Rankings by Euromonitor International for 13 years. Haier has deployed 10+N innovation ecosystems, 71 research institutes, 33 industrial parks, and 133 manufacturing centers.

Haier majorly serves three major sectors: smart home and living, industrial internet, and great healthcare. The company is committed to working with world-class ecosystem partners to continuously develop high-end brands, scenario brands, and ecosystem brands. Haier has been making use of technological innovation to customize a personalized smart life for enabling the digital transformation of business, and promoting high-quality economic growth and sustainable social development. 

Versonel has the image of developing innovative, dependable, and stylish products for home and business. The focus has always been on intensive product research, testing, and customer feedback. The goal has always been to provide the best product that one can buy and maintain the balance between flawlessness and stylishness.

Key Companies Profiled

  • Danby
  • Nostalgia Products
  • Felix Storch
  • Living Direct
  • US Cooler
  • Kegco
  • Avanti Products (Croda International Inc.)
  • Krups
  • Versonel
  • Haier Group Corporation
  • DCS by Fisher & Paykel Appliances
  • Cydea Inc

Kegerator Equipment Market by Category

By Category:

  • Single Tap
  • Multi-Tap

By Size:

  • Mini size
  • Full size

By End-use:

  • Residential
  • Commercial

By Application:

  • Draft Beer
  • Wine
  • Cold Brew Coffee
  • Kombucha

By Region:

  • North America
  • Latin America
  • Europe
  • Asia Pacific
  • Oceania
  • Middle East and Africa (MEA)

Frequently Asked Questions

How big is the Kegerator Equipment Market?

The kegerator equipment market will reach nearly US$ 1,111.2 million by 2023.

At what rate Kegerator Equipment Market is expected to grow?

The Kegerator Equipment Market is expected to rise at a CAGR of 5.2%.

What is the demand outlook forecast for the Kegerator Equipment Market?

The global demand for Kegerator Equipment Market is forecasted to surpass US$ 1,846.5 million by the year 2033.

Table of Content
1. Executive Summary | Kegerator Equipment Market

    1.1. Global Market Outlook

    1.2. Demand-side Trends

    1.3. Supply-side Trends

    1.4. Technology Roadmap Analysis

    1.5. Analysis and Recommendations

2. Market Overview

    2.1. Market Coverage / Taxonomy

    2.2. Market Definition / Scope / Limitations

3. Market Background

    3.1. Market Dynamics

        3.1.1. Drivers

        3.1.2. Restraints

        3.1.3. Opportunity

        3.1.4. Trends

    3.2. Scenario Forecast

        3.2.1. Demand in Optimistic Scenario

        3.2.2. Demand in Likely Scenario

        3.2.3. Demand in Conservative Scenario

    3.3. Product launches & Recent Developments

    3.4. Product Life Cycle Analysis

    3.5. Value Chain Analysis

        3.5.1. Supply Side Participants and their Roles

            3.5.1.1. Producers

            3.5.1.2. Mid-Level Participants (Traders/ Agents/ Brokers)

            3.5.1.3. Wholesalers and Distributors

        3.5.2. % of Operating Margin Analysis

        3.5.3. List of Raw Material Suppliers

        3.5.4. List of Existing and Potential Buyer’s

    3.6. Global Market - Pricing Analysis

        3.6.1. Price Point Assessment by Region

        3.6.2. Price Point Assessment by Product Type

        3.6.3. Price Forecast till 2033

        3.6.4. Factors affecting pricing

    3.7. Forecast Factors - Relevance & Impact

    3.8. PESTLE and Porter’s Analysis

    3.9. Regulatory Landscape

        3.9.1. Packaging & Labelling Regulations

        3.9.2. Certifications and Certifying Agency Overview

        3.9.3. Import/Export Policies

    3.10. Regional Parent Market Outlook

    3.11. Production and Consumption Statistics

    3.12. Import and Export Statistics

    3.13. Consumers Survey Analysis

    3.14. Macro-Economic Factors

    3.15. Product Claims & Nutritional Information Scan by Buyers

4. Global Market Analysis 2018 to 2022 and Forecast, 2023 to 2033

    4.1. Historical Market Size Value (US$ million) & Volume (MT) Analysis, 2018 to 2022

    4.2. Current and Future Market Size Value (US$ million) & Volume (MT) Projections, 2023 to 2033

        4.2.1. Y-o-Y Growth Trend Analysis

        4.2.2. Absolute $ Opportunity Analysis

5. Global Market Analysis 2018 to 2022 and Forecast 2023 to 2033, By Category

    5.1. Introduction / Key Findings

    5.2. Historical Market Size Value (US$ million) & Volume (MT) Analysis By Category, 2018 to 2022

    5.3. Current and Future Market Size Value (US$ million) & Volume (MT) Analysis and Forecast By Category, 2023 to 2033

        5.3.1. Single Tap

        5.3.2. Multi-Tap

    5.4. Y-o-Y Growth Trend Analysis By Category, 2018 to 2022

    5.5. Absolute $ Opportunity Analysis By Category, 2023 to 2033

6. Global Market Analysis 2018 to 2022 and Forecast 2023 to 2033, By Size

    6.1. Introduction / Key Findings

    6.2. Historical Market Size Value (US$ million) & Volume (MT) Analysis By Size, 2018 to 2022

    6.3. Current and Future Market Size Value (US$ million) & Volume (MT) Analysis and Forecast By Size, 2023 to 2033

        6.3.1. Mini size

        6.3.2. Full size

    6.4. Y-o-Y Growth Trend Analysis By Size, 2018 to 2022

    6.5. Absolute $ Opportunity Analysis By Size, 2023 to 2033

7. Global Market Analysis 2018 to 2022 and Forecast 2023 to 2033, By End-use

    7.1. Introduction / Key Findings

    7.2. Historical Market Size Value (US$ million) & Volume (MT) Analysis By End-use, 2018 to 2022

    7.3. Current and Future Market Size Value (US$ million) & Volume (MT) Analysis and Forecast By End-use, 2023 to 2033

        7.3.1. Residential

        7.3.2. Commercial

    7.4. Y-o-Y Growth Trend Analysis By End-use, 2018 to 2022

    7.5. Absolute $ Opportunity Analysis By End-use, 2023 to 2033

8. Global Market Analysis 2018 to 2022 and Forecast 2023 to 2033, By Application

    8.1. Introduction / Key Findings

    8.2. Historical Market Size Value (US$ million) & Volume (MT) Analysis By Application, 2018 to 2022

    8.3. Current and Future Market Size Value (US$ million) & Volume (MT) Analysis and Forecast By Application, 2023 to 2033

        8.3.1. Draft Beer

        8.3.2. Wine

        8.3.3. Cold Brew Coffee

        8.3.4. Kombucha

    8.4. Y-o-Y Growth Trend Analysis By Application, 2018 to 2022

    8.5. Absolute $ Opportunity Analysis By Application, 2023 to 2033

9. Global Market Analysis 2018 to 2022 and Forecast 2023 to 2033, By Region

    9.1. Introduction

    9.2. Historical Market Size Value (US$ million) & Volume (MT) Analysis By Region, 2018 to 2022

    9.3. Current Market Size Value (US$ million) & Volume (MT) Analysis and Forecast By Region, 2023 to 2033

        9.3.1. North America

        9.3.2. Latin America

        9.3.3. Europe

        9.3.4. East Asia

        9.3.5. South Asia

        9.3.6. Oceania

        9.3.7. Middle East and Africa (MEA)

    9.4. Market Attractiveness Analysis By Region

10. North America Market Analysis 2018 to 2022 and Forecast 2023 to 2033, By Country

    10.1. Historical Market Size Value (US$ million) & Volume (MT) Trend Analysis By Market Taxonomy, 2018 to 2022

    10.2. Market Size Value (US$ million) & Volume (MT) Forecast By Market Taxonomy, 2023 to 2033

        10.2.1. By Country

            10.2.1.1. The USA

            10.2.1.2. Canada

        10.2.2. By Category

        10.2.3. By Size

        10.2.4. By End-use

        10.2.5. By Application

    10.3. Market Attractiveness Analysis

        10.3.1. By Country

        10.3.2. By Category

        10.3.3. By Size

        10.3.4. By End-use

        10.3.5. By Application

    10.4. Key Takeaways

11. Latin America Market Analysis 2018 to 2022 and Forecast 2023 to 2033, By Country

    11.1. Historical Market Size Value (US$ million) & Volume (MT) Trend Analysis By Market Taxonomy, 2018 to 2022

    11.2. Market Size Value (US$ million) & Volume (MT) Forecast By Market Taxonomy, 2023 to 2033

        11.2.1. By Country

            11.2.1.1. Brazil

            11.2.1.2. Mexico

            11.2.1.3. Argentina

            11.2.1.4. Chile

            11.2.1.5. Peru

            11.2.1.6. Rest of Latin America

        11.2.2. By Category

        11.2.3. By Size

        11.2.4. By End-use

        11.2.5. By Application

    11.3. Market Attractiveness Analysis

        11.3.1. By Country

        11.3.2. By Category

        11.3.3. By Size

        11.3.4. By End-use

        11.3.5. By Application

    11.4. Key Takeaways

12. Europe Market Analysis 2018 to 2022 and Forecast 2023 to 2033, By Country

    12.1. Historical Market Size Value (US$ million) & Volume (MT) Trend Analysis By Market Taxonomy, 2018 to 2022

    12.2. Market Size Value (US$ million) & Volume (MT) Forecast By Market Taxonomy, 2023 to 2033

        12.2.1. By Country

            12.2.1.1. Germany

            12.2.1.2. Italy

            12.2.1.3. France

            12.2.1.4. United Kingdom

            12.2.1.5. Spain

            12.2.1.6. Russia

            12.2.1.7. BENELUX

            12.2.1.8. Poland

            12.2.1.9. Nordic Countries

            12.2.1.10. Rest of Europe

        12.2.2. By Category

        12.2.3. By Size

        12.2.4. By End-use

        12.2.5. By Application

    12.3. Market Attractiveness Analysis

        12.3.1. By Country

        12.3.2. By Category

        12.3.3. By Size

        12.3.4. By End-use

        12.3.5. By Application

    12.4. Key Takeaways

13. East Asia Market Analysis 2018 to 2022 and Forecast 2023 to 2033, By Country

    13.1. Historical Market Size Value (US$ million) & Volume (MT) Trend Analysis By Market Taxonomy, 2018 to 2022

    13.2. Market Size Value (US$ million) & Volume (MT) Forecast By Market Taxonomy, 2023 to 2033

        13.2.1. By Country

            13.2.1.1. China

            13.2.1.2. Japan

            13.2.1.3. South Korea

        13.2.2. By Category

        13.2.3. By Size

        13.2.4. By End-use

        13.2.5. By Application

    13.3. Market Attractiveness Analysis

        13.3.1. By Country

        13.3.2. By Category

        13.3.3. By Size

        13.3.4. By End-use

        13.3.5. By Application

    13.4. Key Takeaways

14. South Asia Market Analysis 2018 to 2022 and Forecast 2023 to 2033, By Country

    14.1. Historical Market Size Value (US$ million) & Volume (MT) Trend Analysis By Market Taxonomy, 2018 to 2022

    14.2. Market Size Value (US$ million) & Volume (MT) Forecast By Market Taxonomy, 2023 to 2033

        14.2.1. By Country

            14.2.1.1. India

            14.2.1.2. Thailand

            14.2.1.3. Malaysia

            14.2.1.4. Indonesia

            14.2.1.5. Singapore

            14.2.1.6. Rest of South Asia

        14.2.2. By Category

        14.2.3. By Size

        14.2.4. By End-use

        14.2.5. By Application

    14.3. Market Attractiveness Analysis

        14.3.1. By Country

        14.3.2. By Category

        14.3.3. By Size

        14.3.4. By End-use

        14.3.5. By Application

    14.4. Key Takeaways

15. Oceania Market Analysis 2018 to 2022 and Forecast 2023 to 2033, By Country

    15.1. Historical Market Size Value (US$ million) & Volume (MT) Trend Analysis By Market Taxonomy, 2018 to 2022

    15.2. Market Size Value (US$ million) & Volume (MT) Forecast By Market Taxonomy, 2023 to 2033

        15.2.1. By Country

            15.2.1.1. Australia

            15.2.1.2. New Zealand

        15.2.2. By Category

        15.2.3. By Size

        15.2.4. By End-use

        15.2.5. By Application

    15.3. Market Attractiveness Analysis

        15.3.1. By Country

        15.3.2. By Category

        15.3.3. By Size

        15.3.4. By End-use

        15.3.5. By Application

    15.4. Key Takeaways

16. MEA Market Analysis 2018 to 2022 and Forecast 2023 to 2033, By Country

    16.1. Historical Market Size Value (US$ million) & Volume (MT) Trend Analysis By Market Taxonomy, 2018 to 2022

    16.2. Market Size Value (US$ million) & Volume (MT) Forecast By Market Taxonomy, 2023 to 2033

        16.2.1. By Country

            16.2.1.1. GCC Countries

            16.2.1.2. South Africa

            16.2.1.3. Central Africa

            16.2.1.4. North Africa

        16.2.2. By Category

        16.2.3. By Size

        16.2.4. By End-use

        16.2.5. By Application

    16.3. Market Attractiveness Analysis

        16.3.1. By Country

        16.3.2. By Category

        16.3.3. By Size

        16.3.4. By End-use

        16.3.5. By Application

    16.4. Key Takeaways

17. Key Countries Market Analysis

    17.1. The USA

        17.1.1. Pricing Analysis

        17.1.2. Market Share Analysis, 2022

            17.1.2.1. By Category

            17.1.2.2. By Size

            17.1.2.3. By End-use

            17.1.2.4. By Application

    17.2. Canada

        17.2.1. Pricing Analysis

        17.2.2. Market Share Analysis, 2022

            17.2.2.1. By Category

            17.2.2.2. By Size

            17.2.2.3. By End-use

            17.2.2.4. By Application

    17.3. Brazil

        17.3.1. Pricing Analysis

        17.3.2. Market Share Analysis, 2022

            17.3.2.1. By Category

            17.3.2.2. By Size

            17.3.2.3. By End-use

            17.3.2.4. By Application

    17.4. Mexico

        17.4.1. Pricing Analysis

        17.4.2. Market Share Analysis, 2022

            17.4.2.1. By Category

            17.4.2.2. By Size

            17.4.2.3. By End-use

            17.4.2.4. By Application

    17.5. Argentina

        17.5.1. Pricing Analysis

        17.5.2. Market Share Analysis, 2022

            17.5.2.1. By Category

            17.5.2.2. By Size

            17.5.2.3. By End-use

            17.5.2.4. By Application

    17.6. Chile

        17.6.1. Pricing Analysis

        17.6.2. Market Share Analysis, 2022

            17.6.2.1. By Category

            17.6.2.2. By Size

            17.6.2.3. By End-use

            17.6.2.4. By Application

    17.7. Peru

        17.7.1. Pricing Analysis

        17.7.2. Market Share Analysis, 2022

            17.7.2.1. By Category

            17.7.2.2. By Size

            17.7.2.3. By End-use

            17.7.2.4. By Application

    17.8. Germany

        17.8.1. Pricing Analysis

        17.8.2. Market Share Analysis, 2022

            17.8.2.1. By Category

            17.8.2.2. By Size

            17.8.2.3. By End-use

            17.8.2.4. By Application

    17.9. Italy

        17.9.1. Pricing Analysis

        17.9.2. Market Share Analysis, 2022

            17.9.2.1. By Category

            17.9.2.2. By Size

            17.9.2.3. By End-use

            17.9.2.4. By Application

    17.10. France

        17.10.1. Pricing Analysis

        17.10.2. Market Share Analysis, 2022

            17.10.2.1. By Category

            17.10.2.2. By Size

            17.10.2.3. By End-use

            17.10.2.4. By Application

    17.11. Spain

        17.11.1. Pricing Analysis

        17.11.2. Market Share Analysis, 2022

            17.11.2.1. By Category

            17.11.2.2. By Size

            17.11.2.3. By End-use

            17.11.2.4. By Application

    17.12. United Kingdom

        17.12.1. Pricing Analysis

        17.12.2. Market Share Analysis, 2022

            17.12.2.1. By Category

            17.12.2.2. By Size

            17.12.2.3. By End-use

            17.12.2.4. By Application

    17.13. Russia

        17.13.1. Pricing Analysis

        17.13.2. Market Share Analysis, 2022

            17.13.2.1. By Category

            17.13.2.2. By Size

            17.13.2.3. By End-use

            17.13.2.4. By Application

    17.14. Poland

        17.14.1. Pricing Analysis

        17.14.2. Market Share Analysis, 2022

            17.14.2.1. By Category

            17.14.2.2. By Size

            17.14.2.3. By End-use

            17.14.2.4. By Application

    17.15. BENELUX

        17.15.1. Pricing Analysis

        17.15.2. Market Share Analysis, 2022

            17.15.2.1. By Category

            17.15.2.2. By Size

            17.15.2.3. By End-use

            17.15.2.4. By Application

    17.16. Nordic Countries

        17.16.1. Pricing Analysis

        17.16.2. Market Share Analysis, 2022

            17.16.2.1. By Category

            17.16.2.2. By Size

            17.16.2.3. By End-use

            17.16.2.4. By Application

    17.17. China

        17.17.1. Pricing Analysis

        17.17.2. Market Share Analysis, 2022

            17.17.2.1. By Category

            17.17.2.2. By Size

            17.17.2.3. By End-use

            17.17.2.4. By Application

    17.18. Japan

        17.18.1. Pricing Analysis

        17.18.2. Market Share Analysis, 2022

            17.18.2.1. By Category

            17.18.2.2. By Size

            17.18.2.3. By End-use

            17.18.2.4. By Application

    17.19. South Korea

        17.19.1. Pricing Analysis

        17.19.2. Market Share Analysis, 2022

            17.19.2.1. By Category

            17.19.2.2. By Size

            17.19.2.3. By End-use

            17.19.2.4. By Application

    17.20. India

        17.20.1. Pricing Analysis

        17.20.2. Market Share Analysis, 2022

            17.20.2.1. By Category

            17.20.2.2. By Size

            17.20.2.3. By End-use

            17.20.2.4. By Application

    17.21. Thailand

        17.21.1. Pricing Analysis

        17.21.2. Market Share Analysis, 2022

            17.21.2.1. By Category

            17.21.2.2. By Size

            17.21.2.3. By End-use

            17.21.2.4. By Application

    17.22. Indonesia

        17.22.1. Pricing Analysis

        17.22.2. Market Share Analysis, 2022

            17.22.2.1. By Category

            17.22.2.2. By Size

            17.22.2.3. By End-use

            17.22.2.4. By Application

    17.23. Malaysia

        17.23.1. Pricing Analysis

        17.23.2. Market Share Analysis, 2022

            17.23.2.1. By Category

            17.23.2.2. By Size

            17.23.2.3. By End-use

            17.23.2.4. By Application

    17.24. Singapore

        17.24.1. Pricing Analysis

        17.24.2. Market Share Analysis, 2022

            17.24.2.1. By Category

            17.24.2.2. By Size

            17.24.2.3. By End-use

            17.24.2.4. By Application

    17.25. Australia

        17.25.1. Pricing Analysis

        17.25.2. Market Share Analysis, 2022

            17.25.2.1. By Category

            17.25.2.2. By Size

            17.25.2.3. By End-use

            17.25.2.4. By Application

    17.26. New Zealand

        17.26.1. Pricing Analysis

        17.26.2. Market Share Analysis, 2022

            17.26.2.1. By Category

            17.26.2.2. By Size

            17.26.2.3. By End-use

            17.26.2.4. By Application

    17.27. GCC Countries

        17.27.1. Pricing Analysis

        17.27.2. Market Share Analysis, 2022

            17.27.2.1. By Category

            17.27.2.2. By Size

            17.27.2.3. By End-use

            17.27.2.4. By Application

    17.28. South Africa

        17.28.1. Pricing Analysis

        17.28.2. Market Share Analysis, 2022

            17.28.2.1. By Category

            17.28.2.2. By Size

            17.28.2.3. By End-use

            17.28.2.4. By Application

    17.29. North Africa

        17.29.1. Pricing Analysis

        17.29.2. Market Share Analysis, 2022

            17.29.2.1. By Category

            17.29.2.2. By Size

            17.29.2.3. By End-use

            17.29.2.4. By Application

    17.30. Central Africa

        17.30.1. Pricing Analysis

        17.30.2. Market Share Analysis, 2022

            17.30.2.1. By Category

            17.30.2.2. By Size

            17.30.2.3. By End-use

            17.30.2.4. By Application

18. Market Structure Analysis

    18.1. Competition Dashboard

    18.2. Competition Benchmarking

    18.3. Market Share Analysis of Top Players

        18.3.1. By Regional

        18.3.2. By Category

        18.3.3. By Size

        18.3.4. By End-use

        18.3.5. By Application

19. Competition Analysis

    19.1. Competition Deep Dive

        19.1.1. Danby

            19.1.1.1. Overview

            19.1.1.2. Product Portfolio

            19.1.1.3. Profitability by Market Segments (Category/Size/End-use/Application/Region)

            19.1.1.4. Sales Footprint

            19.1.1.5. Strategy Overview

                19.1.1.5.1. Marketing Strategy

                19.1.1.5.2. Product Strategy

                19.1.1.5.3. Channel Strategy

        19.1.2. Nostalgia Products

            19.1.2.1. Overview

            19.1.2.2. Product Portfolio

            19.1.2.3. Profitability by Market Segments (Category/Size/End-use/Application/Region)

            19.1.2.4. Sales Footprint

            19.1.2.5. Strategy Overview

                19.1.2.5.1. Marketing Strategy

                19.1.2.5.2. Product Strategy

                19.1.2.5.3. Channel Strategy

        19.1.3. Felix Storch

            19.1.3.1. Overview

            19.1.3.2. Product Portfolio

            19.1.3.3. Profitability by Market Segments (Category/Size/End-use/Application/Region)

            19.1.3.4. Sales Footprint

            19.1.3.5. Strategy Overview

                19.1.3.5.1. Marketing Strategy

                19.1.3.5.2. Product Strategy

                19.1.3.5.3. Channel Strategy

        19.1.4. Living Direct

            19.1.4.1. Overview

            19.1.4.2. Product Portfolio

            19.1.4.3. Profitability by Market Segments (Category/Size/End-use/Application/Region)

            19.1.4.4. Sales Footprint

            19.1.4.5. Strategy Overview

                19.1.4.5.1. Marketing Strategy

                19.1.4.5.2. Product Strategy

                19.1.4.5.3. Channel Strategy

        19.1.5. US Cooler

            19.1.5.1. Overview

            19.1.5.2. Product Portfolio

            19.1.5.3. Profitability by Market Segments (Category/Size/End-use/Application/Region)

            19.1.5.4. Sales Footprint

            19.1.5.5. Strategy Overview

                19.1.5.5.1. Marketing Strategy

                19.1.5.5.2. Product Strategy

                19.1.5.5.3. Channel Strategy

        19.1.6. Kegco

            19.1.6.1. Overview

            19.1.6.2. Product Portfolio

            19.1.6.3. Profitability by Market Segments (Category/Size/End-use/Application/Region)

            19.1.6.4. Sales Footprint

            19.1.6.5. Strategy Overview

                19.1.6.5.1. Marketing Strategy

                19.1.6.5.2. Product Strategy

                19.1.6.5.3. Channel Strategy

        19.1.7. Avanti Products (Croda International Inc.)

            19.1.7.1. Overview

            19.1.7.2. Product Portfolio

            19.1.7.3. Profitability by Market Segments (Category/Size/End-use/Application/Region)

            19.1.7.4. Sales Footprint

            19.1.7.5. Strategy Overview

                19.1.7.5.1. Marketing Strategy

                19.1.7.5.2. Product Strategy

                19.1.7.5.3. Channel Strategy

        19.1.8. Krups

            19.1.8.1. Overview

            19.1.8.2. Product Portfolio

            19.1.8.3. Profitability by Market Segments (Category/Size/End-use/Application/Region)

            19.1.8.4. Sales Footprint

            19.1.8.5. Strategy Overview

                19.1.8.5.1. Marketing Strategy

                19.1.8.5.2. Product Strategy

                19.1.8.5.3. Channel Strategy

        19.1.9. Versonel

            19.1.9.1. Overview

            19.1.9.2. Product Portfolio

            19.1.9.3. Profitability by Market Segments (Category/Size/End-use/Application/Region)

            19.1.9.4. Sales Footprint

            19.1.9.5. Strategy Overview

                19.1.9.5.1. Marketing Strategy

                19.1.9.5.2. Product Strategy

                19.1.9.5.3. Channel Strategy

        19.1.10. Haier Group Corporation

            19.1.10.1. Overview

            19.1.10.2. Product Portfolio

            19.1.10.3. Profitability by Market Segments (Category/Size/End-use/Application/Region)

            19.1.10.4. Sales Footprint

            19.1.10.5. Strategy Overview

                19.1.10.5.1. Marketing Strategy

                19.1.10.5.2. Product Strategy

                19.1.10.5.3. Channel Strategy

        19.1.11. DCS by Fisher & Paykel Appliances

            19.1.11.1. Overview

            19.1.11.2. Product Portfolio

            19.1.11.3. Profitability by Market Segments (Category/Size/End-use/Application/Region)

            19.1.11.4. Sales Footprint

            19.1.11.5. Strategy Overview

                19.1.11.5.1. Marketing Strategy

                19.1.11.5.2. Product Strategy

                19.1.11.5.3. Channel Strategy

        19.1.12. Cydea Inc

            19.1.12.1. Overview

            19.1.12.2. Product Portfolio

            19.1.12.3. Profitability by Market Segments (Category/Size/End-use/Application/Region)

            19.1.12.4. Sales Footprint

            19.1.12.5. Strategy Overview

                19.1.12.5.1. Marketing Strategy

                19.1.12.5.2. Product Strategy

                19.1.12.5.3. Channel Strategy

20. Assumptions & Acronyms Used

21. Research Methodology

Explore Process Automation Insights

View Reports
Future Market Insights

Kegerator Equipment Market