
- Market Size (2026)
- USD 87.4 Bn
- Forecast (2036)
- USD 222.7 Bn
- CAGR (2026 to 2036)
- 9.8%
How big is Key Opinion Leader Management Market in 2026?
The global key opinion leader management market is estimated at USD 79.6 billion in 2025 and is expected to reach USD 87.4 billion in 2026. Growth of the key opinion leader management market is expected to continue at a CAGR of 9.8% between 2026 and 2036, raising sales to USD 222.7 billion by 2036. FMI analysis puts KOL management software in the lead, with an expected 53.4% of 2026 solution sales.
Demand for key opinion leader management is rising with new drug launches, as each new therapy needs a mapped network of expert physicians before the drug reaches the market. Approval data show the pace of launches, as the US Food and Drug Administration approved 46 novel drugs in 2025, according to the FDA Center for Drug Evaluation and Research. Consequently, sponsors keep adding advisory boards, speaker programs and investigator networks. Sales of engagement tools also benefit from frequent paid contact between companies and clinicians. Companies reported USD 14.67 billion in payments and ownership interests to US clinicians and teaching hospitals for program year 2025. Adoption of AI inside expert workflows is spreading across the largest CRM vendors. A case in point is Veeva Systems, which released AI agents for Vault CRM on December 3, 2025, and planned further agents for medical teams across 2026. FMI analysis finds that agent tools shorten preparation for each expert meeting, which favours suppliers with large installed CRM bases.
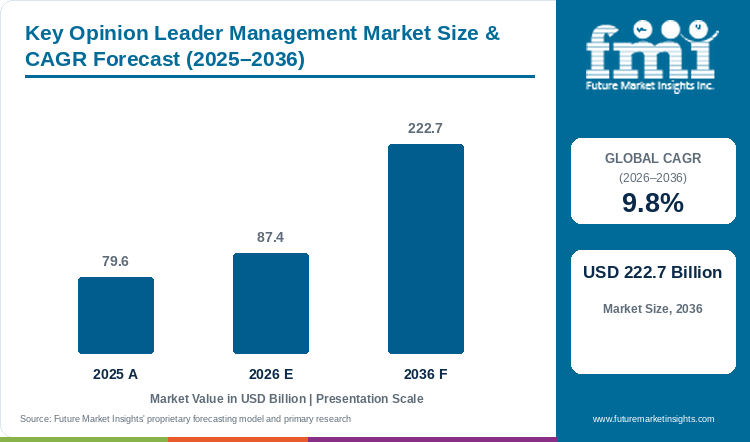
Table 1: Key Opinion Leader Management Market Size and Forecast (USD billion), 2025 to 2036
| Market size and forecast | Value |
|---|---|
| 2025 market size | USD 79.6 billion |
| Estimated market size in 2026 | USD 87.4 billion |
| Projected market size by 2036 | USD 222.7 billion |
| CAGR (2026 to 2036) | 9.8% |
| Added sales, 2026 to 2036 | USD 135.3 billion |
Key Market Trends & Insights
- By solution: Use of KOL management software is set to account for 53.4% of 2026 sales, as medical teams want expert profiles, interaction history and compliance checks inside one controlled system.
- By practice field: Buyer preference for oncology programs gives the field an estimated 35% of 2026 sales, given that each cancer program draws on many trial sites, tumour boards and advisors.
- By end user: At 47.6% of 2026 sales, pharma and biotech companies form the largest buyer group, since drug sponsors run most advisory boards, speaker programs and investigator networks.
Regional Highlights
- Fastest-growing country: China is expected to grow the fastest among profiled countries, at a projected CAGR of 6.5% between 2026 and 2036, as domestic drug innovation adds new sponsors that need expert programs.
- Growth across other countries: India is projected to expand at a CAGR of 5.8%, ahead of Spain at 3.5% and France at 2.6%. The United Kingdom is likely to reach 2.1%, and the United States is set to grow slowest, at a CAGR of 1.7%.
Expert clinicians are at the centre of this market, and the United States has a large number of clinicians who work with industry. CMS lists 667,898 physicians and 362,261 non-physician practitioners with payment entries for program year 2025. A pool of this size gives sponsors many candidate experts, so the harder task becomes ranking influence and avoiding overlap between brands. Service capacity is expanding in parallel, as Indegene reported FY26 revenue of INR 35,105 million, up 23.6% in rupee terms, from commercial, medical, R&D and safety operations for life sciences clients. Larger outsourced teams give mid-sized drug makers access to expert mapping without building in-house medical operations groups.
Demand from large sponsors for engagement software stays firm as CRM contracts move to new platforms. Veeva Systems reported total revenues of USD 928.0 million for the quarter ended July 31, 2026, up 18% year over year. Growth at this pace shows sponsors renewing and widening CRM contracts. Meanwhile, CRM migration is concentrating demand on fewer platforms at the largest sponsors. Vault CRM had more than 180 customers live, and top 20 biopharma commitments reached 12 globally. As a result, when large sponsors standardise on one CRM platform, switching costs rise and stand-alone KOL tools have less room to compete.
Regulation is reshaping launch calendars, and launch calendars in turn shape expert engagement plans. The Council of the European Union adopted the Pharma Package in 2026, after co-legislators reached a provisional agreement in December 2025. New EU rules on regulatory protection and medicine availability will alter launch sequencing, so medical teams will need fresh expert maps by member state. Launch volumes in Asia are also rising fast, as China's National Medical Products Administration approved 76 innovative drugs in 2025, up from 48 in 2024. Consequently, more domestic launches will widen the base of Chinese sponsors that need structured expert engagement.
Table 2: Supporting Industry Indicators for the Key Opinion Leader Management Market, 2025 to 2026
| Indicator | Data point | Why it matters | Source |
|---|---|---|---|
| Novel drug approvals, United States | 46 novel drugs approved by CDER in 2025 | Each launch creates new advisory, speaker and investigator programs | |
| Industry payments to clinicians | USD 14.67 billion across 17.07 million payment entries, program year 2025 | Sets the scale of paid expert interaction in the largest pharma market | |
| Payment mix | General payments USD 3.92 billion; research payments USD 9.50 billion, program year 2025 | Research ties dominate expert relationships, favouring trial-linked KOL tools | |
| Engaged clinician pool | 667,898 physicians and 1,833 paying companies, program year 2025 | Wide expert pools raise the value of profiling and ranking software | |
| Cancer burden, United States | 2,114,850 new cancer diagnoses projected for 2026 | Supports oncology as the largest practice field | |
| Platform supplier results | Veeva Systems total revenues USD 928.0 million, up 18%, quarter ended July 31, 2026 | Shows continued sponsor investment in engagement software | |
| CRM migration | Vault CRM above 180 customers live; 12 top 20 biopharma commitments, 2026 | Concentrates engagement data on fewer platforms | |
| AI agent release | Veeva AI Agents for Vault CRM available from December 3, 2025 | Cuts preparation time for field and medical teams | |
| Services supplier results | Indegene FY26 revenue INR 35,105 million, up 23.6% in rupee terms | Signals outsourcing of medical and commercial operations | |
| Innovative drug approvals, China | 76 approvals in 2025 against 48 in 2024 | Widens the sponsor base for expert programs in China | |
| EU pharmaceutical rules | Council adoption of the Pharma Package in 2026, after a December 2025 provisional deal | Changes launch timing and expert planning across Europe |
Demand Intensity Analysis
Key drivers of the key opinion leader management market show up first in industry payment data, which give the closest outside benchmark. CMS data show USD 14.67 billion in payments and ownership interests to US clinicians and teaching hospitals for program year 2025. Against that total, the key opinion leader management market is estimated at USD 79.6 billion in 2025, about 5.4 times the payment figure. Scope differs sharply, as the CMS total covers transfers in one country, and the market estimate covers software, services and engagement programs in every region. The multiple suggests that most market value lies in managing expert relationships, well beyond direct payments to clinicians.
Pharma and biotech sponsors hold the largest end-user share, so that segment gives a sharper comparison. With a 47.6% share of 2026 sales, sponsor demand comes to about USD 41.6 billion. General payments reached USD 3.92 billion and research payments USD 9.50 billion in program year 2025. The sponsor segment therefore equals about 10.6 times general payments and 4.4 times research payments, although the comparison spans different years and a single country. For suppliers, the gap shows that expert network management carries far more value than the fees paid to physicians.
Results from listed vendors offer a check on growth of the key opinion leader management market. Veeva Systems reported subscription revenues of USD 766.8 million for the quarter ended July 31, 2026, up 16% year over year. Subscription growth at this pace runs 6.2 percentage points above the market CAGR. Similarly, Indegene reported FY26 revenue growth of 18.2% in US dollar terms, 8.4 points above the market rate. Leading suppliers are thus gaining share faster than the market expands, and the forecast assumes slower supplier growth once large sponsors finish CRM migrations.
The number of clinicians who work with industry gives a physical benchmark for the estimate, since each expert relationship carries program costs. Program year 2025 data list 667,898 US physicians with payment entries. Dividing the 2025 market estimate by that count gives about USD 119,200 per physician, an overstatement, as the market covers all countries and the physician count covers only the United States. Oncology offers a second benchmark, as the American Cancer Society projects 2,114,850 new cancer diagnoses in the United States in 2026. At 35% of the 2026 market, oncology is estimated at about USD 30.6 billion, roughly USD 14,460 per projected US diagnosis. Both ratios indicate that engagement value concentrates in complex therapy areas, which favours suppliers holding oncology expert maps.
Table 3: Demand Intensity Metrics for the Key Opinion Leader Management Market, 2025 and 2026 Data Against 2025 and 2026 Market Values
| Demand intensity metric | Value | Basis |
|---|---|---|
| Open Payments total value, program year 2025 | USD 14.67 billion | Centers for Medicare & Medicaid Services, program year 2025 payments and ownership interests |
| Market value as a multiple of the Open Payments total | 5.4 times | Calculated from CMS program year 2025 data and the 2025 market value |
| General payments, program year 2025 | USD 3.92 billion | Centers for Medicare & Medicaid Services, program year 2025 |
| Pharma and biotech segment value as a multiple of general payments | 10.6 times | Calculated from CMS data and the 2026 market value at a 47.6% segment share |
| Veeva Systems subscription revenue growth | 16% | Veeva Systems, quarter ended July 31, 2026 |
| Gap between Veeva subscription growth and the market CAGR | 6.2 percentage points | Calculated from Veeva Systems results and the 2026 to 2036 market CAGR |
| US physicians with payment entries | 667,898 | Centers for Medicare & Medicaid Services, program year 2025 |
| Market value per US physician with payment entries | About USD 119,200 | Calculated from CMS data and the 2025 market value |
| Projected US new cancer diagnoses | 2,114,850 | American Cancer Society, 2026 projection |
| Oncology segment value per projected US diagnosis | About USD 14,460 | Calculated from American Cancer Society data and the 2026 market value at a 35% oncology share |
Analyst Perspective
“Key opinion leader management is shifting from contact lists to intelligence on scientific influence. Sponsors want to know which experts shape treatment choices in each tumour type and country, and AI tools now make that mapping faster. Suppliers that pair clean expert data with compliant engagement workflows will secure the larger contracts through 2036.”
- Anurag Sharma, Principal Consultant, Future Market Insights.
How is the key opinion leader management market segmented?
The market is segmented into solution, practice field, end user, and region. KOL management software is expected to lead solution with 53.4% share in 2026, and oncology leads practice field with an estimated 35%.
By solution: KOL management software, covering cloud and web based platforms and on premises installations, and services, covering professional services and outsourced KOL engagement services.
By practice field: oncology, cardiology, obstetrics and gynecology, orthopedics, dentistry, neurology, and others.
By end user: pharma and biotech companies, medical device manufacturers, healthcare service providers, research organizations, and others.
By region: medical affairs and commercial teams in North America, Latin America, Western Europe, Eastern Europe, East Asia, South Asia and Pacific, and Middle East and Africa.
Why does KOL management software lead the solution segment?
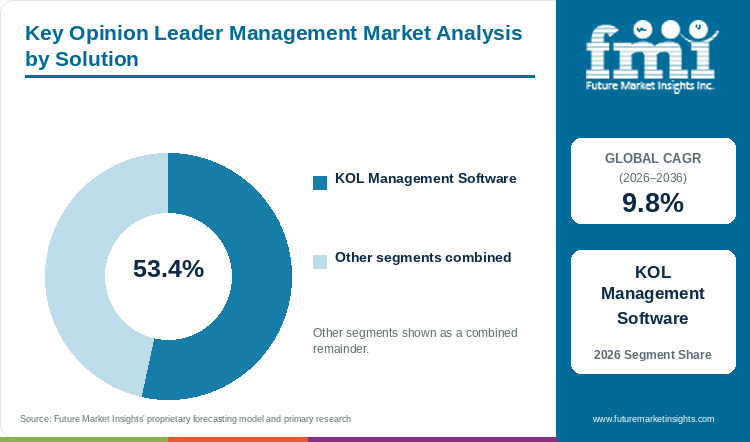
KOL management software is expected to lead solution sales with 53.4% share in 2026, ahead of services at an estimated 46.6%.
Table 4: Solution Share for the Key Opinion Leader Management Market (percentage share), 2026
| Solution | Estimated Share (2026) |
|---|---|
| KOL Management Software | 53.4% |
| Services | 46.6% |
| Total | 100.0% |
Table 5: Solution Leadership and Market Growth for the Key Opinion Leader Management Market (segment and CAGR percentage), 2026 to 2036
| Metric | Value |
|---|---|
| Global CAGR (2026 to 2036) | 9.8% |
| Leading Segment | KOL Management Software |
Sponsors want expert profiles, engagement history and fee checks in one governed system, so KOL management software is expected to hold 53.4% of 2026 sales. Services stay close behind at 46.6%, as many mid-sized sponsors outsource expert identification and advisory board logistics. Software vendors are adding automation to widen that gap. Veeva Systems made Free Text, Voice and Pre-call agents for Vault CRM available on December 3, 2025. AI agents that prepare each expert meeting cut manual work, so budgets shift from service hours toward licences. Analytics budgets point the same way, with the life sciences analytics market set to grow at a 9.1% CAGR through 2035. FMI expects software to keep the lead through 2036 as AI features move into medical workflows.
- Cloud and web based platforms and on premises installations make up the software segment.
- Large sponsors are moving onto fewer platforms, and Vault CRM had more than 180 customers live by the quarter ended July 31, 2026. Each migration requires a new setup of expert data, which creates openings for add-on KOL modules.
Why does oncology lead the practice field segment?
Oncology is expected to lead practice field sales with 35% share in 2026, ahead of cardiology at an estimated 18.6%.
Table 6: Practice Field Share for the Key Opinion Leader Management Market (percentage share), 2026
| Practice Field | Estimated Share (2026) |
|---|---|
| Oncology | 35% |
| Cardiology | 18.6% |
| Neurology | 14.2% |
| Orthopedics | 10.4% |
| Obstetrics and Gynecology | 8.3% |
| Dentistry | 5.1% |
| Others | 8.4% |
| Total | 100.0% |
Cancer care spans many sub-specialties, frequent trial readouts and fast-changing guidelines, so oncology is estimated at 35% of 2026 sales. Cardiology, at about 18.6%, relies on large outcome trials and guideline committees, and neurology holds 14.2%. Orthopedics, obstetrics and gynecology, dentistry and other fields share the remaining 32.2%. Disease burden supports the oncology lead, as the American Cancer Society projects 2,114,850 new cancer diagnoses in the United States in 2026. A patient base of this size sustains dense networks of oncologists, investigators and tumour board experts for sponsors to map. Trial activity adds weight, with the clinical trial market projected to reach USD 200.9 billion by 2036. Oncology is likely to remain the largest field through 2036, as new cancer therapies keep adding expert networks.
- Solid tumour, blood cancer and cell and gene therapy programs make up the oncology segment.
- Survival gains add complexity to cancer care, and the American Cancer Society reported a 70% five-year relative survival rate for all cancers combined in January 2026. Longer survival extends treatment lines, which raises the number of expert opinions sponsors seek per tumour type.
Why do pharma and biotech companies lead the end user segment?
Pharma and biotech companies are expected to lead end user sales with 47.6% share in 2026, ahead of medical device manufacturers at an estimated 21.8%.
Table 7: End User Share for the Key Opinion Leader Management Market (percentage share), 2026
| End User | Estimated Share (2026) |
|---|---|
| Pharma and Biotech Companies | 47.6% |
| Medical Device Manufacturers | 21.8% |
| Healthcare Service Providers | 14.3% |
| Research Organizations | 10.2% |
| Others | 6.1% |
| Total | 100.0% |
Demand for expert programs is largest among drug sponsors, which run advisory boards, investigator networks and medical education at scale, so pharma and biotech companies are estimated at 47.6% of 2026 sales. Medical device manufacturers, at about 21.8%, engage operating and interventional specialists for training and design input. Healthcare service providers at 14.3% and research organizations at 10.2% apply KOL tools to trial recruitment and partnership planning. China adds momentum to the drug sponsor group, as the National Medical Products Administration approved 76 innovative drugs in 2025, against 48 in 2024, Xinhua reported in May 2026. Each new domestic sponsor needs expert programs at home and abroad, and FMI expects pharma and biotech buyers to keep the lead through 2036.
- Buyers of KOL tools in this segment include large pharma groups, specialty drug makers and emerging biotech sponsors.
- Outsourcing partners serve many of the largest sponsors, and Indegene counted 53 clients contributing over USD 1 million in annual revenue in April 2026. A large group of big clients shows that drug makers are handing expert engagement tasks to specialist operators.
What are the drivers, restraints, and opportunities in the key opinion leader management market?
New therapy launches and growing medical affairs teams push sponsors toward structured expert engagement. Compliance workloads slow smaller programs, and AI tools inside CRM platforms open new ways to find and rank experts.
- Driver: Steady drug launches keep sponsors building advisory boards, speaker programs and investigator networks, which raises the need for systems that map and rank experts.
- Restraint: Reporting duties and transparency rules add cost to every paid interaction with clinicians, which slows new programs at smaller sponsors.
- Opportunity: AI agents inside CRM and medical platforms can automate expert profiling and meeting preparation, which opens upgrade sales across the installed base.
Launch Volumes Keep Expert Programs Busy
Every new therapy adds demand for key opinion leader management, as each launch needs advisors, trial investigators and peer educators. The US Food and Drug Administration approved 46 novel drugs in 2025. A steady approval count keeps sponsors renewing expert programs year after year. Payment data show how closely expert engagement is tied to the drug pipeline. Research payments reached USD 9.50 billion in program year 2025, more than double general payments of USD 3.92 billion. Trial-linked engagement of this size rewards software that connects investigators with medical plans.
Compliance Workloads Raise the Cost of Engagement
Reporting duties raise the prices of expert programs, as every paid interaction with a clinician adds administrative cost. Open Payments data for program year 2025 covered 17.07 million payment entries from 1,833 companies. Data volumes of this size require clean identity matching and audit logs, which smaller sponsors find hard to fund. Safety duties grow alongside, as the pharmacovigilance market is forecast to reach USD 22.8 billion by 2036 at an 8.8% CAGR. European rules add a further workload, as the Council of the European Union adopted the Pharma Package in 2026, and each member state will need to write the directive into national law. Work on national rules will occupy medical and regulatory teams, so some new engagement programs may wait until national rules settle.
AI Agents Open Room for Smarter Expert Mapping
AI agents within CRM platforms create the largest near-term opportunity for suppliers. Veeva Systems said additional AI agents for clinical, regulatory, safety, quality, medical and commercial teams would be released throughout 2026. Agents for medical teams could automate publication reviews and expert profiling, which shifts KOL work from manual searching to analysis guided by software. Early commercial results support the case, as Veeva CEO Peter Gassner described the quarter ended July 31, 2026 as the best ever for Vault CRM. Healthcare digitisation widens the field, with the digital transformation in healthcare market forecast to reach USD 381.5 billion by 2036. Suppliers with embedded expert data will capture the first gains from these AI features.
Which country CAGRs are profiled in the key opinion leader management market?
Table 8: Country CAGR Comparison for the Key Opinion Leader Management Market (CAGR percentage), 2026 to 2036
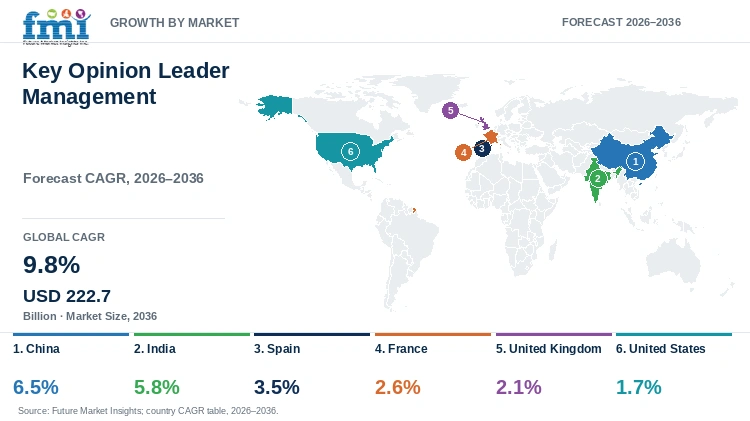
| Country | CAGR |
|---|---|
| China | 6.5% |
| India | 5.8% |
| Spain | 3.5% |
| France | 2.6% |
| United Kingdom | 2.1% |
| United States | 1.7% |
How do country-level CAGRs compare in the key opinion leader management market?
FMI projects China at a 6.5% CAGR, the fastest of the profiled countries, as domestic innovation adds new sponsors. India is second at 5.8%, as global sponsors expand medical operations in Indian hubs. Growth in Europe is moderate, with Spain at 3.5%, France at 2.6% and the United Kingdom at 2.1%. The United States is lowest at 1.7%, as most sponsors already use KOL tools, so growth comes from replacement and AI upgrades. None of the six profiled countries reaches the 9.8% global rate, so the faster growth comes from countries shown in the regional tables. Emerging pharma hubs in Asia, Latin America and the Middle East lead that growth from small bases.
- Demand for expert mapping in India rises as capability centres and service providers hire medical operations staff, which gives suppliers a delivery base for global contracts.
- Chinese sponsors launching first-in-class drugs need advisory boards at home and abroad, so vendors with bilingual expert databases gain an edge.
- Use of investigator mapping stays steady in Spain, as hospital-based trial networks favour suppliers with regional medical data.
- Buyer preference in France leans toward platforms with built-in compliance checks, as sponsors operate under strict public transparency rules on links with health professionals.
- In the United Kingdom, academic centres are at the heart of expert networks, and existing users buy upgrades more often than new systems.
- Sales of KOL tools in the United States depend on platform replacement and AI add-ons, since most large sponsors already run KOL tools.
Full report country CAGRs cover: six profiled rates running from China at 6.5% down to the United States at 1.7%, with regional tables listing every other standard country.
Country-wise Analysis
India Key Opinion Leader Management Market Outlook (2026 to 2036)
India is building a deep pool of life sciences operations talent, and local service providers are scaling quickly. Indegene, based in Bengaluru, reported Q4 FY26 revenue of INR 10,034 million on April 29, 2026, up 32.8% year over year. Faster growth among Indian providers expands delivery capacity for expert mapping and medical content. On this basis FMI sees India expanding at a 5.8% CAGR, second among the six profiled countries.
Key takeaway: Sales of expert mapping services in India will come mostly from global sponsors that place medical operations teams there to serve global contracts.
China Key Opinion Leader Management Market Outlook (2026 to 2036)
Use of expert engagement tools is widening in China as domestic drug innovation creates new sponsors. Xinhua reported in May 2026 that overseas out-licensing deals for Chinese innovative drugs exceeded USD 130 billion in 2025. Licensed assets need expert input in partner markets, which adds cross-border advisory work for Chinese sponsors. With this cross-border expert work, China is expected to grow at a 6.5% CAGR, the fastest among profiled countries.
Key takeaway: Chinese drug sponsors that license assets abroad will buy more expert engagement services, favouring vendors able to work with both domestic and Western networks.
Spain Key Opinion Leader Management Market Outlook (2026 to 2036)
Spanish hospitals run dense clinical trial site networks, which keeps investigator mapping in steady use. EU rule changes add a planning task, as the Council of the European Union adopted the Pharma Package in 2026. Spanish medical teams will therefore revisit launch plans and expert programs as national rules are written. Spain is set for a 3.5% CAGR, the strongest rate among the three European countries.
Key takeaway: Adoption of investigator mapping in Spain will stay steady as hospitals run many trial sites, although the EU rule change may delay some new programs.
France Key Opinion Leader Management Market Outlook (2026 to 2036)
French sponsors work under strict public transparency rules for links with health professionals, which shapes how expert programs are designed. Compliance features therefore weigh heavily when French buyers select a platform. France is projected to grow at a 2.6% CAGR, supported by oncology and rare disease launches.
Key takeaway: French sponsors will choose KOL platforms mainly on compliance strength, since strict transparency rules matter more to them than price.
United Kingdom Key Opinion Leader Management Market Outlook (2026 to 2036)
The United Kingdom has a mature base of KOL software users among large sponsors, so new contracts often replace older systems. AI features give buyers a reason to upgrade, with Veeva Systems releasing Vault CRM agents in December 2025. These upgrades raise the value of each contract but add few new users. FMI places British growth at a 2.1% CAGR, driven more by higher value per contract than by new accounts.
Key takeaway: In the United Kingdom, most new sales will come from large sponsors upgrading existing KOL software, more than from first-time buyers.
United States Key Opinion Leader Management Market Outlook (2026 to 2036)
American sponsors run the most mature KOL programs, and payment data show the scale of expert engagement in the United States. Companies made payments to 667,898 physicians and 1,327 teaching hospitals in program year 2025. With so many existing users, growth will come from software replacement and AI add-ons more than from new programs. FMI projects a 1.7% CAGR for the United States, the slowest among profiled countries.
Key takeaway: Large US sponsors already run KOL tools, so growth will be slow, although the country remains the largest pool of expert relationships for suppliers.
Who are the notable companies in the key opinion leader management market?
Fourteen companies are profiled across platforms, analytics and services. The software and analytics suppliers covered are Veeva Systems, Reltio, MSLInsight, Aissel Technologies, KOL LLC, Penterra Analytics and KOLs and Peers Analytics. Service providers include Genpact, Kendle Healthcare, AKT Health, Flatworld Solutions, Dhruvsoft, D2L Pharma Research Solutions and InkLab Medical Communications.
Key companies in the key opinion leader management market split into platform vendors, analytics specialists and service providers, and platform scale is becoming the main dividing line. Veeva Systems guided fiscal 2027 total revenues of USD 3,682 million to USD 3,687 million in August 2026. A supplier of that size can bundle KOL modules with CRM, content and data, which pressures niche tools on price. Specialists answer with depth in expert analytics and outsourced engagement services, and many sponsors keep two or more vendors for coverage.
- CRM and data platforms: Veeva Systems and Reltio.
- Expert analytics and mapping specialists: Aissel Technologies, MSLInsight, Penterra Analytics, KOL LLC and KOLs and Peers Analytics, each focused on finding and ranking experts.
- Services and outsourcing providers: Genpact, Kendle Healthcare, AKT Health, Flatworld Solutions, Dhruvsoft, D2L Pharma Research Solutions and InkLab Medical Communications.
Competitive Benchmarking: Key Opinion Leader Management Market
Table 9: Competitive Benchmarking for the Key Opinion Leader Management Market (qualitative ratings), 2026
| Company | Expert Data and Profiling | CRM Integration | Engagement Services | Recent Activity |
|---|---|---|---|---|
| Veeva Systems | High | High | Medium | High |
| Reltio | Medium | High | Low | Medium |
| Aissel Technologies | High | Medium | Medium | Medium |
| MSLInsight | Medium | Medium | Low | Low |
| Genpact | Medium | Medium | High | Medium |
| Kendle Healthcare | Low | Low | High | Low |
Ratings compare the companies on expert data and profiling, CRM integration, engagement services and recent activity.
Key Developments in the Key Opinion Leader Management Market
- Veeva Systems reported total revenues of USD 928.0 million for the quarter ended July 31, 2026, up 18%, in results issued on August 26, 2026. Growth at this rate signals that sponsors keep funding engagement platforms.
- Large sponsors are consolidating on Vault CRM, with more than 180 customers live and 12 top 20 biopharma commitments, according to Veeva Systems in August 2026. Migration on this scale makes competition harder for rival platforms.
- On December 3, 2025, Veeva Systems made AI agents for Vault CRM and PromoMats available to customers. Automated pre-call work shortens expert meeting preparation, which favours vendors with embedded AI.
- Indegene crossed INR 1,000 crore in quarterly revenue for the first time in Q4 FY26, the company said in April 2026. Rapid growth at outsourcing providers shows sponsors moving medical operations work to specialist partners.
- For program year 2025, the Centers for Medicare & Medicaid Services published USD 14.67 billion in payments and ownership interests. A payment flow of this size keeps compliance tooling central to every KOL program.
- On January 13, 2026, the American Cancer Society projected 2,114,850 new US cancer diagnoses for 2026. A patient base of this scale sustains oncology expert networks, the largest practice field.
- After a provisional deal in December 2025, the Council of the European Union adopted the Pharma Package in 2026. Revised EU rules will reshape launch timing, so medical teams will refresh expert plans country by country.
- China's National Medical Products Administration approved 76 innovative drugs in 2025, as Xinhua reported in May 2026. New domestic launches widen the pool of Chinese sponsors buying expert engagement tools.
Key Players in the Key Opinion Leader Management Market
CRM and Data Platforms
- Veeva Systems
- Reltio
KOL Analytics Specialists
- Aissel Technologies
- MSLInsight
- Penterra Analytics
- KOL LLC
- KOLs and Peers Analytics
Services and Outsourcing Providers
- Genpact
- Kendle Healthcare
- AKT Health
- Flatworld Solutions
- Dhruvsoft
- D2L Pharma Research Solutions
- InkLab Medical Communications
Key Opinion Leader Management Market - Report Scope
Table 10: Report Scope for the Key Opinion Leader Management Market (coverage fields and definitions), 2026 to 2036
| Coverage field | Report scope |
|---|---|
| Market breakdown | Solution; practice field; end user; region |
| Quantitative units | USD billion |
| Market definition | Software and services used by life sciences and healthcare organizations to identify, profile, engage and manage relationships with key opinion leaders, including cloud and on premises platforms and outsourced engagement services. |
| Regions covered | North America; Latin America; Western Europe; Eastern Europe; East Asia; South Asia and Pacific; Middle East and Africa |
| Countries covered | China; India; Spain; France; United Kingdom; United States; plus every other standard country in the regional tables |
| Key companies profiled | Veeva Systems, Reltio, MSLInsight, Genpact, Aissel Technologies, KOL LLC, Kendle Healthcare, Penterra Analytics, AKT Health, Flatworld Solutions, KOLs and Peers Analytics, Dhruvsoft, D2L Pharma Research Solutions, InkLab Medical Communications |
| Forecast period | 2026 to 2036 |
Key Opinion Leader Management Market - Research Methodology
Table 11: Research Methodology for the Key Opinion Leader Management Market (research methods and approach), 2026 edition
| Method | Approach |
|---|---|
| Data Sources | Company results, industry associations, government statistics and trade publications. |
| Desk Research | Desk research covers expert engagement software, medical affairs services, payment transparency, drug approvals and CRM platforms. |
| Market Sizing | Market value is built from solution, practice field and end user splits and checked against regional activity. |
| Data Validation | Figures are cross-checked across company, industry and government sources. |
Key Opinion Leader Management Market by Segments
Key Opinion Leader Management Market segmented by Solution:
- KOL Management Software
- Services
Key Opinion Leader Management Market segmented by Practice Field:
- Oncology
- Cardiology
- Obstetrics and Gynecology
- Orthopedics
- Dentistry
- Neurology
- Others
Key Opinion Leader Management Market segmented by End User:
- Pharma and Biotech Companies
- Medical Device Manufacturers
- Healthcare Service Providers
- Research Organizations
- Others
Key Opinion Leader Management Market by Region
- North America
- United States
- Canada
- Latin America
- Brazil
- Mexico
- Argentina
- Chile
- Western Europe
- Germany
- France
- United Kingdom
- Italy
- Spain
- Benelux
- Nordics
- Eastern Europe
- Poland
- Czech Republic
- Romania
- Hungary
- East Asia
- China
- Japan
- South Korea
- South Asia and Pacific
- India
- ASEAN
- Australia and New Zealand
- Middle East and Africa
- GCC Countries
- South Africa
- Türkiye
- Israel
Research Sources and Bibliography
- [1] U.S. Food and Drug Administration. (2026, July 8). Novel Drug Approvals for 2025. https://www.fda.gov/drugs/novel-drug-approvals-fda/novel-drug-approvals-2025
- [2] Centers for Medicare & Medicaid Services. (2026, July 9). Open Payments Data Overview. https://www.cms.gov/OpenPayments/Data
- [3] Veeva Systems. (2025, December 3). Veeva AI Agents Now Available to Increase Productivity and Customer Centricity. https://www.veeva.com/resources/veeva-ai-agents-now-available-to-increase-productivity-and-customer-centricity/
- [4] Indegene. (2026, April 29). Indegene Reports 32.8% YoY Growth in Q4FY26, Crosses ₹1,000 Crore Quarterly Revenue and ₹3,500 Crore Annual Revenue Milestone. https://nsearchives.nseindia.com/corporate/INDEGENE_29042026203956_Intimation_of_Press_Release.pdf
- [5] Veeva Systems. (2026, August 26). Veeva Announces Fiscal 2027 Second Quarter Results. https://www.veeva.com/resources/veeva-announces-fiscal-2027-second-quarter-results/
- [6] ECA Academy. (2026, October 14). EU Pharma Package: Council Adopts New Rules. https://www.gmp-compliance.org/gmp-news/eu-pharma-package-council-adopts-new-rules
- [7] Xinhua News Agency. (2026, May 28). China Focus: China's drug innovation rises faster, with broader share in global market. https://eng.yidaiyilu.gov.cn/p/0T1QD1NT.html
- [8] American Cancer Society. (2026, January 13). ACS Annual Statistics Report: Milestone 70 Percent 5-Year Survival Rate for all Cancers Combined; Largest Gains for Advanced and Fatal Cancers. https://pressroom.cancer.org/cancer-statistics-report-2026
This bibliography is provided for reader reference. The full report contains the complete reference list and detailed citations.
This Report Answers
- How big is the key opinion leader management market during 2026?
- What market size is projected by 2036?
- Which solution holds notable share?
- Which practice field holds notable share?
- Which countries have notable growth?
- Which companies are notable in the market?
Table of Content
- Key Takeaways
- Market Size and CAGR
- Top Growth Driver
- Fastest Growing Segment
- Leading Region
- Key Companies
- Emerging Opportunities
- Executive Summary
- Global Market Outlook
- Demand-side Trends
- Supply-side Trends
- Technology Roadmap Analysis
- Analysis and Recommendations
- Analyst Perspective (What is happening? Why now? What should investors know?)
- Key Questions Answered
- How large is the market?
- What is the CAGR?
- What are key trends?
- Which region dominates?
- Who are the leaders?
Read More...
- Market Overview
- Market Coverage / Taxonomy
- Market Definition / Scope / Limitations
- Research Methodology
- Chapter Orientation
- Analytical Lens and Working Hypotheses
- Market Structure, Signals, and Trend Drivers
- Benchmarking and Cross-market Comparability
- Market Sizing, Forecasting, and Opportunity Mapping
- Research Design and Evidence Framework
- Desk Research Programme (Secondary Evidence)
- Expert Input and Fieldwork (Primary Evidence)
- Tooling, Models, and Reference Databases
- Data Engineering and Model Build
- Quality Assurance and Audit Trail
- Market Background
- Market Dynamics (Drivers, Restraints, Opportunity, Trends)
- Scenario Forecast (Optimistic, Likely, Conservative)
- Impact Analysis
- AI Impact
- Sustainability Impact
- Regulatory Impact
- Technology Impact
- Consumer / Buyer Analysis
- Purchase Drivers
- Adoption Barriers
- Buyer Journey
- Opportunity Map Analysis
- Product Life Cycle Analysis
- Supply Chain Analysis
- Investment Feasibility Matrix
- Value Chain Analysis
- PESTLE and Porter's Analysis
- Regulatory Landscape
- Regional Parent Market Outlook
- Production and Consumption Statistics
- Import and Export Statistics
- Global Market Analysis and Forecast, 2021 to 2036
- Historical Market Size Value (USD Billion) Analysis, 2021 to 2025
- Current and Future Market Size Value (USD Billion) Projections, 2026 to 2036
- Y-o-Y Growth Trend Analysis
- Absolute $ Opportunity Analysis
- Global Market Pricing Analysis, 2021 to 2036
- Global Market Analysis and Forecast, By Solution, 2021 to 2036
- Introduction / Key Findings
- Historical Market Size Value (USD Billion) Analysis By Solution, 2021 to 2025
- Current and Future Market Size Value (USD Billion) Analysis and Forecast By Solution, 2026 to 2036
- KOL Management Software
- Services
- Y-o-Y Growth Trend Analysis By Solution, 2021 to 2025
- Absolute $ Opportunity Analysis By Solution, 2026 to 2036
- Global Market Analysis and Forecast, By Practice Field, 2021 to 2036
- Introduction / Key Findings
- Historical Market Size Value (USD Billion) Analysis By Practice Field, 2021 to 2025
- Current and Future Market Size Value (USD Billion) Analysis and Forecast By Practice Field, 2026 to 2036
- Oncology
- Cardiology
- Obstetrics and Gynecology
- Orthopedics
- Dentistry
- Neurology
- Others
- Y-o-Y Growth Trend Analysis By Practice Field, 2021 to 2025
- Absolute $ Opportunity Analysis By Practice Field, 2026 to 2036
- Global Market Analysis and Forecast, By End User, 2021 to 2036
- Introduction / Key Findings
- Historical Market Size Value (USD Billion) Analysis By End User, 2021 to 2025
- Current and Future Market Size Value (USD Billion) Analysis and Forecast By End User, 2026 to 2036
- Pharma and Biotech Companies
- Medical Device Manufacturers
- Healthcare Service Providers
- Research Organizations
- Others
- Y-o-Y Growth Trend Analysis By End User, 2021 to 2025
- Absolute $ Opportunity Analysis By End User, 2026 to 2036
- Global Market Analysis and Forecast, By Region, 2021 to 2036
- Introduction
- Historical Market Size Value (USD Billion) Analysis By Region, 2021 to 2025
- Current Market Size Value (USD Billion) Analysis and Forecast By Region, 2026 to 2036
- North America
- Latin America
- Western Europe
- Eastern Europe
- East Asia
- South Asia and Pacific
- Middle East and Africa
- Market Attractiveness Analysis By Region
- North America Market Analysis and Forecast, By Country, 2021 to 2036
- Historical Market Size Value (USD Billion) Trend Analysis By Market Taxonomy, 2021 to 2025
- Market Size Value (USD Billion) Forecast By Market Taxonomy, 2026 to 2036
- By Country
- United States
- Canada
- By Solution
- By Practice Field
- By End User
- By Country
- Market Attractiveness Analysis
- By Country
- By Solution
- By Practice Field
- By End User
- Key Takeaways
- Latin America Market Analysis and Forecast, By Country
- Historical Market Size Value (USD Billion) Trend Analysis By Market Taxonomy, 2021 to 2025
- Market Size Value (USD Billion) Forecast By Market Taxonomy, 2026 to 2036
- By Country
- Brazil
- Mexico
- Argentina
- Chile
- By Solution
- By Practice Field
- By End User
- By Country
- Market Attractiveness Analysis
- By Country
- By Solution
- By Practice Field
- By End User
- Key Takeaways
- Western Europe Market Analysis and Forecast, By Country
- Historical Market Size Value (USD Billion) Trend Analysis By Market Taxonomy, 2021 to 2025
- Market Size Value (USD Billion) Forecast By Market Taxonomy, 2026 to 2036
- By Country
- Germany
- France
- United Kingdom
- Italy
- Spain
- Benelux
- Nordics
- By Solution
- By Practice Field
- By End User
- By Country
- Market Attractiveness Analysis
- By Country
- By Solution
- By Practice Field
- By End User
- Key Takeaways
- Eastern Europe Market Analysis and Forecast, By Country
- Historical Market Size Value (USD Billion) Trend Analysis By Market Taxonomy, 2021 to 2025
- Market Size Value (USD Billion) Forecast By Market Taxonomy, 2026 to 2036
- By Country
- Poland
- Czech Republic
- Romania
- Hungary
- By Solution
- By Practice Field
- By End User
- By Country
- Market Attractiveness Analysis
- By Country
- By Solution
- By Practice Field
- By End User
- Key Takeaways
- East Asia Market Analysis and Forecast, By Country
- Historical Market Size Value (USD Billion) Trend Analysis By Market Taxonomy, 2021 to 2025
- Market Size Value (USD Billion) Forecast By Market Taxonomy, 2026 to 2036
- By Country
- China
- Japan
- South Korea
- By Solution
- By Practice Field
- By End User
- By Country
- Market Attractiveness Analysis
- By Country
- By Solution
- By Practice Field
- By End User
- Key Takeaways
- South Asia and Pacific Market Analysis and Forecast, By Country
- Historical Market Size Value (USD Billion) Trend Analysis By Market Taxonomy, 2021 to 2025
- Market Size Value (USD Billion) Forecast By Market Taxonomy, 2026 to 2036
- By Country
- India
- ASEAN
- Australia and New Zealand
- By Solution
- By Practice Field
- By End User
- By Country
- Market Attractiveness Analysis
- By Country
- By Solution
- By Practice Field
- By End User
- Key Takeaways
- Middle East and Africa Market Analysis and Forecast, By Country
- Historical Market Size Value (USD Billion) Trend Analysis By Market Taxonomy, 2021 to 2025
- Market Size Value (USD Billion) Forecast By Market Taxonomy, 2026 to 2036
- By Country
- GCC Countries
- South Africa
- Türkiye
- Israel
- By Solution
- By Practice Field
- By End User
- By Country
- Market Attractiveness Analysis
- By Country
- By Solution
- By Practice Field
- By End User
- Key Takeaways
- Key Countries Market Analysis
- United States
- Pricing Analysis
- Market Share Analysis, 2025
- By Solution
- By Practice Field
- By End User
- Canada
- Pricing Analysis
- Market Share Analysis, 2025
- By Solution
- By Practice Field
- By End User
- Mexico
- Pricing Analysis
- Market Share Analysis, 2025
- By Solution
- By Practice Field
- By End User
- Brazil
- Pricing Analysis
- Market Share Analysis, 2025
- By Solution
- By Practice Field
- By End User
- Chile
- Pricing Analysis
- Market Share Analysis, 2025
- By Solution
- By Practice Field
- By End User
- Germany
- Pricing Analysis
- Market Share Analysis, 2025
- By Solution
- By Practice Field
- By End User
- United Kingdom
- Pricing Analysis
- Market Share Analysis, 2025
- By Solution
- By Practice Field
- By End User
- Italy
- Pricing Analysis
- Market Share Analysis, 2025
- By Solution
- By Practice Field
- By End User
- Spain
- Pricing Analysis
- Market Share Analysis, 2025
- By Solution
- By Practice Field
- By End User
- France
- Pricing Analysis
- Market Share Analysis, 2025
- By Solution
- By Practice Field
- By End User
- India
- Pricing Analysis
- Market Share Analysis, 2025
- By Solution
- By Practice Field
- By End User
- ASEAN
- Pricing Analysis
- Market Share Analysis, 2025
- By Solution
- By Practice Field
- By End User
- Australia and New Zealand
- Pricing Analysis
- Market Share Analysis, 2025
- By Solution
- By Practice Field
- By End User
- China
- Pricing Analysis
- Market Share Analysis, 2025
- By Solution
- By Practice Field
- By End User
- Japan
- Pricing Analysis
- Market Share Analysis, 2025
- By Solution
- By Practice Field
- By End User
- South Korea
- Pricing Analysis
- Market Share Analysis, 2025
- By Solution
- By Practice Field
- By End User
- Poland
- Pricing Analysis
- Market Share Analysis, 2025
- By Solution
- By Practice Field
- By End User
- Hungary
- Pricing Analysis
- Market Share Analysis, 2025
- By Solution
- By Practice Field
- By End User
- Türkiye
- Pricing Analysis
- Market Share Analysis, 2025
- By Solution
- By Practice Field
- By End User
- South Africa
- Pricing Analysis
- Market Share Analysis, 2025
- By Solution
- By Practice Field
- By End User
- United States
- Market Structure Analysis
- Competition Dashboard
- Competition Benchmarking
- Market Share Analysis of Top Players
- By Regional
- By Solution
- By Practice Field
- By End User
- Emerging Startups
- Innovation Benchmarking
- Competition Analysis
- Competition Deep Dive
- Veeva Systems
- Overview
- Product Portfolio
- Profitability by Market Segments
- Sales Footprint
- Strategy Overview
- Marketing Strategy
- Product Strategy
- Channel Strategy
- Reltio
- Aissel Technologies
- MSLInsight
- Genpact
- Kendle Healthcare
- Penterra Analytics
- KOL LLC
- KOLs and Peers Analytics
- AKT Health
- Flatworld Solutions
- Dhruvsoft
- D2L Pharma Research Solutions
- InkLab Medical Communications
- Veeva Systems
- Case Studies
- Success Stories
- Recent Developments
- Competition Deep Dive
- Assumptions & Acronyms Used
List of Tables
- Table 1: Global Market Value (USD Billion) Forecast by Region, 2021 to 2036
- Table 2: Global Market Value (USD Billion) Forecast by Solution, 2021 to 2036
- Table 3: Global Market Value (USD Billion) Forecast by Practice Field, 2021 to 2036
- Table 4: Global Market Value (USD Billion) Forecast by End User, 2021 to 2036
- Table 5: North America Market Value (USD Billion) Forecast by Country, 2021 to 2036
- Table 6: North America Market Value (USD Billion) Forecast by Solution, 2021 to 2036
- Table 7: North America Market Value (USD Billion) Forecast by Practice Field, 2021 to 2036
- Table 8: North America Market Value (USD Billion) Forecast by End User, 2021 to 2036
- Table 9: Latin America Market Value (USD Billion) Forecast by Country, 2021 to 2036
- Table 10: Latin America Market Value (USD Billion) Forecast by Solution, 2021 to 2036
- Table 11: Latin America Market Value (USD Billion) Forecast by Practice Field, 2021 to 2036
- Table 12: Latin America Market Value (USD Billion) Forecast by End User, 2021 to 2036
- Table 13: Western Europe Market Value (USD Billion) Forecast by Country, 2021 to 2036
- Table 14: Western Europe Market Value (USD Billion) Forecast by Solution, 2021 to 2036
- Table 15: Western Europe Market Value (USD Billion) Forecast by Practice Field, 2021 to 2036
- Table 16: Western Europe Market Value (USD Billion) Forecast by End User, 2021 to 2036
- Table 17: Eastern Europe Market Value (USD Billion) Forecast by Country, 2021 to 2036
- Table 18: Eastern Europe Market Value (USD Billion) Forecast by Solution, 2021 to 2036
- Table 19: Eastern Europe Market Value (USD Billion) Forecast by Practice Field, 2021 to 2036
- Table 20: Eastern Europe Market Value (USD Billion) Forecast by End User, 2021 to 2036
- Table 21: East Asia Market Value (USD Billion) Forecast by Country, 2021 to 2036
- Table 22: East Asia Market Value (USD Billion) Forecast by Solution, 2021 to 2036
- Table 23: East Asia Market Value (USD Billion) Forecast by Practice Field, 2021 to 2036
- Table 24: East Asia Market Value (USD Billion) Forecast by End User, 2021 to 2036
- Table 25: South Asia and Pacific Market Value (USD Billion) Forecast by Country, 2021 to 2036
- Table 26: South Asia and Pacific Market Value (USD Billion) Forecast by Solution, 2021 to 2036
- Table 27: South Asia and Pacific Market Value (USD Billion) Forecast by Practice Field, 2021 to 2036
- Table 28: South Asia and Pacific Market Value (USD Billion) Forecast by End User, 2021 to 2036
- Table 29: Middle East and Africa Market Value (USD Billion) Forecast by Country, 2021 to 2036
- Table 30: Middle East and Africa Market Value (USD Billion) Forecast by Solution, 2021 to 2036
- Table 31: Middle East and Africa Market Value (USD Billion) Forecast by Practice Field, 2021 to 2036
- Table 32: Middle East and Africa Market Value (USD Billion) Forecast by End User, 2021 to 2036
List of Figures
- Figure 1: Global Market Pricing Analysis
- Figure 2: Global Market Value (USD Billion) Forecast 2021-2036
- Figure 3: Global Market Value Share and BPS Analysis by Solution, 2026 and 2036
- Figure 4: Global Market Y-o-Y Growth Comparison by Solution, 2026-2036
- Figure 5: Global Market Attractiveness Analysis by Solution
- Figure 6: Global Market Value Share and BPS Analysis by Practice Field, 2026 and 2036
- Figure 7: Global Market Y-o-Y Growth Comparison by Practice Field, 2026-2036
- Figure 8: Global Market Attractiveness Analysis by Practice Field
- Figure 9: Global Market Value Share and BPS Analysis by End User, 2026 and 2036
- Figure 10: Global Market Y-o-Y Growth Comparison by End User, 2026-2036
- Figure 11: Global Market Attractiveness Analysis by End User
- Figure 12: Global Market Value (USD Billion) Share and BPS Analysis by Region, 2026 and 2036
- Figure 13: Global Market Y-o-Y Growth Comparison by Region, 2026-2036
- Figure 14: Global Market Attractiveness Analysis by Region
- Figure 15: North America Market Incremental Dollar Opportunity, 2026-2036
- Figure 16: Latin America Market Incremental Dollar Opportunity, 2026-2036
- Figure 17: Western Europe Market Incremental Dollar Opportunity, 2026-2036
- Figure 18: Eastern Europe Market Incremental Dollar Opportunity, 2026-2036
- Figure 19: East Asia Market Incremental Dollar Opportunity, 2026-2036
- Figure 20: South Asia and Pacific Market Incremental Dollar Opportunity, 2026-2036
- Figure 21: Middle East and Africa Market Incremental Dollar Opportunity, 2026-2036
- Figure 22: North America Market Value Share and BPS Analysis by Country, 2026 and 2036
- Figure 23: North America Market Value Share and BPS Analysis by Solution, 2026 and 2036
- Figure 24: North America Market Y-o-Y Growth Comparison by Solution, 2026-2036
- Figure 25: North America Market Attractiveness Analysis by Solution
- Figure 26: North America Market Value Share and BPS Analysis by Practice Field, 2026 and 2036
- Figure 27: North America Market Y-o-Y Growth Comparison by Practice Field, 2026-2036
- Figure 28: North America Market Attractiveness Analysis by Practice Field
- Figure 29: North America Market Value Share and BPS Analysis by End User, 2026 and 2036
- Figure 30: North America Market Y-o-Y Growth Comparison by End User, 2026-2036
- Figure 31: North America Market Attractiveness Analysis by End User
- Figure 32: Latin America Market Value Share and BPS Analysis by Country, 2026 and 2036
- Figure 33: Latin America Market Value Share and BPS Analysis by Solution, 2026 and 2036
- Figure 34: Latin America Market Y-o-Y Growth Comparison by Solution, 2026-2036
- Figure 35: Latin America Market Attractiveness Analysis by Solution
- Figure 36: Latin America Market Value Share and BPS Analysis by Practice Field, 2026 and 2036
- Figure 37: Latin America Market Y-o-Y Growth Comparison by Practice Field, 2026-2036
- Figure 38: Latin America Market Attractiveness Analysis by Practice Field
- Figure 39: Latin America Market Value Share and BPS Analysis by End User, 2026 and 2036
- Figure 40: Latin America Market Y-o-Y Growth Comparison by End User, 2026-2036
- Figure 41: Latin America Market Attractiveness Analysis by End User
- Figure 42: Western Europe Market Value Share and BPS Analysis by Country, 2026 and 2036
- Figure 43: Western Europe Market Value Share and BPS Analysis by Solution, 2026 and 2036
- Figure 44: Western Europe Market Y-o-Y Growth Comparison by Solution, 2026-2036
- Figure 45: Western Europe Market Attractiveness Analysis by Solution
- Figure 46: Western Europe Market Value Share and BPS Analysis by Practice Field, 2026 and 2036
- Figure 47: Western Europe Market Y-o-Y Growth Comparison by Practice Field, 2026-2036
- Figure 48: Western Europe Market Attractiveness Analysis by Practice Field
- Figure 49: Western Europe Market Value Share and BPS Analysis by End User, 2026 and 2036
- Figure 50: Western Europe Market Y-o-Y Growth Comparison by End User, 2026-2036
- Figure 51: Western Europe Market Attractiveness Analysis by End User
- Figure 52: Eastern Europe Market Value Share and BPS Analysis by Country, 2026 and 2036
- Figure 53: Eastern Europe Market Value Share and BPS Analysis by Solution, 2026 and 2036
- Figure 54: Eastern Europe Market Y-o-Y Growth Comparison by Solution, 2026-2036
- Figure 55: Eastern Europe Market Attractiveness Analysis by Solution
- Figure 56: Eastern Europe Market Value Share and BPS Analysis by Practice Field, 2026 and 2036
- Figure 57: Eastern Europe Market Y-o-Y Growth Comparison by Practice Field, 2026-2036
- Figure 58: Eastern Europe Market Attractiveness Analysis by Practice Field
- Figure 59: Eastern Europe Market Value Share and BPS Analysis by End User, 2026 and 2036
- Figure 60: Eastern Europe Market Y-o-Y Growth Comparison by End User, 2026-2036
- Figure 61: Eastern Europe Market Attractiveness Analysis by End User
- Figure 62: East Asia Market Value Share and BPS Analysis by Country, 2026 and 2036
- Figure 63: East Asia Market Value Share and BPS Analysis by Solution, 2026 and 2036
- Figure 64: East Asia Market Y-o-Y Growth Comparison by Solution, 2026-2036
- Figure 65: East Asia Market Attractiveness Analysis by Solution
- Figure 66: East Asia Market Value Share and BPS Analysis by Practice Field, 2026 and 2036
- Figure 67: East Asia Market Y-o-Y Growth Comparison by Practice Field, 2026-2036
- Figure 68: East Asia Market Attractiveness Analysis by Practice Field
- Figure 69: East Asia Market Value Share and BPS Analysis by End User, 2026 and 2036
- Figure 70: East Asia Market Y-o-Y Growth Comparison by End User, 2026-2036
- Figure 71: East Asia Market Attractiveness Analysis by End User
- Figure 72: South Asia and Pacific Market Value Share and BPS Analysis by Country, 2026 and 2036
- Figure 73: South Asia and Pacific Market Value Share and BPS Analysis by Solution, 2026 and 2036
- Figure 74: South Asia and Pacific Market Y-o-Y Growth Comparison by Solution, 2026-2036
- Figure 75: South Asia and Pacific Market Attractiveness Analysis by Solution
- Figure 76: South Asia and Pacific Market Value Share and BPS Analysis by Practice Field, 2026 and 2036
- Figure 77: South Asia and Pacific Market Y-o-Y Growth Comparison by Practice Field, 2026-2036
- Figure 78: South Asia and Pacific Market Attractiveness Analysis by Practice Field
- Figure 79: South Asia and Pacific Market Value Share and BPS Analysis by End User, 2026 and 2036
- Figure 80: South Asia and Pacific Market Y-o-Y Growth Comparison by End User, 2026-2036
- Figure 81: South Asia and Pacific Market Attractiveness Analysis by End User
- Figure 82: Middle East and Africa Market Value Share and BPS Analysis by Country, 2026 and 2036
- Figure 83: Middle East and Africa Market Value Share and BPS Analysis by Solution, 2026 and 2036
- Figure 84: Middle East and Africa Market Y-o-Y Growth Comparison by Solution, 2026-2036
- Figure 85: Middle East and Africa Market Attractiveness Analysis by Solution
- Figure 86: Middle East and Africa Market Value Share and BPS Analysis by Practice Field, 2026 and 2036
- Figure 87: Middle East and Africa Market Y-o-Y Growth Comparison by Practice Field, 2026-2036
- Figure 88: Middle East and Africa Market Attractiveness Analysis by Practice Field
- Figure 89: Middle East and Africa Market Value Share and BPS Analysis by End User, 2026 and 2036
- Figure 90: Middle East and Africa Market Y-o-Y Growth Comparison by End User, 2026-2036
- Figure 91: Middle East and Africa Market Attractiveness Analysis by End User
- Figure 92: Global Market - Tier Structure Analysis
- Figure 93: Global Market - Company Share Analysis
Frequently Asked Questions
How large is the key opinion leader management market expected in 2026?
The key opinion leader management market is expected to reach USD 87.4 billion in 2026, FMI estimates, up from USD 79.6 billion in 2025, as drug sponsors expand expert programs around new launches.
What CAGR is projected for the key opinion leader management market through 2036?
Demand for key opinion leader management is projected to grow at a 9.8% CAGR through 2036, as AI tools and steady launch counts widen the use of expert mapping.
Which solution holds a notable market share in 2026?
KOL management software is expected to lead with 53.4% share in 2026, given sponsor preference for one controlled view of expert interactions. Services hold the remaining 46.6%.
Which practice field holds a notable market share in 2026?
Oncology is expected to lead with 35% share in 2026, as cancer pipelines need large expert and investigator networks. Cardiology is second at about 18.6%.
Which country has a notable expansion outlook through 2036?
FMI projects China to grow fastest among profiled countries at a 6.5% CAGR, supported by a widening base of domestic drug sponsors. India is next at 5.8%.
Who are the key companies in the key opinion leader management market?
Veeva Systems and Reltio lead the platform group, and Aissel Technologies, MSLInsight and Penterra Analytics lead the analytics specialists. Genpact, Kendle Healthcare and AKT Health compete on outsourced engagement services, as sponsors often split software and service contracts.
Preview the report firsthand - request a free sample
Get SampleGet the brochure for pricing and purchase details.
Get PDF
