Lactose-free Cheese Market Outlook (2022-2032)

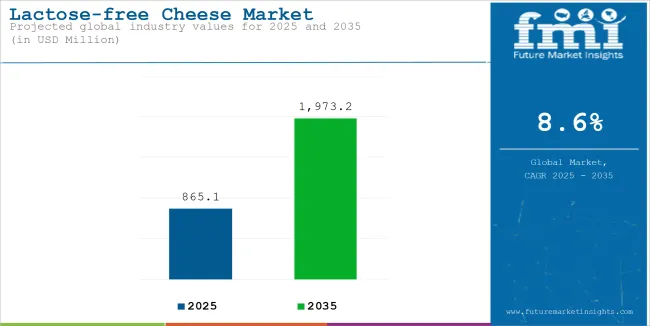
[350 Pages Report] The global lactose-free cheese market size is expected to reach a valuation of US$ 676.3 Million by the end of 2022. The market is set to accelerate at a CAGR of 8.4% during 2022 to 2032. It is anticipated to be valued at US$ 1,515.1 Million in 2032.

Lactose-free dairy can provide those who cannot digest lactose with essential nutrients found in traditional dairy products, such as vitamins and calcium. Consumers are moving towards this product category because of its broad and expanding health appeal.

Quality and variety of lactose-free dairy products have improved dramatically in recent years, allowing consumers to select from a wider range of choices. As a result, lactose-free cheese has become the dairy industry's fastest-growing segment.

Lactose-free cheese eaters have found that veganism is a healthy and essential option. According to a customer survey by FMI, 40% of customers bought plant-based products because they believed they were healthier, 30% as they wanted to try them, and 25% because someone in their home has lactose intolerance. Plant-based alternatives thus account for a smaller share of the lactose-free cheese market than the product.

Plant-based foods, on the other hand, have experienced a recent surge in terms of popularity. Plant-based foods and beverages will continue to be exhibiting high demand throughout the forecast period. According to the Plant-Based Foods Association (PBFA), plant-based food retail sales in the U.S. increased by 11.4 percent in 2019.

Attributes Key Statistics
Global Lactose-free Cheese Market Estimated Size (2022E) US$ 676.3 million
Projected Market Valuation (2032F) US$ 1,515.1 million
Value-based CAGR (2022 to 2032) 8.4%
Collective Value Share: Top 3 Countries 33.8%

Don't pay for what you don't need

Customize your report by selecting specific countries or regions and save 30%!

2016-2021 Global Lactose-free Cheese Demand Compared to 2022-2032 Forecast

Dairy consumers’ views are shifting all around the world. Consumers, particularly in dairy’s most famous markets, have reacted to concerns about allergens, hormone usage, and perceived unhealthiness of various dairy products, which were once hailed as an integral part of a balanced diet in many cultures.

This is further altering the environment for dairy producers all around the globe, as they are trying to keep up with changing consumer views and subtleties in consumer attitudes from region to region. They are also capitalizing on varying dairy consumption prospects to expand their businesses. However, lactose is a significant proportion of many fresh dairy products.

For lactose intolerant people, it is not necessary to completely avoid dairy products' indulgence and nutritional value. Thus, the lactose-free dairy market is the fastest-growing segment in the dairy industry. Owing to the aforementioned factors, the global lactose-free cheese market is expected to grow at a CAGR of 8.4% from 2022 to 2032.

Lactose-free Cheese Market

Top Trend Pushing the Demand for Lactose-free Cheese Worldwide

  • Increasing Demand for Plant-based Food Products

Nutritional and health claims are considered novel ways of endorsing a particular food's beneficial qualities. Manufacturers’ claims, such as lactose-free, vegan, fat-free, gluten-free, non-GMO, and kosher, positively impact consumer purchasing decisions when comparing products from different brands.

Although many of the products that carry such claims have traditionally been devoid of animal products, plant-based claims have surged 68% globally over the last five years as companies exhibited an opportunity to tap into the growing demand, according to FMI. These factors are anticipated to fuel the global lactose-free cheese market in the assessment period.

Nandini Roy Choudhury

Principal Consultant

Talk to Analyst

Find your sweet spots for generating winning opportunities in this market.

Country-wise Insights

How is the Rising Demand for Plant-based Cheese Driving the U.S.?

“Lactose-free Cheese Brands in the U.S. Are Targeting Consumers Suffering from Allergies”

People with allergies or intolerances, such as lactose intolerance, were the main target consumers for U.S.-based firms twenty years ago. The flavor of plant-based dairy replacements was distinct, and expectations were low.

Plant-based foods have expanded into new uses, such as yogurt and cheese, as the allergen-free market has grown rapidly, and product flavor & quality have considerably improved. People in the U.S. are aware that plant protein has a lesser environmental impact than animal protein, which has become a major motivation.

In North American countries like the U.S., health and wellness are a vital part of a person’s life, especially among millennials. People suffering from allergies are set to continue to support the plant-based sector, which would push the U.S. lactose-free cheese market in the next decade.

Why is Lactose-free Cheese Showcasing Exponential Demand in the U.K.?

“High Demand for Clean Label Products in the U.K. to Spur Sales of Cheese without Lactose”

The stratospheric rise of plant-based alternatives is a third area where lactose-free cheese is positioned to serve as a key ingredient, a major food industry trend in the U.K. today. Over the next few years, the lactose-free cheese market is expected to grow at a higher rate than the dairy cheese industry across the U.K. Plant-based choices, clean labeling and more sustainable supply chains that come with them are set to exhibit high demand.

In addition, lactose-free cheese tastes just as good on a veggie burger as it would on beef or turkey burgers. Rising incorporation of cheese into numerous fast food products and unique recipes to gain healthy plant-based proteins and components is projected to drive the U.K. lactose-free cheese market in the evaluation period.

Why is There a Rising Demand for Lactose-free Dairy Products in China?

“Dairy-free Cheese to Gain Traction in China with Increasing Cases of Lactose Intolerance”

According to DSM, a science-based firm focusing on nutrition, health, and sustainable living, a country like China has at least 40% more lactose intolerance sufferers than a European country. Lactose digestion is hampered in 90-100 percent of East Asian and 80 percent of Central Asian adults.

This is due to human civilizations' historical reliance on dairy as a significant source of nutrition. Adults in Europe can consume milk because their forefathers lived in places where dairying flourished, thereby passing down gene variants that keep lactase active into adulthood. In some parts of the world, such as China, dairy production has historically been more challenging, and people have lost their capacity to digest milk after childhood.

Dairy consumption continues to climb in China, even though most of the population is lactose intolerant. Besides, the increasing geriatric population and growing awareness about health & wellness in the country are projected to boost the lactose-free cheese market in the next decade.

Category-wise Insights

Which is the Leading Distribution Channel for Selling Lactose-free Cheese?

“Consumers Prefer Purchasing Gluten and Dairy Free Cheese from Online Retailers”

Based on the distribution channel, the online retailers sub-segment under the B2C segment is projected to dominate the global lactose-free cheese market by 2032. Expansion of the e-commerce sector with increasing penetration of the internet and growing use of smartphones is likely to push sales of lactose-free cheese in the upcoming decade. Online retailers provide access to a wide range of products on the same platform and offer hassle-free home delivery services to consumers. These advantages of online shopping are projected to drive the lactose-free cheese market worldwide.

Get the data you need at a Fraction of the cost

Personalize your report by choosing insights you need
and save 40%!

Competitive Landscape

As lactose-free products are gaining immense popularity these days across the globe, there is a growing trend among consumers to try out new products. Today’s consumers lo longer confine themselves to traditional three meals a day, but they are likely to try out unique products which are emerging in the lactose-free cheese market.

Snacking trend is tremendously popular in developed countries across North America, including the U.S., especially among the millennial population. Hence, vegan snaking menus are likely to lift up sales of vegan cheese over the forecast period, thereby pushing the lactose-free cheese market. Key players are also conducting research & development activities to come up with novel products.

For instance,

  • In January 2022, Bel Group, a France-based dairy company, launched its first-ever vegan version of the best-selling signature Babybel wax mini cheeses across the U.K. with a green jacket. It is made with coconut oil and various Vegan Society-approved ingredients.
  • In August 2021, Good Culture, a renowned food brand, introduced a new range of products, including squeezable sour cream pouches and its first lactose-free line. These products are made of pasture-raised milk, which is sourced directly from small family farms in the Midwest and feature active & live animals.

General Mills, Arla Foods, Daiya Foods Inc. –Top Three Lactose-free Cheese Brands That Will Satisfy Your Craving

General Mills, Inc. is an American company that produces and markets branded consumer goods for sale in retail establishments. The company's ‘accelerate’ strategy directs how it builds brands, innovates nonstop, scales up, and stands up for what's right in the world. A few of its well-known trademarks in its portfolio are Cheerios, Nature Valley, Blue Buffalo, Häagen-Dazs, Old El Paso, Pillsbury, Betty Crocker, Yoplait, Annie's, Wanchai Ferry, Yoki, and others.

In March 2022, with the introduction of Cinnamon Toast Crunch Creamy Cinnamon Spread, B&G Foods is providing consumers its first chance to spread, swirl, and drizzle the flavor of their favorite cereal over just about everything. Similarly, in May 2022, General Mills disclosed that it will pay Eagle Family Foods Group US$ 610 Million for the operations of Hamburger Helper and Suddenly Salad. The closing of this deal is anticipated for later this year.

Arla Foods amba, on the other hand, is a Danish-Swedish multinational cooperative with headquarters in Viby, Denmark. It is the biggest dairy firm in the U.K., as well as the largest producer of dairy products in Scandinavia. The Swedish dairy cooperative Arla and the Danish dairy business MD Foods merged on April 17, 2000, to create Arla Foods. According to milk volume, Arla Foods is the fourth-largest dairy firm in the world and seventh in terms of revenue.

In October 2019, a cheese producing facility in Bahrain received an estimated €50 million (US$ 55 Million) investment from Arla Foods. By 2025, Arla hopes to grow the yearly production in Bahrain under its Puck, Arla, Dano, Kraft, and Private Label brands to more than 100,000 tons.

Similarly, in 2022, Arla created the Don't Cancel the Cow advertising campaign, alleging that the increasing vegetarianism among young people is the reason the dairy industry's future is questionable. Through this campaign, the company is focusing on millennials as they are more aware about the effects that cows' milk has on the environment.

Daiya Foods Inc. is a dairy-alternative food manufacturer established in Burnaby, British Columbia, Canada. The first products from Daiya are cheese substitutes manufactured from tapioca flour and coconut oil that have a consistency and melting quality similar to cheese. The company ensures that its products are not made from any dairy, soy, wheat, barley, gluten, or nuts.

In January 2022, to cater to the growing demand for plant-based meals, Daiya Foods announced a new sales and distribution cooperation with Hyundai Green Food. Similarly, in April 2020, Daiya announced the launch of a large number of delicious new products with the intention of pleasing both people and the world.

Scope of the Report

Attribute Details
Estimated Market Size (2022) US$ 676.3 million
Projected Market Valuation (2032) US$ 1,515.1 million
Value-based CAGR (2022 to 2032) 8.4%
Forecast Period 2022 to 2032
Historical Data Available for 2016 to 2021
Market Analysis Value (US$ Million) and Volume (MT)
Key Regions Covered North America; Latin America; Europe; East Asia; South Asia; and the Middle East & Africa
Key Countries Covered USA, Brazil, Mexico, Germany, UK, China, India, Japan, Australia, and GCC Countries
Key Segments Covered Product Type, Form, Distribution Channel, and Region
Key Companies Profiled Alpro UK Ltd.; Amy's Kitchen, Inc.; Arla Foods Amba; Barry Callebaut AG; Cargill, Inc.; Chr. Hansen Holdings A/S; Daiya Foods, Inc.; Dean Foods Company; Edlong Dairy Technologies; Emmi AG; Fonterra Co-operative Group Ltd.; Galaxy Nutritional Foods, Inc.; General Mills, Inc.; Green Valley Organics; HP Hood LLC; Land O'Lakes, Inc.; Murray Goulburn Co-operative Co. Limited (Devondale Murray Goulburn); Tine AS; WhiteWave Foods Company; Others
Report Coverage Market Forecast, Company Share Analysis, Competition Intelligence, DROT Analysis, Market Dynamics and Challenges, and Strategic Growth Initiatives

Lactose-free Cheese Market Outlook by Category

By Product Type:

  • Blue Cheese
  • Brick Cheese
  • Camembert Cheese
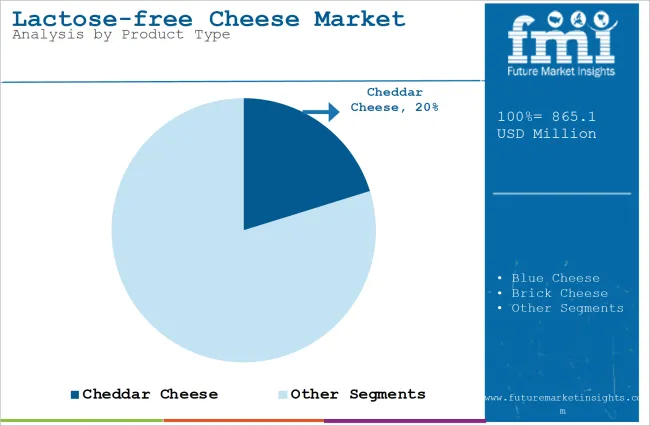
  • Cheddar Cheese
  • Cottage Cheese
  • Cream Cheese
  • Mozzarella Cheese
  • Romano Cheese
  • Swiss Cheese

By Form:

  • Cheese Blocks
  • Triangle
  • Rectangle
  • Circle
  • Square
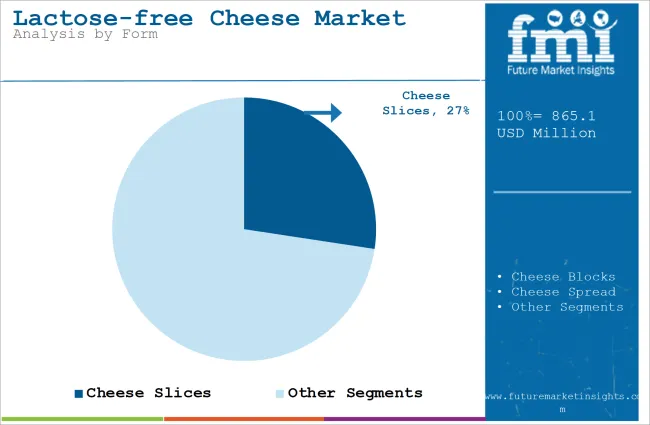
  • Cheese Slice
  • Cheese Spread
  • Cheese Spray

By Distribution Channel:

  • B2B
  • B2C
    • Hypermarkets/Supermarkets
    • Convenience Stores
    • Specialty Stores
    • Traditional Groceries
    • Online Retailers

By Region:

  • North America
  • Latin America
  • Europe
  • East Asia
  • South Asia
  • Oceania
  • Middle east and Africa

Frequently Asked Questions

How big is the lactose-free cheese market?

The lactose-free cheese market is set to reach nearly US$ 676.3 Mn by 2022.

What is the North America lactose-free cheese market outlook?

The North America lactose-free cheese market is expected to register 6.8% CAGR between 2022 and 2032.

At what rate will the lactose-free cheese market grow in Europe?

The lactose-free cheese market is expected to grow at 7.0% CAGR between 2022 and 2032.

At what rate will the lactose-free cheese market grow in Japan?

The Japan lactose-free cheese market will grow at 8.6% CAGR between 2022 and 2032.

At what rate will the lactose-free cheese market grow in India?

The India lactose-free cheese market will grow at 9.7% CAGR between 2022 and 2032.

Table of Content
1. Executive Summary

    1.1. Global Market Outlook

    1.2. Demand-side Trends

    1.3. Supply-side Trends

    1.4. Technology Roadmap Analysis

    1.5. Analysis and Recommendations

2. Market Overview

    2.1. Market Coverage / Taxonomy

    2.2. Market Definition / Scope / Limitations

3. Market Background

    3.1. Market Dynamics

        3.1.1. Drivers

        3.1.2. Restraints

        3.1.3. Opportunity

        3.1.4. Trends

    3.2. Scenario Forecast

        3.2.1. Demand in Optimistic Scenario

        3.2.2. Demand in Likely Scenario

        3.2.3. Demand in Conservative Scenario

    3.3. Product launches & Recent Developments

    3.4. Product Life Cycle Analysis

    3.5. Value Chain Analysis

        3.5.1. Supply Side Participants and their Roles

            3.5.1.1. Producers

            3.5.1.2. Mid-Level Participants (Traders/ Agents/ Brokers)

            3.5.1.3. Wholesalers and Distributors

        3.5.2. % of Operating Margin Analysis

        3.5.3. List of Raw Material Suppliers

        3.5.4. List of Existing and Potential Buyer’s

    3.6. Global Drinkable Yogurt Market - Pricing Analysis

        3.6.1. Price Point Assessment by Region

        3.6.2. Price Point Assessment by Product Type

        3.6.3. Price Forecast till 2032

        3.6.4. Factors affecting Pricing

    3.7. Forecast Factors - Relevance & Impact

    3.8. Regulatory Landscape

        3.8.1. Packaging & Labelling Regulations

        3.8.2. Certifications and Certifying Agency Overview

        3.8.3. Import/Export Policies

    3.9. Regional Parent Market Outlook

    3.10. Consumers Survey Analysis

    3.11. Macro-Economic Factors

    3.12. Product Claims & Nutritional Information Scan by Buyers

4. Global Analysis 2016-2021 and Forecast, 2022-2032

    4.1. Historical Market Size Value (US$ Mn) & Volume (MT) Analysis, 2016-2021

    4.2. Current and Future Market Size Value (US$ Mn) & Volume (MT) Projections, 2022-2032

        4.2.1. Y-o-Y Growth Trend Analysis

        4.2.2. Absolute $ Opportunity Analysis

5. Global Analysis 2016-2021 and Forecast 2022-2032, By Product Type

    5.1. Introduction / Key Findings

    5.2. Historical Market Size Value (US$ Mn) & Volume (MT) Analysis By Product Type, 2016-2021

    5.3. Current and Future Market Size Value (US$ Mn) & Volume (MT) Analysis and Forecast By Product Type, 2022-2032

        5.3.1. Blue Cheese

        5.3.2. Brick Cheese

        5.3.3. Camembert Cheese

        5.3.4. Cheddar Cheese

        5.3.5. Cottage Cheese

        5.3.6. Cream Cheese

        5.3.7. Mozzarella Cheese

        5.3.8. Romano Cheese

        5.3.9. Swiss Cheese

        5.3.10. Other Processed Cheese

    5.4. Y-o-Y Growth Trend Analysis By Product Type, 2016-2021

    5.5. Absolute $ Opportunity Analysis By Product Type, 2022-2032

6. Global Analysis 2016-2021 and Forecast 2022-2032, By Form

    6.1. Introduction / Key Findings

    6.2. Historical Market Size Value (US$ Mn) & Volume (MT) Analysis By Form, 2016-2021

    6.3. Current and Future Market Size Value (US$ Mn) & Volume (MT) Analysis and Forecast By Form, 2022-2032

        6.3.1. Cheese Blocks

        6.3.2. Triangle

        6.3.3. Rectangle

        6.3.4. Circle

        6.3.5. Square

        6.3.6. Cheese Slice

        6.3.7. Cheese Spread

        6.3.8. Cheese Spray

    6.4. Y-o-Y Growth Trend Analysis By Form, 2016-2021

    6.5. Absolute $ Opportunity Analysis By Form, 2022-2032

7. Global Analysis 2016-2021 and Forecast 2022-2032, By Distribution Channel

    7.1. Introduction / Key Findings

    7.2. Historical Market Size Value (US$ Mn) & Volume (MT) Analysis By Distribution Channel, 2016-2021

    7.3. Current and Future Market Size Value (US$ Mn) & Volume (MT) Analysis and Forecast By Distribution Channel, 2022-2032

        7.3.1. B2B

        7.3.2. B2C

            7.3.2.1. Hypermarkets/Supermarkets

            7.3.2.2. Convenience Stores

            7.3.2.3. Specialty Stores

            7.3.2.4. Traditional Groceries

            7.3.2.5. Online Retailers

    7.4. Y-o-Y Growth Trend Analysis By Distribution Channel, 2016-2021

    7.5. Absolute $ Opportunity Analysis By Distribution Channel, 2022-2032

8. Global Analysis 2016-2021 and Forecast 2022-2032, By Region

    8.1. Introduction

    8.2. Historical Market Size Value (US$ Mn) & Volume (MT) Analysis By Region, 2016-2021

    8.3. Current Market Size Value (US$ Mn) & Volume (MT) Analysis and Forecast By Region, 2022-2032

        8.3.1. North America

        8.3.2. Latin America

        8.3.3. Europe

        8.3.4. East Asia

        8.3.5. South Asia

        8.3.6. Oceania

        8.3.7. MEA

    8.4. Market Attractiveness Analysis By Region

9. North America Analysis 2016-2021 and Forecast 2022-2032, By Country

    9.1. Historical Market Size Value (US$ Mn) & Volume (MT) Trend Analysis By Market Taxonomy, 2016-2021

    9.2. Market Size Value (US$ Mn) & Volume (MT) Forecast By Market Taxonomy, 2022-2032

        9.2.1. By Country

            9.2.1.1. U.S.

            9.2.1.2. Canada

        9.2.2. By Product Type

        9.2.3. By Form

        9.2.4. By Distribution Channel

    9.3. Market Attractiveness Analysis

        9.3.1. By Country

        9.3.2. By Product Type

        9.3.3. By Form

        9.3.4. By Distribution Channel

    9.4. Key Takeaways

10. Latin America Analysis 2016-2021 and Forecast 2022-2032, By Country

    10.1. Historical Market Size Value (US$ Mn) & Volume (MT) Trend Analysis By Market Taxonomy, 2016-2021

    10.2. Market Size Value (US$ Mn) & Volume (MT) Forecast By Market Taxonomy, 2022-2032

        10.2.1. By Country

            10.2.1.1. Brazil

            10.2.1.2. Mexico

            10.2.1.3. Argentina

            10.2.1.4. Chile

            10.2.1.5. Peru

            10.2.1.6. Rest of Latin America

        10.2.2. By Product Type

        10.2.3. By Form

        10.2.4. By Distribution Channel

    10.3. Market Attractiveness Analysis

        10.3.1. By Country

        10.3.2. By Product Type

        10.3.3. By Form

        10.3.4. By Distribution Channel

    10.4. Key Takeaways

11. Europe Analysis 2016-2021 and Forecast 2022-2032, By Country

    11.1. Historical Market Size Value (US$ Mn) & Volume (MT) Trend Analysis By Market Taxonomy, 2016-2021

    11.2. Market Size Value (US$ Mn) & Volume (MT) Forecast By Market Taxonomy, 2022-2032

        11.2.1. By Country

            11.2.1.1. Germany

            11.2.1.2. Italy

            11.2.1.3. France

            11.2.1.4. U.K.

            11.2.1.5. Spain

            11.2.1.6. Russia

            11.2.1.7. BENELUX

            11.2.1.8. Poland

            11.2.1.9. Nordic Countries

            11.2.1.10. Rest of Europe

        11.2.2. By Product Type

        11.2.3. By Form

        11.2.4. By Distribution Channel

    11.3. Market Attractiveness Analysis

        11.3.1. By Country

        11.3.2. By Product Type

        11.3.3. By Form

        11.3.4. By Distribution Channel

    11.4. Key Takeaways

12. East Asia Analysis 2016-2021 and Forecast 2022-2032, By Country

    12.1. Historical Market Size Value (US$ Mn) & Volume (MT) Trend Analysis By Market Taxonomy, 2016-2021

    12.2. Market Size Value (US$ Mn) & Volume (MT) Forecast By Market Taxonomy, 2022-2032

        12.2.1. By Country

            12.2.1.1. China

            12.2.1.2. Japan

            12.2.1.3. South Korea

        12.2.2. By Product Type

        12.2.3. By Form

        12.2.4. By Distribution Channel

    12.3. Market Attractiveness Analysis

        12.3.1. By Country

        12.3.2. By Product Type

        12.3.3. By Form

        12.3.4. By Distribution Channel

    12.4. Key Takeaways

13. South Asia Analysis 2016-2021 and Forecast 2022-2032, By Country

    13.1. Historical Market Size Value (US$ Mn) & Volume (MT) Trend Analysis By Market Taxonomy, 2016-2021

    13.2. Market Size Value (US$ Mn) & Volume (MT) Forecast By Market Taxonomy, 2022-2032

        13.2.1. By Country

            13.2.1.1. India

            13.2.1.2. Thailand

            13.2.1.3. Malaysia

            13.2.1.4. Indonesia

            13.2.1.5. Rest of South Asia

        13.2.2. By Product Type

        13.2.3. By Form

        13.2.4. By Distribution Channel

    13.3. Market Attractiveness Analysis

        13.3.1. By Country

        13.3.2. By Product Type

        13.3.3. By Form

        13.3.4. By Distribution Channel

    13.4. Key Takeaways

14. Oceania Analysis 2016-2021 and Forecast 2022-2032, By Country

    14.1. Historical Market Size Value (US$ Mn) & Volume (MT) Trend Analysis By Market Taxonomy, 2016-2021

    14.2. Market Size Value (US$ Mn) & Volume (MT) Forecast By Market Taxonomy, 2022-2032

        14.2.1. By Country

            14.2.1.1. Australia

            14.2.1.2. New Zealand

        14.2.2. By Product Type

        14.2.3. By Form

        14.2.4. By Distribution Channel

    14.3. Market Attractiveness Analysis

        14.3.1. By Country

        14.3.2. By Product Type

        14.3.3. By Form

        14.3.4. By Distribution Channel

    14.4. Key Takeaways

15. MEA Analysis 2016-2021 and Forecast 2022-2032, By Country

    15.1. Historical Market Size Value (US$ Mn) & Volume (MT) Trend Analysis By Market Taxonomy, 2016-2021

    15.2. Market Size Value (US$ Mn) & Volume (MT) Forecast By Market Taxonomy, 2022-2032

        15.2.1. By Country

            15.2.1.1. GCC Countries

            15.2.1.2. South Africa

            15.2.1.3. Central Africa

            15.2.1.4. North Africa

        15.2.2. By Product Type

        15.2.3. By Form

        15.2.4. By Distribution Channel

    15.3. Market Attractiveness Analysis

        15.3.1. By Country

        15.3.2. By Product Type

        15.3.3. By Form

        15.3.4. By Distribution Channel

    15.4. Key Takeaways

16. Key Countries Analysis

    16.1. U.S.

        16.1.1. Pricing Analysis

        16.1.2. Market Share Analysis, 2021

            16.1.2.1. By Product Type

            16.1.2.2. By Form

            16.1.2.3. By Distribution Channel

    16.2. Canada

        16.2.1. Pricing Analysis

        16.2.2. Market Share Analysis, 2021

            16.2.2.1. By Product Type

            16.2.2.2. By Form

            16.2.2.3. By Distribution Channel

    16.3. Brazil

        16.3.1. Pricing Analysis

        16.3.2. Market Share Analysis, 2021

            16.3.2.1. By Product Type

            16.3.2.2. By Form

            16.3.2.3. By Distribution Channel

    16.4. Mexico

        16.4.1. Pricing Analysis

        16.4.2. Market Share Analysis, 2021

            16.4.2.1. By Product Type

            16.4.2.2. By Form

            16.4.2.3. By Distribution Channel

    16.5. Argentina

        16.5.1. Pricing Analysis

        16.5.2. Market Share Analysis, 2021

            16.5.2.1. By Product Type

            16.5.2.2. By Form

            16.5.2.3. By Distribution Channel

    16.6. Chile

        16.6.1. Pricing Analysis

        16.6.2. Market Share Analysis, 2021

            16.6.2.1. By Product Type

            16.6.2.2. By Form

            16.6.2.3. By Distribution Channel

    16.7. Peru

        16.7.1. Pricing Analysis

        16.7.2. Market Share Analysis, 2021

            16.7.2.1. By Product Type

            16.7.2.2. By Form

            16.7.2.3. By Distribution Channel

    16.8. Germany

        16.8.1. Pricing Analysis

        16.8.2. Market Share Analysis, 2021

            16.8.2.1. By Product Type

            16.8.2.2. By Form

            16.8.2.3. By Distribution Channel

    16.9. Italy

        16.9.1. Pricing Analysis

        16.9.2. Market Share Analysis, 2021

            16.9.2.1. By Product Type

            16.9.2.2. By Form

            16.9.2.3. By Distribution Channel

    16.10. France

        16.10.1. Pricing Analysis

        16.10.2. Market Share Analysis, 2021

            16.10.2.1. By Product Type

            16.10.2.2. By Form

            16.10.2.3. By Distribution Channel

    16.11. Spain

        16.11.1. Pricing Analysis

        16.11.2. Market Share Analysis, 2021

            16.11.2.1. By Product Type

            16.11.2.2. By Form

            16.11.2.3. By Distribution Channel

    16.12. U.K.

        16.12.1. Pricing Analysis

        16.12.2. Market Share Analysis, 2021

            16.12.2.1. By Product Type

            16.12.2.2. By Form

            16.12.2.3. By Distribution Channel

    16.13. Russia

        16.13.1. Pricing Analysis

        16.13.2. Market Share Analysis, 2021

            16.13.2.1. By Product Type

            16.13.2.2. By Form

            16.13.2.3. By Distribution Channel

    16.14. Poland

        16.14.1. Pricing Analysis

        16.14.2. Market Share Analysis, 2021

            16.14.2.1. By Product Type

            16.14.2.2. By Form

            16.14.2.3. By Distribution Channel

    16.15. BENELUX

        16.15.1. Pricing Analysis

        16.15.2. Market Share Analysis, 2021

            16.15.2.1. By Product Type

            16.15.2.2. By Form

            16.15.2.3. By Distribution Channel

    16.16. Nordic Countries

        16.16.1. Pricing Analysis

        16.16.2. Market Share Analysis, 2021

            16.16.2.1. By Product Type

            16.16.2.2. By Form

            16.16.2.3. By Distribution Channel

    16.17. China

        16.17.1. Pricing Analysis

        16.17.2. Market Share Analysis, 2021

            16.17.2.1. By Product Type

            16.17.2.2. By Form

            16.17.2.3. By Distribution Channel

    16.18. Japan

        16.18.1. Pricing Analysis

        16.18.2. Market Share Analysis, 2021

            16.18.2.1. By Product Type

            16.18.2.2. By Form

            16.18.2.3. By Distribution Channel

    16.19. South Korea

        16.19.1. Pricing Analysis

        16.19.2. Market Share Analysis, 2021

            16.19.2.1. By Product Type

            16.19.2.2. By Form

            16.19.2.3. By Distribution Channel

    16.20. India

        16.20.1. Pricing Analysis

        16.20.2. Market Share Analysis, 2021

            16.20.2.1. By Product Type

            16.20.2.2. By Form

            16.20.2.3. By Distribution Channel

    16.21. Thailand

        16.21.1. Pricing Analysis

        16.21.2. Market Share Analysis, 2021

            16.21.2.1. By Product Type

            16.21.2.2. By Form

            16.21.2.3. By Distribution Channel

    16.22. Indonesia

        16.22.1. Pricing Analysis

        16.22.2. Market Share Analysis, 2021

            16.22.2.1. By Product Type

            16.22.2.2. By Form

            16.22.2.3. By Distribution Channel

    16.23. Malaysia

        16.23.1. Pricing Analysis

        16.23.2. Market Share Analysis, 2021

            16.23.2.1. By Product Type

            16.23.2.2. By Form

            16.23.2.3. By Distribution Channel

    16.24. Singapore

        16.24.1. Pricing Analysis

        16.24.2. Market Share Analysis, 2021

            16.24.2.1. By Product Type

            16.24.2.2. By Form

            16.24.2.3. By Distribution Channel

    16.25. GCC Countries

        16.25.1. Pricing Analysis

        16.25.2. Market Share Analysis, 2021

            16.25.2.1. By Product Type

            16.25.2.2. By Form

            16.25.2.3. By Distribution Channel

    16.26. South Africa

        16.26.1. Pricing Analysis

        16.26.2. Market Share Analysis, 2021

            16.26.2.1. By Product Type

            16.26.2.2. By Form

            16.26.2.3. By Distribution Channel

    16.27. Central Africa

        16.27.1. Pricing Analysis

        16.27.2. Market Share Analysis, 2021

            16.27.2.1. By Product Type

            16.27.2.2. By Form

            16.27.2.3. By Distribution Channel

    16.28. North Africa

        16.28.1. Pricing Analysis

        16.28.2. Market Share Analysis, 2021

            16.28.2.1. By Product Type

            16.28.2.2. By Form

            16.28.2.3. By Distribution Channel

17. Market Structure Analysis

    17.1. Competition Dashboard

    17.2. Competition Benchmarking

    17.3. Market Share Analysis of Top Players

        17.3.1. By Regional

        17.3.2. By Product Type

        17.3.3. By Form

        17.3.4. By Distribution Channel

18. Competition Analysis

    18.1. Competition Deep Dive

        18.1.1. Alpro UK Ltd.

            18.1.1.1. Overview

            18.1.1.2. Product Portfolio

            18.1.1.3. Profitability by Market Segments

            18.1.1.4. Sales Footprint

            18.1.1.5. Strategy Overview

                18.1.1.5.1. Marketing Strategy

                18.1.1.5.2. Product Strategy

                18.1.1.5.3. Channel Strategy

        18.1.2. Amy's Kitchen, Inc.

            18.1.2.1. Overview

            18.1.2.2. Product Portfolio

            18.1.2.3. Profitability by Market Segments

            18.1.2.4. Sales Footprint

            18.1.2.5. Strategy Overview

                18.1.2.5.1. Marketing Strategy

                18.1.2.5.2. Product Strategy

                18.1.2.5.3. Channel Strategy

        18.1.3. Arla Foods Amba

            18.1.3.1. Overview

            18.1.3.2. Product Portfolio

            18.1.3.3. Profitability by Market Segments

            18.1.3.4. Sales Footprint

            18.1.3.5. Strategy Overview

                18.1.3.5.1. Marketing Strategy

                18.1.3.5.2. Product Strategy

                18.1.3.5.3. Channel Strategy

        18.1.4. Barry Callebaut AG

            18.1.4.1. Overview

            18.1.4.2. Product Portfolio

            18.1.4.3. Profitability by Market Segments

            18.1.4.4. Sales Footprint

            18.1.4.5. Strategy Overview

                18.1.4.5.1. Marketing Strategy

                18.1.4.5.2. Product Strategy

                18.1.4.5.3. Channel Strategy

        18.1.5. Cargill, Inc.

            18.1.5.1. Overview

            18.1.5.2. Product Portfolio

            18.1.5.3. Profitability by Market Segments

            18.1.5.4. Sales Footprint

            18.1.5.5. Strategy Overview

                18.1.5.5.1. Marketing Strategy

                18.1.5.5.2. Product Strategy

                18.1.5.5.3. Channel Strategy

        18.1.6. Chr. Hansen Holdings A/S

            18.1.6.1. Overview

            18.1.6.2. Product Portfolio

            18.1.6.3. Profitability by Market Segments

            18.1.6.4. Sales Footprint

            18.1.6.5. Strategy Overview

                18.1.6.5.1. Marketing Strategy

                18.1.6.5.2. Product Strategy

                18.1.6.5.3. Channel Strategy

        18.1.7. Daiya Foods, Inc.

            18.1.7.1. Overview

            18.1.7.2. Product Portfolio

            18.1.7.3. Profitability by Market Segments

            18.1.7.4. Sales Footprint

            18.1.7.5. Strategy Overview

                18.1.7.5.1. Marketing Strategy

                18.1.7.5.2. Product Strategy

                18.1.7.5.3. Channel Strategy

        18.1.8. Dean Foods Company

            18.1.8.1. Overview

            18.1.8.2. Product Portfolio

            18.1.8.3. Profitability by Market Segments

            18.1.8.4. Sales Footprint

            18.1.8.5. Strategy Overview

                18.1.8.5.1. Marketing Strategy

                18.1.8.5.2. Product Strategy

                18.1.8.5.3. Channel Strategy

        18.1.9. Edlong Dairy Technologies

            18.1.9.1. Overview

            18.1.9.2. Product Portfolio

            18.1.9.3. Profitability by Market Segments

            18.1.9.4. Sales Footprint

            18.1.9.5. Strategy Overview

                18.1.9.5.1. Marketing Strategy

                18.1.9.5.2. Product Strategy

                18.1.9.5.3. Channel Strategy

        18.1.10. Emmi AG

            18.1.10.1. Overview

            18.1.10.2. Product Portfolio

            18.1.10.3. Profitability by Market Segments

            18.1.10.4. Sales Footprint

            18.1.10.5. Strategy Overview

                18.1.10.5.1. Marketing Strategy

                18.1.10.5.2. Product Strategy

                18.1.10.5.3. Channel Strategy

        18.1.11. Fonterra Co-operative Group Ltd.

            18.1.11.1. Overview

            18.1.11.2. Product Portfolio

            18.1.11.3. Profitability by Market Segments

            18.1.11.4. Sales Footprint

            18.1.11.5. Strategy Overview

                18.1.11.5.1. Marketing Strategy

                18.1.11.5.2. Product Strategy

                18.1.11.5.3. Channel Strategy

        18.1.12. Galaxy Nutritional Foods, Inc.

            18.1.12.1. Overview

            18.1.12.2. Product Portfolio

            18.1.12.3. Profitability by Market Segments

            18.1.12.4. Sales Footprint

            18.1.12.5. Strategy Overview

                18.1.12.5.1. Marketing Strategy

                18.1.12.5.2. Product Strategy

                18.1.12.5.3. Channel Strategy

        18.1.13. General Mills, Inc.

            18.1.13.1. Overview

            18.1.13.2. Product Portfolio

            18.1.13.3. Profitability by Market Segments

            18.1.13.4. Sales Footprint

            18.1.13.5. Strategy Overview

                18.1.13.5.1. Marketing Strategy

                18.1.13.5.2. Product Strategy

                18.1.13.5.3. Channel Strategy

        18.1.14. Green Valley Organics

            18.1.14.1. Overview

            18.1.14.2. Product Portfolio

            18.1.14.3. Profitability by Market Segments

            18.1.14.4. Sales Footprint

            18.1.14.5. Strategy Overview

                18.1.14.5.1. Marketing Strategy

                18.1.14.5.2. Product Strategy

                18.1.14.5.3. Channel Strategy

        18.1.15. HP Hood LLC

            18.1.15.1. Overview

            18.1.15.2. Product Portfolio

            18.1.15.3. Profitability by Market Segments

            18.1.15.4. Sales Footprint

            18.1.15.5. Strategy Overview

                18.1.15.5.1. Marketing Strategy

                18.1.15.5.2. Product Strategy

                18.1.15.5.3. Channel Strategy

        18.1.16. Land O'Lakes, Inc.

            18.1.16.1. Overview

            18.1.16.2. Product Portfolio

            18.1.16.3. Profitability by Market Segments

            18.1.16.4. Sales Footprint

            18.1.16.5. Strategy Overview

                18.1.16.5.1. Marketing Strategy

                18.1.16.5.2. Product Strategy

                18.1.16.5.3. Channel Strategy

        18.1.17. Murray Goulburn Co-operative Co. Limited (Devondale Murray Goulburn)

            18.1.17.1. Overview

            18.1.17.2. Product Portfolio

            18.1.17.3. Profitability by Market Segments

            18.1.17.4. Sales Footprint

            18.1.17.5. Strategy Overview

                18.1.17.5.1. Marketing Strategy

                18.1.17.5.2. Product Strategy

                18.1.17.5.3. Channel Strategy

        18.1.18. Tine AS

            18.1.18.1. Overview

            18.1.18.2. Product Portfolio

            18.1.18.3. Profitability by Market Segments

            18.1.18.4. Sales Footprint

            18.1.18.5. Strategy Overview

                18.1.18.5.1. Marketing Strategy

                18.1.18.5.2. Product Strategy

                18.1.18.5.3. Channel Strategy

        18.1.19. WhiteWave Foods Company

            18.1.19.1. Overview

            18.1.19.2. Product Portfolio

            18.1.19.3. Profitability by Market Segments

            18.1.19.4. Sales Footprint

            18.1.19.5. Strategy Overview

                18.1.19.5.1. Marketing Strategy

                18.1.19.5.2. Product Strategy

                18.1.19.5.3. Channel Strategy

        18.1.20. Others

            18.1.20.1. Overview

            18.1.20.2. Product Portfolio

            18.1.20.3. Profitability by Market Segments

            18.1.20.4. Sales Footprint

            18.1.20.5. Strategy Overview

                18.1.20.5.1. Marketing Strategy

                18.1.20.5.2. Product Strategy

                18.1.20.5.3. Channel Strategy

19. Assumptions & Acronyms Used

20. Research Methodology
Recommendations

Food and Beverage

Cheese Analogue Market

September 2022

REP-GB-15569

July 2023

315 pages

Food and Beverage

Cheese Concentrates Market

January 2018

REP-GB-6066

July 2023

306 pages

Food and Beverage

Cheese Market

March 2022

REP-IN-242

February 2023

313 pages

Explore Food and Beverage Insights

View Reports
Future Market Insights

Lactose-free Cheese Market