Marine Plankton Extracts Market Size and Share Forecast Outlook 2025 to 2035

A valuation of USD 1,052.7 million has been projected for the marine plankton extracts market in 2025, while by 2035, the market is anticipated to reach USD 3,607.2 million. This translates into an absolute increase of USD 2,554.5 million over the decade, reflecting a robust expansion trajectory. The overall growth corresponds to a CAGR of 13.1%, signaling a market size that is expected to more than triple within ten years.
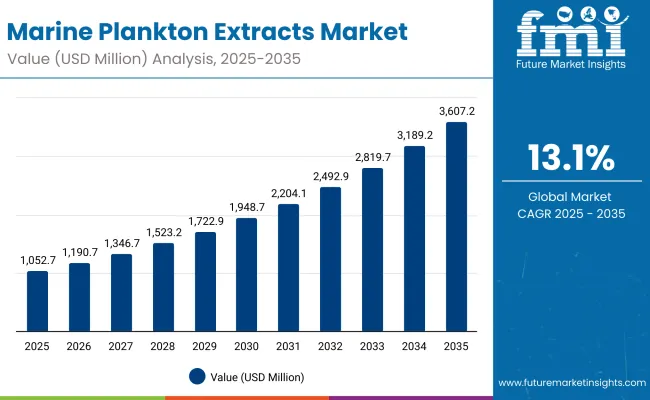
Quick Stats for Marine Plankton Extracts Market

  • Marine Plankton Extracts Market Value (2025): USD 1,052.7 million
  • Marine Plankton Extracts Market Forecast Value (2035): USD 3,607.2 million
  • Marine Plankton Extracts Market Forecast CAGR: 13.1%
  • Leading Segment in Marine Plankton Extracts Market in 2025: Anti-aging (48.5%)
  • Key Growth Regions in the Marine Plankton Extracts Market: Asia-Pacific, Europe, North America
  • Top Key Players in Marine Plankton Extracts Market: Codif, Greentech, BASF, DSM-Firmenich, Ashland, Seppic, Solabia, Algatech, BiotechMarine, Croda

Marine Plankton Extracts Market

Marine Plankton Extracts Market Key Takeaways

Metric Value
Market Estimated Value in (2025E) USD 1,052.7 million
Market Forecast Value in (2035F) USD 3,607.2 million
Forecast CAGR (2025 to 2035) 13.10%

During the first five-year horizon from 2025 to 2030, the market is forecast to increase from USD 1,052.7 million to USD 1,948.7 million. This incremental gain of USD 896 million will account for more than one-third of total decade growth. This period is likely to be marked by steady adoption across cosmetics, personal care, and wellness-driven formulations, particularly supported by early consumer preference for natural anti-aging and hydration actives.

In the subsequent phase between 2030 and 2035, expansion is expected to accelerate as the market climbs from USD 1,948.7 million to USD 3,607.2 million. This leap of USD 1,658.5 million will represent nearly two-thirds of the decade’s incremental value. Growth during this stage is projected to be powered by greater penetration of marine biotechnology, scale-up in nutraceutical applications, and premium skincare adoption in emerging economies. The forecast highlights a decisive shift toward sustainable sourcing and high-efficacy marine extracts, which will reinforce market leadership for innovators able to combine scientific validation with transparent supply chains.

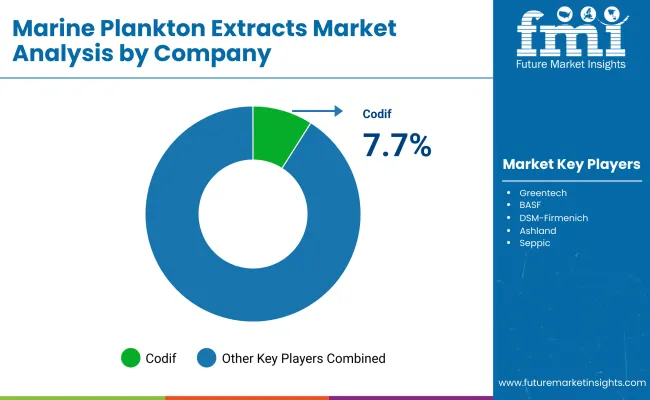
From 2020 to 2024, the Marine Plankton Extracts Market steadily expanded, reflecting early adoption of marine-derived actives in premium skincare and nutraceuticals. By 2025, the market is projected to surpass USD 1,052.7 million, fueled by innovation in bioactive extraction and sustainability-led consumer preferences. Historically, leadership has been concentrated among specialized marine biotechnology firms, with Codif maintaining the largest identified share at 7.7% in 2025. Competitive differentiation has been reliant on scientific validation, sustainable sourcing, and transparent supply chains rather than scale alone.

Between 2025 and 2035, revenue distribution is expected to shift as multifunctional applications in personal care and wellness strengthen demand. Leading players are anticipated to integrate biotechnology, clinical substantiation, and premium positioning to sustain competitiveness, while mid-sized innovators will focus on agility, customization, and brand partnerships to secure growth.

Why the Marine Plankton Extracts Market is growing?

growth in the marine plankton extracts market is being driven by rising demand for bio-based and sustainable ingredients, supported by increasing consumer awareness of natural skincare and wellness solutions. Strong interest in anti-aging and hydration benefits has positioned marine extracts as premium actives in cosmetics and nutraceuticals. Advances in marine biotechnology have enabled higher-yield extraction and improved stability of bioactive compounds, strengthening product efficacy and market confidence.

Adoption has been further encouraged by the clean-label movement, where brands are aligning with consumer expectations for transparency and traceability. Expanding applications across serums, creams, and functional supplements are expected to diversify revenue streams. Favorable regulatory support for natural ingredients and growing investment in research collaborations are projected to accelerate innovation pipelines. Emerging economies are anticipated to play a critical role, where rising disposable incomes and rapid urbanization are set to amplify premium product consumption. The combined influence of sustainability, science-led innovation, and consumer-driven demand is expected to secure long-term growth momentum.

Segmental Analysis

The marine plankton extracts market has been segmented across multiple dimensions to provide a clear perspective on growth dynamics. Segmentation is based on function, channel, and ceramide type, highlighting the primary areas shaping demand patterns. Functional benefits such as anti-aging and hydration are driving consumer alignment toward premium skincare, while distribution channels distinguish between B2B ingredient integration and consumer-facing retail. Additionally, ceramide types highlight innovation pathways where synthetic and other formulations compete for market relevance. Each segment demonstrates a distinct trajectory, offering insights into value capture opportunities and competitive positioning over the forecast period.
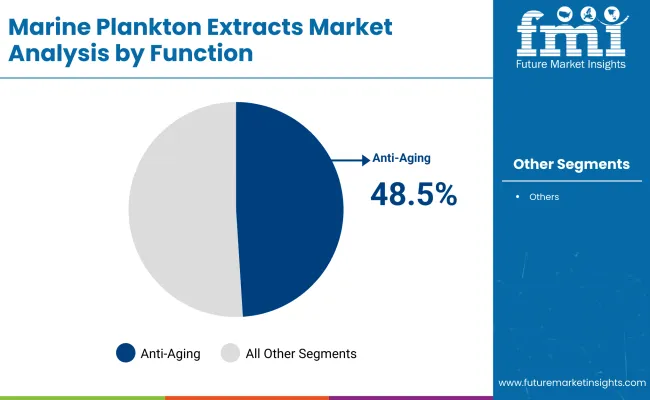
Insights into the Function Segment with Anti-aging Leading Demand

Marine Plankton Extracts Market By Function

Segment Market Value Share, 2025
Anti-aging 48.5%
Others 51.5%

Anti-aging is expected to capture 48.5% of the functional segment in 2025, equivalent to USD 509.9 million, while other applications account for 51.5%. This near-equal distribution highlights a balanced yet competitive landscape. Anti-aging demand is being fueled by growing consumer investment in natural actives that combat early signs of aging, supported by plankton-derived peptides and antioxidants.

Preventive skincare adoption among younger populations has strengthened the category, while older demographics continue to anchor growth through anti-wrinkle and skin-firming needs. Scientific validation and increasing clinical trials are reinforcing efficacy claims, enabling stronger brand positioning. Over the forecast horizon, anti-aging is projected to remain the defining growth axis of the marine plankton extracts market, consolidating its position as a high-value functional category.
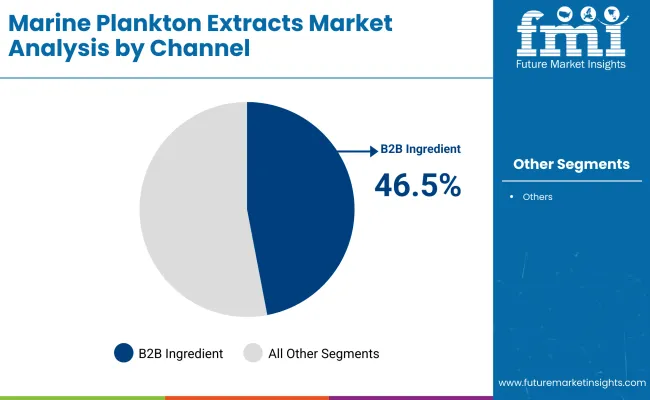
Insights into the Channel Segment with B2B Ingredients Driving Adoption

Marine Plankton Extracts Market By Channel

Segment Market Value Share, 2025
B2B ingredients 46.5%
Others 53.5%

B2B ingredients are forecast to hold 46.5% of channel sales in 2025, valued at USD 489.1 million, while others contribute 53.5%. This split underscores the vital role of ingredient integration in driving demand for marine plankton extracts. The B2B channel is being strengthened by collaborations between suppliers and global cosmetics and nutraceutical brands, enabling standardized adoption of high-performance marine actives. Sustainable sourcing, ingredient traceability, and certification requirements are further elevating B2B’s strategic importance. Strong partnerships are expected to ensure recurring demand pipelines, particularly as personalization and premiumization trends intensify. Over the forecast period, B2B ingredients are projected to maintain their role as a stable growth driver, anchoring market expansion across multiple product categories worldwide.
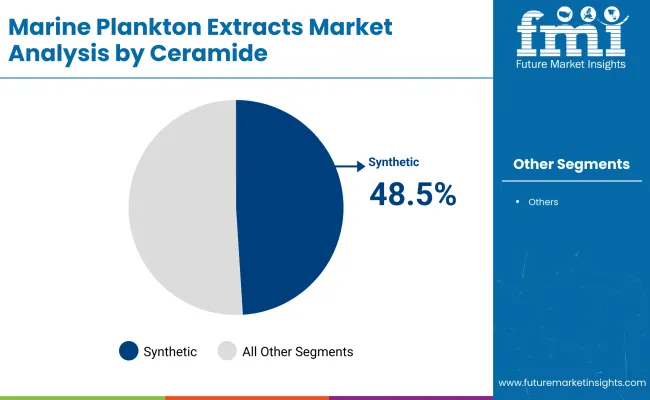
Insights into the Ceramide Type Segment with Synthetic Formulations Showing Strength

Marine Plankton Extracts Market By Ceramide

Segment Market Value Share, 2025
Synthetic 48.5%
Others 51.5%

Synthetic ceramides are projected to represent 48.5% of the ceramide type segment in 2025, amounting to USD 1,406.8 million, while other types account for 51.5%. This robust share demonstrates strong reliance on synthetic formulations within marine plankton extracts. Their advantages lie in scalability, stability, and proven reliability across diverse cosmetic and personal care applications. Advanced bioengineering has enabled synthetic ceramides to closely replicate natural lipid functions, strengthening their role in hydration and skin barrier repair. These attributes are encouraging wider industry adoption, particularly among global manufacturers seeking uniform quality and regulatory compliance. Looking forward, synthetic ceramides are anticipated to maintain resilience against natural alternatives, establishing themselves as a key pillar in marine plankton-based innovation.

What are the Drivers, Restraints, and Key Trends of the Marine Plankton Extracts Market?

While scalability challenges and formulation complexities persist, opportunities are being reshaped by biotechnology breakthroughs, premium skincare adoption, and sustainability commitments, which are redefining the global marine plankton extracts market across cosmetic, nutraceutical, and wellness-driven industries.

Advancements in Marine Biotechnology

Expansion in the marine plankton extracts market is being catalyzed by innovations in biotechnology, where enhanced photobioreactor systems and precision fermentation are enabling cost-efficient and high-yield extraction of bioactive compounds. These advances have improved consistency, stability, and concentration of functional molecules, strengthening the scientific credibility of marine actives. As biotechnology platforms integrate with AI-enabled bioinformatics, more precise screening of plankton strains is being conducted to identify peptides and lipids with superior anti-aging and hydration performance. Over the forecast horizon, such advances are expected to create a pipeline of novel extracts with verifiable efficacy, which will help manufacturers differentiate in crowded skincare and nutraceutical markets.

Supply Chain Vulnerabilities Linked to Ocean Ecology

Growth prospects are constrained by ecological and supply chain vulnerabilities, as ocean biodiversity and plankton biomass remain sensitive to climate change, rising ocean temperatures, and microplastic pollution. These environmental pressures are introducing volatility in raw material sourcing, which can destabilize long-term supply security. Dependence on marine ecosystems without sufficient synthetic or lab-cultivated alternatives exposes manufacturers to reputational and regulatory risks.

Stricter environmental governance and marine conservation policies are expected to intensify compliance burdens, requiring significant investment in sustainable harvesting or bioengineered substitutes. Unless mitigated by closed-loop cultivation systems and traceable sourcing models, these vulnerabilities may limit scalability and restrain broader adoption in mainstream product categories.
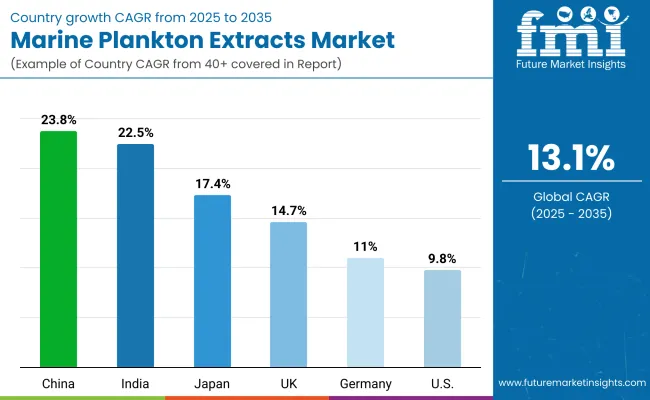
Analysis of Marine Plankton Extracts Market By Key Countries

Marine Plankton Extracts Market By Country

Countries CAGR
China 23.8%
USA 9.8%
India 22.5%
UK 14.7%
Germany 11.0%
Japan 17.4%

The global marine plankton extracts market is expected to advance unevenly across countries, with adoption shaped by biotechnology investments, sustainability policies, and consumer alignment with natural actives. Asia is projected to emerge as the fastest-growing hub, led by China at a CAGR of 23.8% and India at 22.5%. China’s rapid growth will be underpinned by strong government backing for marine biotechnology, expanding cosmetic manufacturing bases, and consumer preference for premium natural formulations. India’s trajectory is likely to reflect a combination of rising urban incomes, large-scale personal care manufacturing, and fast-moving nutraceutical adoption.

Japan is projected to achieve 17.4% CAGR, supported by advanced skincare markets and high receptivity to scientifically validated marine actives. The UK, at 14.7% CAGR, is anticipated to strengthen through regulatory alignment with sustainable cosmetics and innovation in premium wellness segments. Germany, with an 11.0% CAGR, is expected to maintain momentum through its strong dermocosmetic and pharmaceutical industries, though growth will remain comparatively moderate. In contrast, the USA market is forecast to expand at 9.8%, reflecting a mature landscape where growth will be primarily driven by wellness-focused formulations and clean-label preferences. Overall, Asia-Pacific is positioned to define future global leadership, while Europe and North America sustain complementary roles.
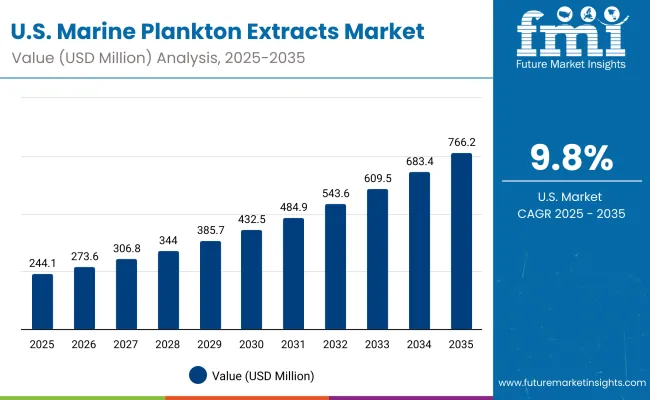
Sales Outlook for Marine Plankton Extracts in the United States

Marine Plankton Extracts Market Usa

Year USA Marine Plankton Extracts Market (USD Million)
2025 244.11
2026 273.69
2027 306.86
2028 344.05
2029 385.75
2030 432.5
2031 484.92
2032 543.68
2033 609.57
2034 683.45
2035 766.28

The marine plankton extracts market in the United States is projected to expand at a CAGR of 9.8% from 2025 to 2035, increasing from USD 244.11 million in 2025 to USD 766.28 million by 2035. Growth is expected to be guided by rising consumer alignment with sustainable skincare, the adoption of natural nutraceuticals, and the integration of marine bioactives into premium product portfolios. Early adoption of anti-aging and hydration applications has positioned the USA as a key innovation hub, with formulators prioritizing clinically validated extracts. Strategic opportunities are anticipated in wellness-driven categories, where consumers are increasingly seeking multifunctional solutions that combine health and beauty benefits. Regulatory emphasis on clean-label compliance is projected to reinforce market credibility, while collaborations between biotechnology companies and cosmetic brands are expected to drive product differentiation.

  • Anti-aging and hydration actives are projected to dominate USA adoption due to strong clinical validation.
  • Partnerships between biotech innovators and leading cosmetic brands are anticipated to accelerate premiumization and market share consolidation.

Growth and Expansion Outlook for Marine Plankton Extracts Market in the United Kingdom

The marine plankton extracts market in the United Kingdom is projected to grow at a CAGR of 14.7% between 2025 and 2035, reflecting steady advancement supported by sustainability commitments and premium product adoption. Expansion is expected to be shaped by the integration of marine actives into high-end skincare and wellness formulations, with consumers demonstrating strong loyalty to clean-label and eco-certified products. Innovation is anticipated to be supported by the UK’s advanced R&D ecosystem and regulatory frameworks favoring natural cosmetics. Growth momentum will also be reinforced by retail channels, particularly e-commerce, where premium cosmetic lines are achieving broader reach.

  • Clean-label compliance is anticipated to shape market competitiveness in the UK.
  • Premium skincare and wellness brands are projected to dominate early adoption.
  • E-commerce distribution is expected to accelerate ingredient penetration. Regulatory emphasis on sustainable actives is likely to foster product trust.

Growth and Expansion Outlook for Marine Plankton Extracts Market in India

The marine plankton extracts market in India is forecast to expand at a CAGR of 22.5% from 2025 to 2035, making it one of the fastest-growing global markets. Expansion is being driven by rapid growth in personal care manufacturing, an emerging nutraceutical ecosystem, and rising urban consumer incomes. Strong opportunities are anticipated as international brands expand local sourcing partnerships and domestic players incorporate marine actives into value-added formulations. Government initiatives supporting biotechnology innovation are expected to further accelerate adoption, while evolving consumer preference for natural anti-aging and hydration solutions will strengthen product uptake.

  • India is positioned as a high-growth hub with rapid domestic manufacturing scale-up.
  • Nutraceutical applications are projected to drive diversification of demand.
  • Biotechnology initiatives are anticipated to strengthen innovation capacity.
  • Premiumization trends in urban markets are expected to fuel revenue growth.

Sales Outlook for Marine Plankton Extracts in China

The marine plankton extracts market in China is projected to record a CAGR of 23.8% between 2025 and 2035, the highest among key markets. Growth is expected to be anchored by government-backed marine biotechnology programs, consumer readiness for premium skincare, and large-scale cosmetics production ecosystems. Strong opportunities are anticipated as domestic brands scale up marine-derived actives, while international companies invest in partnerships to strengthen supply security and innovation pipelines. Rapid adoption in anti-aging and brightening segments is forecast to support revenue leadership, while the nutraceutical sector provides additional avenues for product integration.
  • China’s biotechnology programs are expected to drive long-term scalability.
  • Premium skincare categories are projected to be early adoption leaders.
  • Domestic and global partnerships are anticipated to enhance supply resilience.
  • Nutraceutical adoption is likely to broaden demand beyond cosmetics.

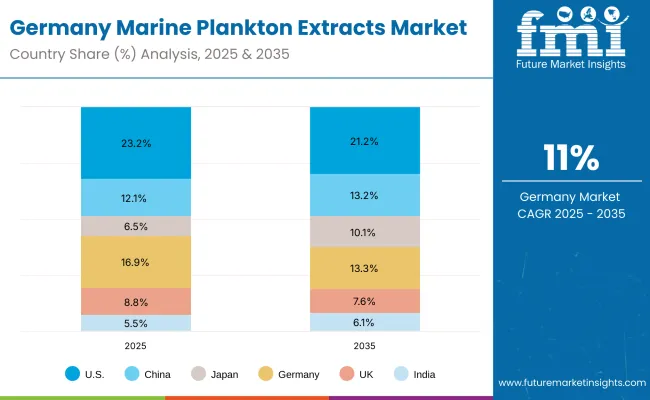
In-depth Analysis of Marine Plankton Extracts in Germany

Marine Plankton Extracts Market Germany

Countries 2025
USA 23.2%
China 12.1%
Japan 6.5%
Germany 16.9%
UK 8.8%
India 5.5%
Countries 2035
USA 21.2%
China 13.2%
Japan 10.1%
Germany 13.3%
UK 7.6%
India 6.1%

The marine plankton extracts market in Germany is expected to expand at a CAGR of 11.0% from 2025 to 2035, supported by strong dermocosmetic and pharmaceutical industries. Growth is anticipated to be reinforced by demand for clinically validated marine actives, which align with Germany’s tradition of science-driven product innovation. Pharmaceutical-grade formulations are likely to emerge as a competitive differentiator, particularly within anti-aging and hydration categories. Demand is also projected to be shaped by consumer prioritization of sustainability and traceable sourcing. Distribution through specialty pharmacies and retail chains is expected to maintain momentum, while e-commerce platforms expand visibility for premium marine-based brands.
  • Dermocosmetics and pharmaceuticals are projected to dominate Germany’s adoption patterns.
  • Clinical validation is expected to drive consumer trust and regulatory compliance.
  • Specialty pharmacy channels are anticipated to remain strong growth enablers.
  • Sustainability credentials are likely to strengthen premium positioning in the market.

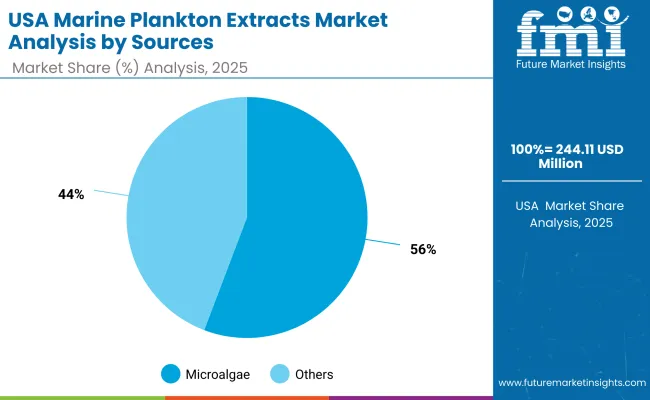
Growth Outlook for Marine Plankton Extracts Market in USA

Marine Plankton Extracts Market Usa 2

Segment Market Value Share, 2025
Microalgae 55.8%
Others 44.2%

The Marine Plankton Extracts Market in the United States is projected at USD 244.11 million in 2025. Microalgae contribute 55.8% of the value, while other sources hold 44.2%, signaling a strong preference for controlled, high-purity bioactive ingredients. This microalgae dominance is expected to be reinforced as closed photobioreactor cultivation becomes more cost-efficient and as brands increasingly favor traceable and sustainable ingredient supply chains. The value shift toward microalgae is also anticipated to be accelerated by the growing demand for reproducible bioactivity profiles, which are critical for efficacy claims in anti-aging and hydration formulations.

The market outlook indicates that microalgae-based extracts will continue to benefit from their superior yield consistency and lower contamination risk, positioning them as the preferred input for premium dermocosmetic and cosmeceutical products. Others, while still significant, are expected to serve niche applications and cost-driven formulations but may lose share over time as innovation pipelines increasingly favor microalgae strains with novel functional properties.

Rising adoption of clinical validation, digital consumer engagement, and science-backed claims is expected to support higher price realizations, especially for microalgae-derived actives. Increasing collaborations between USA personal care brands and biotech companies are projected to create differentiated ingredient systems with exclusive intellectual property rights, further elevating the segment’s value contribution. As sustainability disclosures become a prerequisite for retail listings, producers with verifiable carbon and biodiversity footprints are expected to command premium positioning.
  • The USA market accounts for 23.2% of global sales in 2025
  • Microalgae leads with 55.8% vs 44.2% for other sources
  • Growth supported by closed-system production, traceability demands, and brand focus on clinically proven anti-aging actives

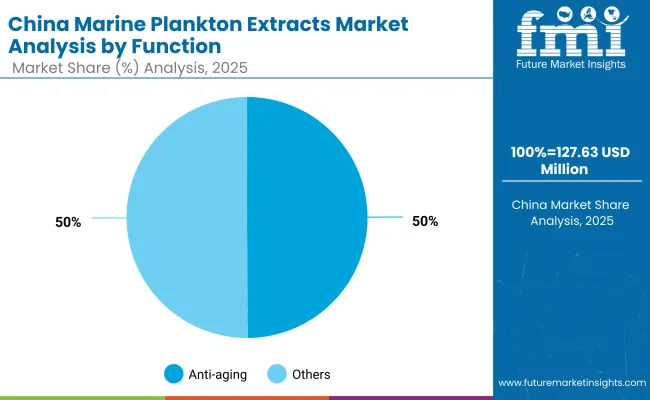
Opportunity Analysis of China Marine Plankton Extracts Market

Marine Plankton Extracts Market China

Segment Market Value Share, 2025
Anti-aging 49.9%
Others 50.1%

The Marine Plankton Extracts Market in China is projected at USD 127.63 million in 2025. Anti-aging applications contribute 49.9% (USD 63.7 million), while other functional uses account for 50.1% (USD 63.94 million), showing a nearly balanced demand pattern but signaling an imminent tilt toward anti-aging-driven growth. This slight edge toward anti-aging is expected to widen as premium skincare categories accelerate adoption of clinically proven marine bioactives to meet rising consumer expectations for performance, safety, and visible results.

The projected dominance of anti-aging functionality is being driven by a surge in dermocosmetic innovation and the increasing purchasing power of China’s aging but beauty-conscious population. The “skin health and longevity” narrative is expected to further boost demand, with marine plankton extracts positioned as potent natural sources of antioxidants, peptides, and essential micronutrients. This trend is likely to be amplified by a rapidly maturing regulatory framework that favors ingredients with robust safety and efficacy dossiers, providing a competitive advantage to suppliers investing in standardized and traceable production.

Consumer preference for premium anti-aging formulations is projected to support higher inclusion rates of marine plankton actives in serums, creams, and dermocosmetic supplements. Digital engagement and influencer-driven education are expected to accelerate awareness of marine-derived actives, pushing formulators to integrate these ingredients in high-efficacy product lines.

Rising investments in closed-system cultivation and local biotech collaborations are anticipated to reduce dependency on imports and improve cost efficiency, further stimulating domestic adoption. As China’s beauty and personal care market continues to premiumize, anti-aging formulations leveraging marine plankton extracts are expected to emerge as a critical differentiator for both domestic and global brands operating in the region.
  • China accounts for 12.1% of global market value in 2025
  • Anti-aging leads others slightly at 49.9% vs 50.1% but is expected to gain share by 2030
  • Growth supported by aging population, clinical validation, and rising demand for natural high-performance actives

Competitive Landscape of Marine Plankton Extracts Market

Marine Plankton Extracts Market By Company

The marine plankton extracts market is moderately fragmented, with global leaders, mid-sized innovators, and niche specialists competing across cosmetic, nutraceutical, and wellness applications. Global ingredient majors such as BASF, DSM-Firmenich, and Croda are positioned with broad portfolios, clinical substantiation programs, and ESG-led sourcing. Strategies are being steered toward traceable supply chains, photobioreactor scale-up, and co-development with multinational beauty brands to secure premium shelf space and regulatory confidence.

Established mid-sized players including Codif, Greentech, Seppic, and Ashland are anchoring growth through fast iteration, evidence-backed claims in anti-aging/hydration, and white-label partnerships with leading skincare houses. Strong emphasis is being placed on life-cycle assessments, INCI transparency, and data-rich dossiers to reduce brand risk and speed approvals.

Specialists such as Solabia, Algatech, and Biotech Marine are competing through microalgae expertise and application-specific actives, leveraging sustainability credentials and high-purity extraction to win in premium segments. Differentiation is expected to shift from ingredient lists to integrated ecosystems: authenticated sourcing, standardized bioactive titers, and post-launch surveillance linking efficacy to consumer outcomes.

Company relevance check: the listed firms (Codif, Greentech, BASF, DSM-Firmenich, Ashland, Seppic, Solabia, Algatech, BiotechMarine, Croda) are appropriate competitors for marine plankton-based actives.

Key Developments in Marine Plankton Extracts Market

  • In January 2025, a specification sheet for marine plankton extract was published by Making Cosmetics, detailing INCI composition, cold process extraction, and use-level recommendations, thereby enhancing formulation transparency and supporting broader adoption across skincare manufacturers.
  • In May 2025, “Blue Beauty” (marinederived skincare) was spotlighted in industry media, signaling rising mainstream endorsement of eco-friendly plankton ingredients rich in hydration and antioxidant benefits, which is expected to catalyze demand and innovation in marine extracts.

Scope of the Report

Item Value
Market size (2025) USD 1,052.7 million
Market size (2035) USD 3,607.2 million
CAGR (2025-2035) 13.10%
Incremental growth (2025-2035) USD 2,554.5 million
Sources covered Microalgae; Cyanobacteria; Phytoplankton
Function split (2025) Anti-aging 48.5% (USD 509.9 million); Others 51.5% (USD 542.04 million)
Product formats Serums; Creams; Masks; Powders
Channel split (2025) B2B ingredients 46.5% (USD 489.1 million); Others 53.5% (USD 562.88 million)
Ceramide type (2025) Synthetic 48.5%; Others 51.5%
Regions covered North America; Europe; East Asia; South Asia & Pacific; Latin America; Middle East & Africa
Countries covered United States; China; Japan; India; Germany; United Kingdom
High-growth countries (CAGR 2025-2035) China 23.8%; India 22.5%; Japan 17.4%; UK 14.7%; Germany 11.0%; USA 9.8%
Competitive landscape (2025) Codif 7.7% global value share; Others 92.3%
Key companies profiled Codif; Greentech; BASF; DSM-Firmenich; Ashland; Seppic; Solabia; Algatech; BiotechMarine; Croda
Additional scope notes Sustainability and traceability prioritized; photobioreactor/biotech scale-up expected; clinical validation and clean-label dossiers emphasized; premiumization across e-commerce and specialty retail anticipated; use cases anchored in anti-aging, hydration, brightening, and detox across personal care and nutraceuticals.

Key Segments

By Source:

  • Microalgae
  • Cyanobacteria
  • Phytoplankton

By Function:

  • Anti-aging
  • Hydration
  • Brightening
  • Detox

By Product Format:

  • Serums
  • Creams
  • Masks
  • Powders

By Channel:

  • E-commerce
  • Specialty retail
  • Pharmacies
  • B2B ingredients

By Region:

  • North America
  • Latin America
  • Europe
  • East Asia
  • South Asia & Pacific
  • Middle East and Africa

Table of Content

  1. Executive Summary
    • Global Market Outlook
    • Demand-side Trends
    • Supply-side Trends
    • Technology Roadmap Analysis
    • Analysis and Recommendations
  2. Market Overview
    • Market Coverage / Taxonomy
    • Market Definition / Scope / Limitations
  3. Market Background
    • Market Dynamics
      • Drivers
      • Restraints
      • Opportunity
      • Trends
    • Scenario Forecast
      • Demand in Optimistic Scenario
      • Demand in Likely Scenario
      • Demand in Conservative Scenario
    • Opportunity Map Analysis
    • Product Life Cycle Analysis
    • Supply Chain Analysis
      • Supply Side Participants and their Roles
        • Producers
        • Mid-Level Participants (Traders/ Agents/ Brokers)
        • Wholesalers and Distributors
      • Value Added and Value Created at Node in the Supply Chain
      • List of Raw Material Suppliers
      • List of Existing and Potential Buyer’s
    • Investment Feasibility Matrix
    • Value Chain Analysis
      • Profit Margin Analysis
      • Wholesalers and Distributors
      • Retailers
    • PESTLE and Porter’s Analysis
    • Regulatory Landscape
      • By Key Regions
      • By Key Countries
    • Regional Parent Market Outlook
    • Production and Consumption Statistics
    • Import and Export Statistics
  4. Global Market Analysis 2020 to 2024 and Forecast, 2025 to 2035
    • Historical Market Size Value (USD Million) & Volume (Units) Analysis, 2020 to 2024
    • Current and Future Market Size Value (USD Million) & Volume (Units) Projections, 2025 to 2035
      • Y-o-Y Growth Trend Analysis
      • Absolute $ Opportunity Analysis
  5. Global Market Analysis 2020 to 2024 and Forecast 2025 to 2035, By Source
    • Introduction / Key Findings
    • Historical Market Size Value (USD Million) & Volume (Units) Analysis By Source, 2020 to 2024
    • Current and Future Market Size Value (USD Million) & Volume (Units) Analysis and Forecast By Source, 2025 to 2035
      • Microalgae
      • Cyanobacteria
      • Phytoplankton
    • Y-o-Y Growth Trend Analysis By Source, 2020 to 2024
    • Absolute $ Opportunity Analysis By Source, 2025 to 2035
  6. Global Market Analysis 2020 to 2024 and Forecast 2025 to 2035, By Function
    • Introduction / Key Findings
    • Historical Market Size Value (USD Million) & Volume (Units) Analysis By Function, 2020 to 2024
    • Current and Future Market Size Value (USD Million) & Volume (Units) Analysis and Forecast By Function, 2025 to 2035
      • Anti-aging
      • Hydration
      • Brightening
      • Detox
    • Y-o-Y Growth Trend Analysis By Function, 2020 to 2024
    • Absolute $ Opportunity Analysis By Function, 2025 to 2035
  7. Global Market Analysis 2020 to 2024 and Forecast 2025 to 2035, By Product Format
    • Introduction / Key Findings
    • Historical Market Size Value (USD Million) & Volume (Units) Analysis By Product Format, 2020 to 2024
    • Current and Future Market Size Value (USD Million) & Volume (Units) Analysis and Forecast By Product Format, 2025 to 2035
      • Serums
      • Creams
      • Masks
      • Powders
    • Y-o-Y Growth Trend Analysis By Product Format, 2020 to 2024
    • Absolute $ Opportunity Analysis By Product Format, 2025 to 2035
  8. Global Market Analysis 2020 to 2024 and Forecast 2025 to 2035, By Channel
    • Introduction / Key Findings
    • Historical Market Size Value (USD Million) & Volume (Units) Analysis By Channel, 2020 to 2024
    • Current and Future Market Size Value (USD Million) & Volume (Units) Analysis and Forecast By Channel, 2025 to 2035
      • E-commerce
      • Specialty retail
      • Pharmacies
      • B2B ingredients
    • Y-o-Y Growth Trend Analysis By Channel, 2020 to 2024
    • Absolute $ Opportunity Analysis By Channel, 2025 to 2035
  9. Global Market Analysis 2020 to 2024 and Forecast 2025 to 2035, By Region
    • Introduction
    • Historical Market Size Value (USD Million) & Volume (Units) Analysis By Region, 2020 to 2024
    • Current Market Size Value (USD Million) & Volume (Units) Analysis and Forecast By Region, 2025 to 2035
      • North America
      • Latin America
      • Europe
      • East Asia
      • South Asia & Pacific
      • Middle East and Africa
    • Market Attractiveness Analysis By Region
  10. North America Market Analysis 2020 to 2024 and Forecast 2025 to 2035, By Country
    • Historical Market Size Value (USD Million) & Volume (Units) Trend Analysis By Market Taxonomy, 2020 to 2024
    • Market Size Value (USD Million) & Volume (Units) Forecast By Market Taxonomy, 2025 to 2035
      • By Country
        • USA
        • Canada
      • By Source
      • By Function
      • By Product Format
      • By Channel
    • Market Attractiveness Analysis
      • By Country
      • By Source
      • By Function
      • By Product Format
      • By Channel
    • Key Takeaways
  11. Latin America Market Analysis 2020 to 2024 and Forecast 2025 to 2035, By Country
    • Historical Market Size Value (USD Million) & Volume (Units) Trend Analysis By Market Taxonomy, 2020 to 2024
    • Market Size Value (USD Million) & Volume (Units) Forecast By Market Taxonomy, 2025 to 2035
      • By Country
        • Brazil
        • Mexico
        • Colombia
        • Rest of Latin America
      • By Source
      • By Function
      • By Product Format
      • By Channel
    • Market Attractiveness Analysis
      • By Country
      • By Source
      • By Function
      • By Product Format
      • By Channel
    • Key Takeaways
  12. Europe Market Analysis 2020 to 2024 and Forecast 2025 to 2035, By Country
    • Historical Market Size Value (USD Million) & Volume (Units) Trend Analysis By Market Taxonomy, 2020 to 2024
    • Market Size Value (USD Million) & Volume (Units) Forecast By Market Taxonomy, 2025 to 2035
      • By Country
        • Germany
        • UK
        • France
        • Italy
        • Spain
        • Belgium
        • Netherlands
        • Nordic
        • Switzerland
        • Russia
        • Poland
        • Rest of Europe
      • By Source
      • By Function
      • By Product Format
      • By Channel
    • Market Attractiveness Analysis
      • By Country
      • By Source
      • By Function
      • By Product Format
      • By Channel
    • Key Takeaways
  13. East Asia Market Analysis 2020 to 2024 and Forecast 2025 to 2035, By Country
    • Historical Market Size Value (USD Million) & Volume (Units) Trend Analysis By Market Taxonomy, 2020 to 2024
    • Market Size Value (USD Million) & Volume (Units) Forecast By Market Taxonomy, 2025 to 2035
      • By Country
        • China
        • Japan
        • South Korea
      • By Source
      • By Function
      • By Product Format
      • By Channel
    • Market Attractiveness Analysis
      • By Country
      • By Source
      • By Function
      • By Product Format
      • By Channel
    • Key Takeaways
  14. South Asia & Pacific Market Analysis 2020 to 2024 and Forecast 2025 to 2035, By Country
    • Historical Market Size Value (USD Million) & Volume (Units) Trend Analysis By Market Taxonomy, 2020 to 2024
    • Market Size Value (USD Million) & Volume (Units) Forecast By Market Taxonomy, 2025 to 2035
      • By Country
        • India
        • Thailand
        • Malaysia
        • Indonesia
        • Singapore
        • Vietnam
        • Australia
        • New Zealand
        • Rest of South Asia
      • By Source
      • By Function
      • By Product Format
      • By Channel
    • Market Attractiveness Analysis
      • By Country
      • By Source
      • By Function
      • By Product Format
      • By Channel
    • Key Takeaways
  15. Middle East and Africa Market Analysis 2020 to 2024 and Forecast 2025 to 2035, By Country
    • Historical Market Size Value (USD Million) & Volume (Units) Trend Analysis By Market Taxonomy, 2020 to 2024
    • Market Size Value (USD Million) & Volume (Units) Forecast By Market Taxonomy, 2025 to 2035
      • By Country
        • Turkey
        • UAE
        • Saudi Arabia
        • Israel
        • Other GCC Countries
        • North Africa
        • South Africa
      • By Source
      • By Function
      • By Product Format
      • By Channel
    • Market Attractiveness Analysis
      • By Country
      • By Source
      • By Function
      • By Product Format
      • By Channel
    • Key Takeaways
  16. Key Countries Market Analysis
    • USA
      • Pricing Analysis
      • Market Share Analysis, 2024
        • By Source
        • By Function
        • By Product Format
        • By Channel
    • Canada
      • Pricing Analysis
      • Market Share Analysis, 2024
        • By Source
        • By Function
        • By Product Format
        • By Channel
    • Brazil
      • Pricing Analysis
      • Market Share Analysis, 2024
        • By Source
        • By Function
        • By Product Format
        • By Channel
    • Mexico
      • Pricing Analysis
      • Market Share Analysis, 2024
        • By Source
        • By Function
        • By Product Format
        • By Channel
    • Colombia
      • Pricing Analysis
      • Market Share Analysis, 2024
        • By Source
        • By Function
        • By Product Format
        • By Channel
    • Germany
      • Pricing Analysis
      • Market Share Analysis, 2024
        • By Source
        • By Function
        • By Product Format
        • By Channel
    • UK
      • Pricing Analysis
      • Market Share Analysis, 2024
        • By Source
        • By Function
        • By Product Format
        • By Channel
    • France
      • Pricing Analysis
      • Market Share Analysis, 2024
        • By Source
        • By Function
        • By Product Format
        • By Channel
    • Italy
      • Pricing Analysis
      • Market Share Analysis, 2024
        • By Source
        • By Function
        • By Product Format
        • By Channel
    • Spain
      • Pricing Analysis
      • Market Share Analysis, 2024
        • By Source
        • By Function
        • By Product Format
        • By Channel
    • Belgium
      • Pricing Analysis
      • Market Share Analysis, 2024
        • By Source
        • By Function
        • By Product Format
        • By Channel
    • Netherlands
      • Pricing Analysis
      • Market Share Analysis, 2024
        • By Source
        • By Function
        • By Product Format
        • By Channel
    • Nordic
      • Pricing Analysis
      • Market Share Analysis, 2024
        • By Source
        • By Function
        • By Product Format
        • By Channel
    • Switzerland
      • Pricing Analysis
      • Market Share Analysis, 2024
        • By Source
        • By Function
        • By Product Format
        • By Channel
    • Russia
      • Pricing Analysis
      • Market Share Analysis, 2024
        • By Source
        • By Function
        • By Product Format
        • By Channel
    • Poland
      • Pricing Analysis
      • Market Share Analysis, 2024
        • By Source
        • By Function
        • By Product Format
        • By Channel
    • China
      • Pricing Analysis
      • Market Share Analysis, 2024
        • By Source
        • By Function
        • By Product Format
        • By Channel
    • Japan
      • Pricing Analysis
      • Market Share Analysis, 2024
        • By Source
        • By Function
        • By Product Format
        • By Channel
    • South Korea
      • Pricing Analysis
      • Market Share Analysis, 2024
        • By Source
        • By Function
        • By Product Format
        • By Channel
    • India
      • Pricing Analysis
      • Market Share Analysis, 2024
        • By Source
        • By Function
        • By Product Format
        • By Channel
    • Thailand
      • Pricing Analysis
      • Market Share Analysis, 2024
        • By Source
        • By Function
        • By Product Format
        • By Channel
    • Indonesia
      • Pricing Analysis
      • Market Share Analysis, 2024
        • By Source
        • By Function
        • By Product Format
        • By Channel
    • Australia
      • Pricing Analysis
      • Market Share Analysis, 2024
        • By Source
        • By Function
        • By Product Format
        • By Channel
    • New Zealand
      • Pricing Analysis
      • Market Share Analysis, 2024
        • By Source
        • By Function
        • By Product Format
        • By Channel
    • Turkey
      • Pricing Analysis
      • Market Share Analysis, 2024
        • By Source
        • By Function
        • By Product Format
        • By Channel
    • UAE
      • Pricing Analysis
      • Market Share Analysis, 2024
        • By Source
        • By Function
        • By Product Format
        • By Channel
    • Saudi Arabia
      • Pricing Analysis
      • Market Share Analysis, 2024
        • By Source
        • By Function
        • By Product Format
        • By Channel
    • Israel
      • Pricing Analysis
      • Market Share Analysis, 2024
        • By Source
        • By Function
        • By Product Format
        • By Channel
    • North Africa
      • Pricing Analysis
      • Market Share Analysis, 2024
        • By Source
        • By Function
        • By Product Format
        • By Channel
    • South Africa
      • Pricing Analysis
      • Market Share Analysis, 2024
        • By Source
        • By Function
        • By Product Format
        • By Channel
  17. Market Structure Analysis
    • Competition Dashboard
    • Competition Benchmarking
    • Market Share Analysis of Top Players
      • By Regional
      • By Source
      • By Function
      • By Product Format
      • By Channel
  18. Competition Analysis
    • Competition Deep Dive
      • Codif
        • Overview
        • Product Portfolio
        • Profitability by Market Segments (Product/Age /Sales Channel/Region)
        • Sales Footprint
        • Strategy Overview
          • Marketing Strategy
          • Product Strategy
          • Channel Strategy
      • Greentech
        • Overview
        • Product Portfolio
        • Profitability by Market Segments (Product/Age /Sales Channel/Region)
        • Sales Footprint
        • Strategy Overview
          • Marketing Strategy
          • Product Strategy
          • Channel Strategy
      • BASF
        • Overview
        • Product Portfolio
        • Profitability by Market Segments (Product/Age /Sales Channel/Region)
        • Sales Footprint
        • Strategy Overview
          • Marketing Strategy
          • Product Strategy
          • Channel Strategy
      • DSM-Firmenich
        • Overview
        • Product Portfolio
        • Profitability by Market Segments (Product/Age /Sales Channel/Region)
        • Sales Footprint
        • Strategy Overview
          • Marketing Strategy
          • Product Strategy
          • Channel Strategy
      • Ashland
        • Overview
        • Product Portfolio
        • Profitability by Market Segments (Product/Age /Sales Channel/Region)
        • Sales Footprint
        • Strategy Overview
          • Marketing Strategy
          • Product Strategy
          • Channel Strategy
      • Seppic
        • Overview
        • Product Portfolio
        • Profitability by Market Segments (Product/Age /Sales Channel/Region)
        • Sales Footprint
        • Strategy Overview
          • Marketing Strategy
          • Product Strategy
          • Channel Strategy
      • Solabia
        • Overview
        • Product Portfolio
        • Profitability by Market Segments (Product/Age /Sales Channel/Region)
        • Sales Footprint
        • Strategy Overview
          • Marketing Strategy
          • Product Strategy
          • Channel Strategy
      • Algatech
        • Overview
        • Product Portfolio
        • Profitability by Market Segments (Product/Age /Sales Channel/Region)
        • Sales Footprint
        • Strategy Overview
          • Marketing Strategy
          • Product Strategy
          • Channel Strategy
      • BiotechMarine
        • Overview
        • Product Portfolio
        • Profitability by Market Segments (Product/Age /Sales Channel/Region)
        • Sales Footprint
        • Strategy Overview
          • Marketing Strategy
          • Product Strategy
          • Channel Strategy
      • Croda
        • Overview
        • Product Portfolio
        • Profitability by Market Segments (Product/Age /Sales Channel/Region)
        • Sales Footprint
        • Strategy Overview
          • Marketing Strategy
          • Product Strategy
          • Channel Strategy
      • Others
        • Overview
        • Product Portfolio
        • Profitability by Market Segments (Product/Age /Sales Channel/Region)
        • Sales Footprint
        • Strategy Overview
          • Marketing Strategy
          • Product Strategy
          • Channel Strategy
  19. Assumptions & Acronyms Used
  20. Research Methodology

List of Tables

  • Table 1: Global Market Value (USD Million) Forecast by Region, 2020-2035
  • Table 2: Global Market Volume (Units) Forecast by Region, 2020-2035
  • Table 3: Global Market Value (USD Million) Forecast by Source, 2020-2035
  • Table 4: Global Market Volume (Units) Forecast by Source, 2020-2035
  • Table 5: Global Market Value (USD Million) Forecast by Function, 2020-2035
  • Table 6: Global Market Volume (Units) Forecast by Function, 2020-2035
  • Table 7: Global Market Value (USD Million) Forecast by Product Format, 2020-2035
  • Table 8: Global Market Volume (Units) Forecast by Product Format, 2020-2035
  • Table 9: Global Market Value (USD Million) Forecast by Channel, 2020-2035
  • Table 10: Global Market Volume (Units) Forecast by Channel, 2020-2035
  • Table 11: North America Market Value (USD Million) Forecast by Country, 2020-2035
  • Table 12: North America Market Volume (Units) Forecast by Country, 2020-2035
  • Table 13: North America Market Value (USD Million) Forecast by Source, 2020-2035
  • Table 14: North America Market Volume (Units) Forecast by Source, 2020-2035
  • Table 15: North America Market Value (USD Million) Forecast by Function, 2020-2035
  • Table 16: North America Market Volume (Units) Forecast by Function, 2020-2035
  • Table 17: North America Market Value (USD Million) Forecast by Product Format, 2020-2035
  • Table 18: North America Market Volume (Units) Forecast by Product Format, 2020-2035
  • Table 19: North America Market Value (USD Million) Forecast by Channel, 2020-2035
  • Table 20: North America Market Volume (Units) Forecast by Channel, 2020-2035
  • Table 21: Latin America Market Value (USD Million) Forecast by Country, 2020-2035
  • Table 22: Latin America Market Volume (Units) Forecast by Country, 2020-2035
  • Table 23: Latin America Market Value (USD Million) Forecast by Source, 2020-2035
  • Table 24: Latin America Market Volume (Units) Forecast by Source, 2020-2035
  • Table 25: Latin America Market Value (USD Million) Forecast by Function, 2020-2035
  • Table 26: Latin America Market Volume (Units) Forecast by Function, 2020-2035
  • Table 27: Latin America Market Value (USD Million) Forecast by Product Format, 2020-2035
  • Table 28: Latin America Market Volume (Units) Forecast by Product Format, 2020-2035
  • Table 29: Latin America Market Value (USD Million) Forecast by Channel, 2020-2035
  • Table 30: Latin America Market Volume (Units) Forecast by Channel, 2020-2035
  • Table 31: Europe Market Value (USD Million) Forecast by Country, 2020-2035
  • Table 32: Europe Market Volume (Units) Forecast by Country, 2020-2035
  • Table 33: Europe Market Value (USD Million) Forecast by Source, 2020-2035
  • Table 34: Europe Market Volume (Units) Forecast by Source, 2020-2035
  • Table 35: Europe Market Value (USD Million) Forecast by Function, 2020-2035
  • Table 36: Europe Market Volume (Units) Forecast by Function, 2020-2035
  • Table 37: Europe Market Value (USD Million) Forecast by Product Format, 2020-2035
  • Table 38: Europe Market Volume (Units) Forecast by Product Format, 2020-2035
  • Table 39: Europe Market Value (USD Million) Forecast by Channel, 2020-2035
  • Table 40: Europe Market Volume (Units) Forecast by Channel, 2020-2035
  • Table 41: East Asia Market Value (USD Million) Forecast by Country, 2020-2035
  • Table 42: East Asia Market Volume (Units) Forecast by Country, 2020-2035
  • Table 43: East Asia Market Value (USD Million) Forecast by Source, 2020-2035
  • Table 44: East Asia Market Volume (Units) Forecast by Source, 2020-2035
  • Table 45: East Asia Market Value (USD Million) Forecast by Function, 2020-2035
  • Table 46: East Asia Market Volume (Units) Forecast by Function, 2020-2035
  • Table 47: East Asia Market Value (USD Million) Forecast by Product Format, 2020-2035
  • Table 48: East Asia Market Volume (Units) Forecast by Product Format, 2020-2035
  • Table 49: East Asia Market Value (USD Million) Forecast by Channel, 2020-2035
  • Table 50: East Asia Market Volume (Units) Forecast by Channel, 2020-2035
  • Table 51: South Asia & Pacific Market Value (USD Million) Forecast by Country, 2020-2035
  • Table 52: South Asia & Pacific Market Volume (Units) Forecast by Country, 2020-2035
  • Table 53: South Asia & Pacific Market Value (USD Million) Forecast by Source, 2020-2035
  • Table 54: South Asia & Pacific Market Volume (Units) Forecast by Source, 2020-2035
  • Table 55: South Asia & Pacific Market Value (USD Million) Forecast by Function, 2020-2035
  • Table 56: South Asia & Pacific Market Volume (Units) Forecast by Function, 2020-2035
  • Table 57: South Asia & Pacific Market Value (USD Million) Forecast by Product Format, 2020-2035
  • Table 58: South Asia & Pacific Market Volume (Units) Forecast by Product Format, 2020-2035
  • Table 59: South Asia & Pacific Market Value (USD Million) Forecast by Channel, 2020-2035
  • Table 60: South Asia & Pacific Market Volume (Units) Forecast by Channel, 2020-2035
  • Table 61: Middle East and Africa Market Value (USD Million) Forecast by Country, 2020-2035
  • Table 62: Middle East and Africa Market Volume (Units) Forecast by Country, 2020-2035
  • Table 63: Middle East and Africa Market Value (USD Million) Forecast by Source, 2020-2035
  • Table 64: Middle East and Africa Market Volume (Units) Forecast by Source, 2020-2035
  • Table 65: Middle East and Africa Market Value (USD Million) Forecast by Function, 2020-2035
  • Table 66: Middle East and Africa Market Volume (Units) Forecast by Function, 2020-2035
  • Table 67: Middle East and Africa Market Value (USD Million) Forecast by Product Format, 2020-2035
  • Table 68: Middle East and Africa Market Volume (Units) Forecast by Product Format, 2020-2035
  • Table 69: Middle East and Africa Market Value (USD Million) Forecast by Channel, 2020-2035
  • Table 70: Middle East and Africa Market Volume (Units) Forecast by Channel, 2020-2035

List of Figures

  • Figure 1: Global Market Value (USD Million) by Source, 2025-2035
  • Figure 2: Global Market Value (USD Million) by Function, 2025-2035
  • Figure 3: Global Market Value (USD Million) by Product Format, 2025-2035
  • Figure 4: Global Market Value (USD Million) by Channel, 2025-2035
  • Figure 5: Global Market Value (USD Million) by Region, 2025-2035
  • Figure 6: Global Market Value (USD Million) Analysis by Region, 2020-2035
  • Figure 7: Global Market Volume (Units) Analysis by Region, 2020-2035
  • Figure 8: Global Market Value Share (%) and BPS Analysis by Region, 2025-2035
  • Figure 9: Global Market Y-o-Y Growth (%) Projections by Region, 2025-2035
  • Figure 10: Global Market Value (USD Million) Analysis by Source, 2020-2035
  • Figure 11: Global Market Volume (Units) Analysis by Source, 2020-2035
  • Figure 12: Global Market Value Share (%) and BPS Analysis by Source, 2025-2035
  • Figure 13: Global Market Y-o-Y Growth (%) Projections by Source, 2025-2035
  • Figure 14: Global Market Value (USD Million) Analysis by Function, 2020-2035
  • Figure 15: Global Market Volume (Units) Analysis by Function, 2020-2035
  • Figure 16: Global Market Value Share (%) and BPS Analysis by Function, 2025-2035
  • Figure 17: Global Market Y-o-Y Growth (%) Projections by Function, 2025-2035
  • Figure 18: Global Market Value (USD Million) Analysis by Product Format, 2020-2035
  • Figure 19: Global Market Volume (Units) Analysis by Product Format, 2020-2035
  • Figure 20: Global Market Value Share (%) and BPS Analysis by Product Format, 2025-2035
  • Figure 21: Global Market Y-o-Y Growth (%) Projections by Product Format, 2025-2035
  • Figure 22: Global Market Value (USD Million) Analysis by Channel, 2020-2035
  • Figure 23: Global Market Volume (Units) Analysis by Channel, 2020-2035
  • Figure 24: Global Market Value Share (%) and BPS Analysis by Channel, 2025-2035
  • Figure 25: Global Market Y-o-Y Growth (%) Projections by Channel, 2025-2035
  • Figure 26: Global Market Attractiveness by Source, 2025-2035
  • Figure 27: Global Market Attractiveness by Function, 2025-2035
  • Figure 28: Global Market Attractiveness by Product Format, 2025-2035
  • Figure 29: Global Market Attractiveness by Channel, 2025-2035
  • Figure 30: Global Market Attractiveness by Region, 2025-2035
  • Figure 31: North America Market Value (USD Million) by Source, 2025-2035
  • Figure 32: North America Market Value (USD Million) by Function, 2025-2035
  • Figure 33: North America Market Value (USD Million) by Product Format, 2025-2035
  • Figure 34: North America Market Value (USD Million) by Channel, 2025-2035
  • Figure 35: North America Market Value (USD Million) by Country, 2025-2035
  • Figure 36: North America Market Value (USD Million) Analysis by Country, 2020-2035
  • Figure 37: North America Market Volume (Units) Analysis by Country, 2020-2035
  • Figure 38: North America Market Value Share (%) and BPS Analysis by Country, 2025-2035
  • Figure 39: North America Market Y-o-Y Growth (%) Projections by Country, 2025-2035
  • Figure 40: North America Market Value (USD Million) Analysis by Source, 2020-2035
  • Figure 41: North America Market Volume (Units) Analysis by Source, 2020-2035
  • Figure 42: North America Market Value Share (%) and BPS Analysis by Source, 2025-2035
  • Figure 43: North America Market Y-o-Y Growth (%) Projections by Source, 2025-2035
  • Figure 44: North America Market Value (USD Million) Analysis by Function, 2020-2035
  • Figure 45: North America Market Volume (Units) Analysis by Function, 2020-2035
  • Figure 46: North America Market Value Share (%) and BPS Analysis by Function, 2025-2035
  • Figure 47: North America Market Y-o-Y Growth (%) Projections by Function, 2025-2035
  • Figure 48: North America Market Value (USD Million) Analysis by Product Format, 2020-2035
  • Figure 49: North America Market Volume (Units) Analysis by Product Format, 2020-2035
  • Figure 50: North America Market Value Share (%) and BPS Analysis by Product Format, 2025-2035
  • Figure 51: North America Market Y-o-Y Growth (%) Projections by Product Format, 2025-2035
  • Figure 52: North America Market Value (USD Million) Analysis by Channel, 2020-2035
  • Figure 53: North America Market Volume (Units) Analysis by Channel, 2020-2035
  • Figure 54: North America Market Value Share (%) and BPS Analysis by Channel, 2025-2035
  • Figure 55: North America Market Y-o-Y Growth (%) Projections by Channel, 2025-2035
  • Figure 56: North America Market Attractiveness by Source, 2025-2035
  • Figure 57: North America Market Attractiveness by Function, 2025-2035
  • Figure 58: North America Market Attractiveness by Product Format, 2025-2035
  • Figure 59: North America Market Attractiveness by Channel, 2025-2035
  • Figure 60: North America Market Attractiveness by Country, 2025-2035
  • Figure 61: Latin America Market Value (USD Million) by Source, 2025-2035
  • Figure 62: Latin America Market Value (USD Million) by Function, 2025-2035
  • Figure 63: Latin America Market Value (USD Million) by Product Format, 2025-2035
  • Figure 64: Latin America Market Value (USD Million) by Channel, 2025-2035
  • Figure 65: Latin America Market Value (USD Million) by Country, 2025-2035
  • Figure 66: Latin America Market Value (USD Million) Analysis by Country, 2020-2035
  • Figure 67: Latin America Market Volume (Units) Analysis by Country, 2020-2035
  • Figure 68: Latin America Market Value Share (%) and BPS Analysis by Country, 2025-2035
  • Figure 69: Latin America Market Y-o-Y Growth (%) Projections by Country, 2025-2035
  • Figure 70: Latin America Market Value (USD Million) Analysis by Source, 2020-2035
  • Figure 71: Latin America Market Volume (Units) Analysis by Source, 2020-2035
  • Figure 72: Latin America Market Value Share (%) and BPS Analysis by Source, 2025-2035
  • Figure 73: Latin America Market Y-o-Y Growth (%) Projections by Source, 2025-2035
  • Figure 74: Latin America Market Value (USD Million) Analysis by Function, 2020-2035
  • Figure 75: Latin America Market Volume (Units) Analysis by Function, 2020-2035
  • Figure 76: Latin America Market Value Share (%) and BPS Analysis by Function, 2025-2035
  • Figure 77: Latin America Market Y-o-Y Growth (%) Projections by Function, 2025-2035
  • Figure 78: Latin America Market Value (USD Million) Analysis by Product Format, 2020-2035
  • Figure 79: Latin America Market Volume (Units) Analysis by Product Format, 2020-2035
  • Figure 80: Latin America Market Value Share (%) and BPS Analysis by Product Format, 2025-2035
  • Figure 81: Latin America Market Y-o-Y Growth (%) Projections by Product Format, 2025-2035
  • Figure 82: Latin America Market Value (USD Million) Analysis by Channel, 2020-2035
  • Figure 83: Latin America Market Volume (Units) Analysis by Channel, 2020-2035
  • Figure 84: Latin America Market Value Share (%) and BPS Analysis by Channel, 2025-2035
  • Figure 85: Latin America Market Y-o-Y Growth (%) Projections by Channel, 2025-2035
  • Figure 86: Latin America Market Attractiveness by Source, 2025-2035
  • Figure 87: Latin America Market Attractiveness by Function, 2025-2035
  • Figure 88: Latin America Market Attractiveness by Product Format, 2025-2035
  • Figure 89: Latin America Market Attractiveness by Channel, 2025-2035
  • Figure 90: Latin America Market Attractiveness by Country, 2025-2035
  • Figure 91: Europe Market Value (USD Million) by Source, 2025-2035
  • Figure 92: Europe Market Value (USD Million) by Function, 2025-2035
  • Figure 93: Europe Market Value (USD Million) by Product Format, 2025-2035
  • Figure 94: Europe Market Value (USD Million) by Channel, 2025-2035
  • Figure 95: Europe Market Value (USD Million) by Country, 2025-2035
  • Figure 96: Europe Market Value (USD Million) Analysis by Country, 2020-2035
  • Figure 97: Europe Market Volume (Units) Analysis by Country, 2020-2035
  • Figure 98: Europe Market Value Share (%) and BPS Analysis by Country, 2025-2035
  • Figure 99: Europe Market Y-o-Y Growth (%) Projections by Country, 2025-2035
  • Figure 100: Europe Market Value (USD Million) Analysis by Source, 2020-2035
  • Figure 101: Europe Market Volume (Units) Analysis by Source, 2020-2035
  • Figure 102: Europe Market Value Share (%) and BPS Analysis by Source, 2025-2035
  • Figure 103: Europe Market Y-o-Y Growth (%) Projections by Source, 2025-2035
  • Figure 104: Europe Market Value (USD Million) Analysis by Function, 2020-2035
  • Figure 105: Europe Market Volume (Units) Analysis by Function, 2020-2035
  • Figure 106: Europe Market Value Share (%) and BPS Analysis by Function, 2025-2035
  • Figure 107: Europe Market Y-o-Y Growth (%) Projections by Function, 2025-2035
  • Figure 108: Europe Market Value (USD Million) Analysis by Product Format, 2020-2035
  • Figure 109: Europe Market Volume (Units) Analysis by Product Format, 2020-2035
  • Figure 110: Europe Market Value Share (%) and BPS Analysis by Product Format, 2025-2035
  • Figure 111: Europe Market Y-o-Y Growth (%) Projections by Product Format, 2025-2035
  • Figure 112: Europe Market Value (USD Million) Analysis by Channel, 2020-2035
  • Figure 113: Europe Market Volume (Units) Analysis by Channel, 2020-2035
  • Figure 114: Europe Market Value Share (%) and BPS Analysis by Channel, 2025-2035
  • Figure 115: Europe Market Y-o-Y Growth (%) Projections by Channel, 2025-2035
  • Figure 116: Europe Market Attractiveness by Source, 2025-2035
  • Figure 117: Europe Market Attractiveness by Function, 2025-2035
  • Figure 118: Europe Market Attractiveness by Product Format, 2025-2035
  • Figure 119: Europe Market Attractiveness by Channel, 2025-2035
  • Figure 120: Europe Market Attractiveness by Country, 2025-2035
  • Figure 121: East Asia Market Value (USD Million) by Source, 2025-2035
  • Figure 122: East Asia Market Value (USD Million) by Function, 2025-2035
  • Figure 123: East Asia Market Value (USD Million) by Product Format, 2025-2035
  • Figure 124: East Asia Market Value (USD Million) by Channel, 2025-2035
  • Figure 125: East Asia Market Value (USD Million) by Country, 2025-2035
  • Figure 126: East Asia Market Value (USD Million) Analysis by Country, 2020-2035
  • Figure 127: East Asia Market Volume (Units) Analysis by Country, 2020-2035
  • Figure 128: East Asia Market Value Share (%) and BPS Analysis by Country, 2025-2035
  • Figure 129: East Asia Market Y-o-Y Growth (%) Projections by Country, 2025-2035
  • Figure 130: East Asia Market Value (USD Million) Analysis by Source, 2020-2035
  • Figure 131: East Asia Market Volume (Units) Analysis by Source, 2020-2035
  • Figure 132: East Asia Market Value Share (%) and BPS Analysis by Source, 2025-2035
  • Figure 133: East Asia Market Y-o-Y Growth (%) Projections by Source, 2025-2035
  • Figure 134: East Asia Market Value (USD Million) Analysis by Function, 2020-2035
  • Figure 135: East Asia Market Volume (Units) Analysis by Function, 2020-2035
  • Figure 136: East Asia Market Value Share (%) and BPS Analysis by Function, 2025-2035
  • Figure 137: East Asia Market Y-o-Y Growth (%) Projections by Function, 2025-2035
  • Figure 138: East Asia Market Value (USD Million) Analysis by Product Format, 2020-2035
  • Figure 139: East Asia Market Volume (Units) Analysis by Product Format, 2020-2035
  • Figure 140: East Asia Market Value Share (%) and BPS Analysis by Product Format, 2025-2035
  • Figure 141: East Asia Market Y-o-Y Growth (%) Projections by Product Format, 2025-2035
  • Figure 142: East Asia Market Value (USD Million) Analysis by Channel, 2020-2035
  • Figure 143: East Asia Market Volume (Units) Analysis by Channel, 2020-2035
  • Figure 144: East Asia Market Value Share (%) and BPS Analysis by Channel, 2025-2035
  • Figure 145: East Asia Market Y-o-Y Growth (%) Projections by Channel, 2025-2035
  • Figure 146: East Asia Market Attractiveness by Source, 2025-2035
  • Figure 147: East Asia Market Attractiveness by Function, 2025-2035
  • Figure 148: East Asia Market Attractiveness by Product Format, 2025-2035
  • Figure 149: East Asia Market Attractiveness by Channel, 2025-2035
  • Figure 150: East Asia Market Attractiveness by Country, 2025-2035
  • Figure 151: South Asia & Pacific Market Value (USD Million) by Source, 2025-2035
  • Figure 152: South Asia & Pacific Market Value (USD Million) by Function, 2025-2035
  • Figure 153: South Asia & Pacific Market Value (USD Million) by Product Format, 2025-2035
  • Figure 154: South Asia & Pacific Market Value (USD Million) by Channel, 2025-2035
  • Figure 155: South Asia & Pacific Market Value (USD Million) by Country, 2025-2035
  • Figure 156: South Asia & Pacific Market Value (USD Million) Analysis by Country, 2020-2035
  • Figure 157: South Asia & Pacific Market Volume (Units) Analysis by Country, 2020-2035
  • Figure 158: South Asia & Pacific Market Value Share (%) and BPS Analysis by Country, 2025-2035
  • Figure 159: South Asia & Pacific Market Y-o-Y Growth (%) Projections by Country, 2025-2035
  • Figure 160: South Asia & Pacific Market Value (USD Million) Analysis by Source, 2020-2035
  • Figure 161: South Asia & Pacific Market Volume (Units) Analysis by Source, 2020-2035
  • Figure 162: South Asia & Pacific Market Value Share (%) and BPS Analysis by Source, 2025-2035
  • Figure 163: South Asia & Pacific Market Y-o-Y Growth (%) Projections by Source, 2025-2035
  • Figure 164: South Asia & Pacific Market Value (USD Million) Analysis by Function, 2020-2035
  • Figure 165: South Asia & Pacific Market Volume (Units) Analysis by Function, 2020-2035
  • Figure 166: South Asia & Pacific Market Value Share (%) and BPS Analysis by Function, 2025-2035
  • Figure 167: South Asia & Pacific Market Y-o-Y Growth (%) Projections by Function, 2025-2035
  • Figure 168: South Asia & Pacific Market Value (USD Million) Analysis by Product Format, 2020-2035
  • Figure 169: South Asia & Pacific Market Volume (Units) Analysis by Product Format, 2020-2035
  • Figure 170: South Asia & Pacific Market Value Share (%) and BPS Analysis by Product Format, 2025-2035
  • Figure 171: South Asia & Pacific Market Y-o-Y Growth (%) Projections by Product Format, 2025-2035
  • Figure 172: South Asia & Pacific Market Value (USD Million) Analysis by Channel, 2020-2035
  • Figure 173: South Asia & Pacific Market Volume (Units) Analysis by Channel, 2020-2035
  • Figure 174: South Asia & Pacific Market Value Share (%) and BPS Analysis by Channel, 2025-2035
  • Figure 175: South Asia & Pacific Market Y-o-Y Growth (%) Projections by Channel, 2025-2035
  • Figure 176: South Asia & Pacific Market Attractiveness by Source, 2025-2035
  • Figure 177: South Asia & Pacific Market Attractiveness by Function, 2025-2035
  • Figure 178: South Asia & Pacific Market Attractiveness by Product Format, 2025-2035
  • Figure 179: South Asia & Pacific Market Attractiveness by Channel, 2025-2035
  • Figure 180: South Asia & Pacific Market Attractiveness by Country, 2025-2035
  • Figure 181: Middle East and Africa Market Value (USD Million) by Source, 2025-2035
  • Figure 182: Middle East and Africa Market Value (USD Million) by Function, 2025-2035
  • Figure 183: Middle East and Africa Market Value (USD Million) by Product Format, 2025-2035
  • Figure 184: Middle East and Africa Market Value (USD Million) by Channel, 2025-2035
  • Figure 185: Middle East and Africa Market Value (USD Million) by Country, 2025-2035
  • Figure 186: Middle East and Africa Market Value (USD Million) Analysis by Country, 2020-2035
  • Figure 187: Middle East and Africa Market Volume (Units) Analysis by Country, 2020-2035
  • Figure 188: Middle East and Africa Market Value Share (%) and BPS Analysis by Country, 2025-2035
  • Figure 189: Middle East and Africa Market Y-o-Y Growth (%) Projections by Country, 2025-2035
  • Figure 190: Middle East and Africa Market Value (USD Million) Analysis by Source, 2020-2035
  • Figure 191: Middle East and Africa Market Volume (Units) Analysis by Source, 2020-2035
  • Figure 192: Middle East and Africa Market Value Share (%) and BPS Analysis by Source, 2025-2035
  • Figure 193: Middle East and Africa Market Y-o-Y Growth (%) Projections by Source, 2025-2035
  • Figure 194: Middle East and Africa Market Value (USD Million) Analysis by Function, 2020-2035
  • Figure 195: Middle East and Africa Market Volume (Units) Analysis by Function, 2020-2035
  • Figure 196: Middle East and Africa Market Value Share (%) and BPS Analysis by Function, 2025-2035
  • Figure 197: Middle East and Africa Market Y-o-Y Growth (%) Projections by Function, 2025-2035
  • Figure 198: Middle East and Africa Market Value (USD Million) Analysis by Product Format, 2020-2035
  • Figure 199: Middle East and Africa Market Volume (Units) Analysis by Product Format, 2020-2035
  • Figure 200: Middle East and Africa Market Value Share (%) and BPS Analysis by Product Format, 2025-2035
  • Figure 201: Middle East and Africa Market Y-o-Y Growth (%) Projections by Product Format, 2025-2035
  • Figure 202: Middle East and Africa Market Value (USD Million) Analysis by Channel, 2020-2035
  • Figure 203: Middle East and Africa Market Volume (Units) Analysis by Channel, 2020-2035
  • Figure 204: Middle East and Africa Market Value Share (%) and BPS Analysis by Channel, 2025-2035
  • Figure 205: Middle East and Africa Market Y-o-Y Growth (%) Projections by Channel, 2025-2035
  • Figure 206: Middle East and Africa Market Attractiveness by Source, 2025-2035
  • Figure 207: Middle East and Africa Market Attractiveness by Function, 2025-2035
  • Figure 208: Middle East and Africa Market Attractiveness by Product Format, 2025-2035
  • Figure 209: Middle East and Africa Market Attractiveness by Channel, 2025-2035
  • Figure 210: Middle East and Africa Market Attractiveness by Country, 2025-2035

Frequently Asked Questions

How big is the Marine Plankton Extracts Market in 2025?

The global Marine Plankton Extracts Market is estimated to be valued at USD 1,052.7 million in 2025.

What will be the size of the Marine Plankton Extracts Market in 2035?

The market size for the Marine Plankton Extracts Market is projected to reach USD 3,607.2 million by 2035.

How much will be the Marine Plankton Extracts Market growth between 2025 and 2035?

The Marine Plankton Extracts Market is expected to grow at a CAGR of 13.1% between 2025 and 2035.

What are the key product formats in the Marine Plankton Extracts Market?

The key product formats in the Marine Plankton Extracts Market are serums, creams, masks, and powders.

Which functional segment is expected to contribute significant share in the Marine Plankton Extracts Market in 2025?

In terms of functionality, the anti-aging segment is projected to command 48.5% share in the Marine Plankton Extracts Market in 2025.

Explore Similar Insights

Future Market Insights

Marine Plankton Extracts Market

Chat With

MaRIA

Hi There, I am MaRIA, Your Market Research Intelligence Assistant. How may I help you?