

- Market Size (2026)
- USD 1.9 Bn
- Forecast (2036)
- USD 3.2 Bn
- CAGR (2026 to 2036)
- 5.6%
How big is Matrix Acidizing Chemicals Market in 2026?
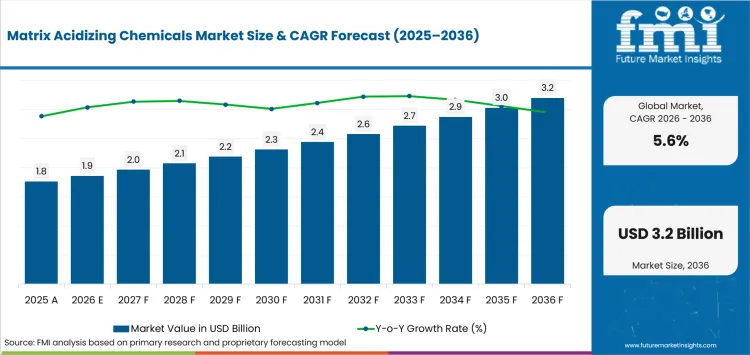
USD 1.9 billion in 2026 and USD 3.2 billion by 2036 at a 5.6% CAGR.
Demand for matrix acidizing chemicals is projected to expand at 5.6% CAGR between 2026 and 2036, increasing valuation from USD 1.9 billion in 2026 to USD 3.2 billion by 2036. Existing wells underpin demand because matrix treatments can restore localized flow impairment without creating a new fracture network. The International Energy Agency reported in June 2025 that 40% of upstream oil and gas investment was dedicated to offsetting decline at existing fields.
Regional economics split the forecast between short-cycle USA work and Gulf or offshore programs with higher mobilization costs. The International Energy Agency projected in June 2025 that upstream oil investment would fall 6% in 2025, with the largest reductions in USA light tight oil. Gulf programs can retain treatment demand because local chemical support and longer offshore schedules are less tied to short-cycle drilling budgets.
Key Takeaways
- Production-restoration work supports demand where operators can treat formation damage below fracturing pressure without rebuilding the completion.
- By chemical type, hydrochloric acid systems are estimated to hold 28.0% in 2026 owing to familiar field practice and broad additive compatibility.
- Carbonate reservoirs are set to lead reservoir type with 41.0% share in 2026 due to acid dissolution that can restore near-wellbore conductivity.
- In 2026, near-wellbore damage removal is expected to lead application with 31.0% share because treatment economics can be tied directly to recoverable productivity loss.
- Corrosion, precipitation and uneven placement lengthen qualification because a failed treatment can damage tubulars or consume an intervention window.
- Key players in the matrix acidizing chemicals market include SLB, Halliburton, Baker Hughes, Clariant, Innospec, Nouryon, Italmatch Chemicals, and SNF.
Analyst Perspective
"Matrix acidizing chemistry should be judged against mineralogy, metallurgy and placement risk before chemical price enters the comparison. A lower-cost package loses value quickly if reaction rate, corrosion control or diversion forces a second intervention."
- Nikhil Kaitwade, Principal Consultant, Future Market Insights
How is the matrix acidizing chemicals market segmented?
The matrix acidizing chemicals market is segmented by chemical type, reservoir type, application, well type and sales channel.
Chemical types include hydrochloric acid, mud acid and organic acid systems plus chelants, inhibitors and surfactant packages. Reservoir types cover carbonate, sandstone, mixed lithology, HPHT and mature reservoirs. Applications cover damage removal, permeability restoration, scale removal, stimulation and pre-frac treatment. Well types include oil, gas, horizontal, offshore and unconventional wells. Sales channels comprise stimulation service companies, direct operator contracts, specialty chemical suppliers and regional distributors.
Why do hydrochloric acid systems lead the chemical type category?
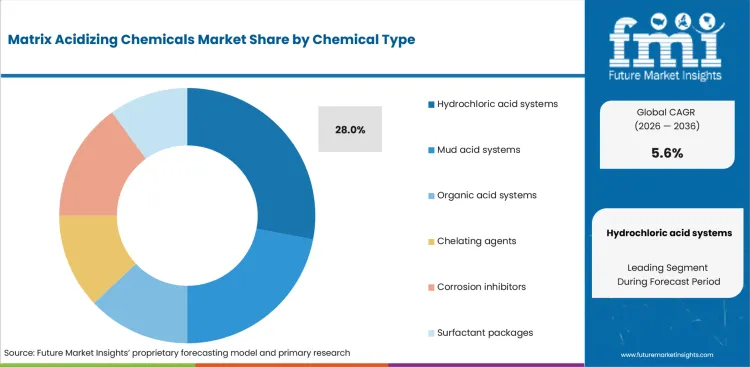
Hydrochloric acid remains the main reactive base for carbonate treatments where fast rock dissolution is useful and metallurgy can tolerate the exposure. Engineers temper reaction rate with corrosion inhibitors or retarders, then use diversion additives to keep fluid from spending near the entry point.
- By chemical type, hydrochloric acid systems are estimated to hold 28.0% in 2026 owing to familiar treatment practice and broad additive compatibility.
- Treatment volume makes formulation efficiency important in long laterals. In March 2025, SPE's Journal of Petroleum Technology noted that acid-restimulation volumes in modern 10,000-foot completions are often limited to about 1,000 barrels. That constraint raises the value of effective placement per barrel.
Why do carbonate reservoirs lead the reservoir type category?
Carbonate matrix treatments depend on reaction control instead of acid strength alone. Fast spending near the entry point can waste fluid before it reaches damaged rock farther from the wellbore.
- Carbonate reservoirs are set to lead reservoir type with 41.0% share in 2026 due to direct acid dissolution of formation rock near the wellbore.
- In June 2025, SPE's Journal of Petroleum Technology documented acid stimulation below fracture pressure as a route to higher carbonate permeability and bypassed damage. Fractures and vugs change fluid movement, so diversion design has to account for the reservoir's actual flow paths.
Why does near-wellbore damage removal lead the application category?
Near-wellbore damage removal addresses productivity loss without requiring a new fracture network. The intervention is easiest to justify if scale, fines or completion residues raise skin while the completion remains mechanically useful.
- In 2026, near-wellbore damage removal is expected to lead application with 31.0% share because recovered production can be compared directly with treatment cost.
- Placement determines whether that economics survives field execution. SPE's June 2025 Journal of Petroleum Technology account found that matrix acid naturally favors high-permeability streaks, making diversion control central to reaching poorly stimulated intervals.
Why do oil wells lead the well type category?
Oil-well treatments have a direct commercial screen because incremental liquid output can be valued against chemistry, downtime and intervention cost. Mature wells with localized impairment are stronger candidates than completions with mechanical failure or depleted reservoir support.
- Oil wells are projected to hold 33.0% of well type demand in 2026 attributable to measurable production recovery from existing assets.
- An alternative placement route also has field evidence. In June 2025, SPE's Journal of Petroleum Technology described acid vapor generated downhole at selected intervals in mature oil wells and reported sustained production improvement. Selective placement can reduce unnecessary chemical exposure outside the target interval.
Why do stimulation service companies lead the sales channel category?
Stimulation service companies control the purchase because stimulation chemistry is selected with pumping, placement and field checks. A single service scope also reduces handoffs between laboratory design and offshore execution.
- By sales channel, stimulation service companies are forecast to represent 47.0% in 2026 driven by contracts that tie treatment design to equipment and field delivery.
- Halliburton's August 2025 ConocoPhillips award shows that operating model in practice. The five-year North Sea contract covers comprehensive well stimulation services and conversion of a dedicated vessel, giving the contractor control over execution capacity as treatment programs are scheduled.
What are the drivers, restraints and opportunities in the Matrix Acidizing Chemicals Market?
Existing-well production recovery supports demand, chemistry qualification constrains treatment economics and faster diagnostic screening can widen viable interventions.
- Driver: Declining well productivity forces a repeated choice between targeted matrix treatment and more disruptive remedial work.
- Restraint: Corrosion, precipitation and uneven placement can erase expected production gains and increase remediation exposure.
- Opportunity: Better diagnostic screening can identify wells whose near-wellbore damage is suitable for a targeted matrix treatment.
A significant demand driver is declining output from producing wells that still retain recoverable reservoir capacity. IEA analysis published in September 2025 found that nearly 90% of annual upstream investment since 2019 has been used to offset field decline. Production-restoration work therefore has a durable budget route where localized damage can be treated below fracture pressure.
Qualification risk limits use because an offshore acid job must protect tubulars and place chemistry inside a narrow operating window. Baker Hughes said in September 2025 that its Petrobras stimulation-vessel extension includes onboard laboratories, high-pressure pumps and chemical storage for well-specific treatments. Those assets reduce execution uncertainty, but failed chemistry can consume valuable vessel time.
Better candidate screening offers a practical route to expand use without increasing chemical exposure. SPE's Journal of Petroleum Technology described in August 2025 a dual-method program that used skin analysis and reservoir-pressure modeling before high-rate matrix acidizing, linking diagnostics to the treatment decision. Chemistry compatibility remains a separate laboratory gate for corrosion, scale and fluid interaction.
Which country CAGRs are profiled in the Matrix Acidizing Chemicals Market?
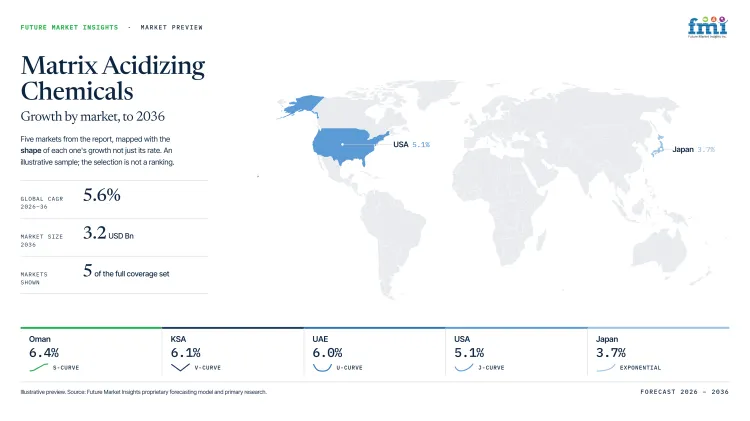
| Country | CAGR |
|---|---|
| Oman | 6.4% |
| KSA | 6.1% |
| UAE | 6.0% |
| Brazil | 5.5% |
| USA | 5.1% |
| Canada | 4.9% |
| Japan | 3.7% |
How do country-level CAGRs compare in the Matrix Acidizing Chemicals Market?
The 2.7-point spread separates a Gulf group at 6.0% or more from North American rates near 5.0%, with Brazil between them and Japan below both. The pattern reflects different intervention economics instead of current market size. Gulf markets pair active development with local service capacity, while mature North American basins apply tighter job-level return tests.
- Oman's mature carbonate programs favor Gulf-based intervention logistics.
- KSA's local-content model favors domestically qualified oilfield chemistry.
- UAE offshore campaigns penalize late chemical mobilization.
- Brazil's pre-salt schedules make vessel time a treatment cost.
- USA operators benchmark acidizing against refracturing and workovers.
- Canada's field distances make regional inventory economically important.
- Japan's low treatment frequency favors engineered small-batch supply.
Similar CAGRs can therefore lead to different order sizes, margins and service requirements. The full report provides country-level CAGR analysis across North America, Latin America, Western Europe, Eastern Europe, East Asia, South Asia and Pacific, and the Middle East and Africa.
Country-wise Analysis
- Mature carbonate fields in Oman keep matrix acidizing inside production-restoration programs where corrosion control and heat stability must fit existing completions and short intervention windows. Oman is projected to expand at 6.4% CAGR through 2036, tied to a producing base that Oman News Agency measured at 365.8 million barrels of oil in 2025 in its January 2026 release. Gulf inventory and local laboratories can shorten mobilization for repeat jobs, while imported specialty additives and well-specific compatibility testing raise lead-time risk for new entrants that must arrive with qualified chemistry before a workover slot is committed under tight field schedules.
- Jubail and the Eastern Province give KSA a concentrated base for manufacturing and qualifying oilfield chemicals near large upstream programs, which lowers replenishment time for planned carbonate interventions. GASTAT's March 2026 release showed Saudi oil activities grew 5.7% in 2025, giving local production capacity more work to support as fields shift from development into repeated production maintenance. High-temperature carbonate wells still demand strict corrosion screening, and the KSA market is forecast to grow at 6.1% CAGR over the assessment period owing to local-content requirements that reward qualified stock and field support close to producing assets on short notice.
- Abu Dhabi's offshore assets force chemical programs to align storage, vessel schedules and diversion design with long intervention windows, while onshore development keeps a separate flow of new wells entering production. The Abu Dhabi Media Office confirmed in June 2025 that Onshore Block 4 moved into a production concession with ADNOC at 60% and JODCO Exploration at 40%, expanding the future well base that local service organizations can support. The UAE is forecast to advance at 6.0% CAGR through 2036 aided by local service infrastructure, though offshore mobilization cost and heterogeneous formations keep qualification standards high for formulations that have not proved placement reliability in Gulf operating conditions.
- Deepwater matrix treatments in Brazil have to reach the platform with tested storage stability because vessel time and offshore resupply determine whether chemistry is ready inside a fixed intervention window. Brazil is projected to record 5.5% CAGR during the forecast period, given a 2025 oil base that ANP measured at 3.8 million barrels per day, 12% above 2024. Pre-salt scale gives established stimulation contractors a direct enabler through local logistics and vessel access, but specialty formulators face high failed-job exposure because an unstable or poorly placed treatment can consume scarce offshore operating time before another intervention slot becomes available.
- USA operators compare matrix acidizing with workovers and refracturing on expected production recovery, so chemistry has to earn its place against alternatives already supported by a deep service network. EIA's March 2026 data put 2025 crude output at a record 13.6 million barrels per day even with 5% fewer active Lower 48 rigs, showing a large producing base that increasingly depends on efficiency instead of rig additions. Domestic laboratories shorten mobilization as the USA market is forecast to post 5.1% CAGR by 2036 tied to selective interventions, but new formulations still need production-response and material-compatibility evidence before displacing established packages.
- Canadian matrix acidizing programs serve dispersed producing areas where seasonal access and long transport routes can decide whether specialty additives reach a field within its intervention window. Canada is projected to progress at 4.9% CAGR over the forecast period, supported by a producing base that Canada Energy Regulator measured at 5.35 million barrels per day in 2025, with Alberta accounting for 83.8%. Alberta's service corridors reduce mobilization time for remedial work, but freight distance and cold-weather handling increase inventory costs and force earlier compatibility screening for formulations destined for western fields with limited nearby chemical stock during winter campaigns.
- Japan's smaller domestic upstream base makes matrix acidizing a well-specific engineering purchase, so local laboratories support smaller batches and longer qualification cycles instead of high-frequency field programs. METI reported in February 2026 that Japan's oil and natural gas independent development ratio reached 42.1% in fiscal 2024, providing a limited but technically demanding base for production-maintenance work linked to Japanese-controlled supply. Imported specialty chemistry limits scale economies, and Japan is expected to register 3.7% CAGR over the assessment period because selective assets still require corrosion screening, small-batch preparation and reservoir-specific formulation support before field mobilization can safely begin onsite.
Who are the notable companies in the Matrix Acidizing Chemicals Market?
SLB, Halliburton, Baker Hughes, Clariant, Innospec, Nouryon, Italmatch Chemicals, and SNF are the notable companies serving this market.
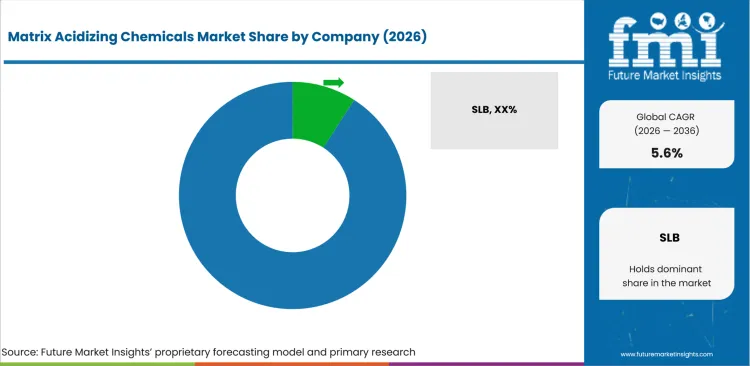
Competition separates integrated stimulation contractors from specialty formulators. SLB, Halliburton and Baker Hughes control broader design, pumping and field-execution workflows. Clariant, Innospec, Nouryon, Italmatch Chemicals and SNF compete on oilfield chemistry breadth, qualification records and regional supply. Field-service depth and documented formulation performance form the main entry barriers.
- Integrated stimulation and execution: SLB, Halliburton and Baker Hughes control broader treatment workflows that include placement, pumping and field-service coordination.
- Specialty oilfield chemistry: Clariant, Innospec and Nouryon focus on stimulation additives plus laboratory or regional technical support.
- Acidizing and formulation specialists: Italmatch Chemicals and SNF supply dedicated oilfield chemistry with portfolios that include stimulation and acidizing functions.
Competitive Benchmarking: Matrix Acidizing Chemicals Market
| Company | Matrix Acidizing Chemistry Breadth | Stimulation Program Integration | Qualification & Local Support | Geographic Reach |
|---|---|---|---|---|
| SLB | High | High | High | Global |
| Halliburton | High | High | High | Global |
| Baker Hughes | High | High | High | Global |
| Clariant | High | Medium | High | Global |
| Innospec | Low | Medium | High | North America, Middle East, Europe and Asia-Pacific |
| Nouryon | High | Medium | High | Global |
| Italmatch Chemicals | High | Low | High | Europe, Middle East, North America and international supply |
| SNF | High | Medium | High | North America, Europe, Middle East and Asia |
Scoring basis: High chemistry breadth requires a documented stimulation line with at least three directly relevant additive functions. Medium covers two functions and Low one. High program integration requires chemistry, treatment design and field execution. Medium covers chemistry plus application support and Low component supply. High qualification support requires multiple documented laboratories, manufacturing sites or service nodes. Medium requires one strong node and Low a limited support footprint.
Key Developments in the Matrix Acidizing Chemicals Market
- In August 2026, SLB signed a multi-year Equinor agreement for advanced reservoir stimulation services on the Norwegian Continental Shelf. The award secures dedicated vessel capacity, tying stimulation execution to offshore scheduling for tight reservoirs.
- In August 2025, SNF agreed to acquire Obsidian Chemical Solutions. SNF identified Obsidian's customized formulations for stimulation and acidizing within the transaction scope, extending its Permian chemical manufacturing and storage position.
- In October 2025, Halliburton received multiple Petrobras contracts for deepwater vessel stimulation and completion services in Brazil. Stim Star Brasil will provide stimulation services focused on reservoir productivity in a service package built for Petrobras operations.
Key Players in the Matrix Acidizing Chemicals Market
Integrated Stimulation Design and Execution
- SLB
- Halliburton
- Baker Hughes
Specialty Stimulation Chemistry and Additives
- Clariant
- Innospec
- Nouryon
Acidizing and Oilfield Formulation Specialists
- Italmatch Chemicals
- SNF
Matrix Acidizing Chemicals Market - Report Scope
| Coverage field | Report scope |
|---|---|
| Market breakdown | By chemical type, reservoir type, application, well type, sales channel and region. |
| Quantitative Units | USD billion. |
| Market Definition | Revenue includes formulated acids and additive packages sold for matrix acidizing within the stated segmentation universe. Service-execution fees, pumping equipment, software, hydraulic-fracturing fluids outside matrix acidizing and general industrial acids are excluded. |
| Regions Covered | North America, Latin America, Western Europe, Eastern Europe, East Asia, South Asia and Pacific, and Middle East and Africa. |
| Countries Covered | Oman, KSA, UAE, Brazil, USA, Canada, Japan, and 20+ countries included in the full report. |
| Key Companies Profiled | SLB, Halliburton, Baker Hughes, Clariant, Innospec, Nouryon, Italmatch Chemicals, SNF. |
| Forecast Period | 2026 to 2036. |
| Approach | Primary and secondary research with market triangulation. |
Matrix Acidizing Chemicals Market - Research Methodology
| Method | Approach |
|---|---|
| Primary Research | FMI analysts gathered input from manufacturers, service providers, technology developers, distributors, end users, procurement teams, and subject-matter experts. Interviews examined purchasing decisions, product or service evaluation, adoption barriers, approval requirements, pricing considerations, and expectations for technical or commercial support. Respondents were also asked what evidence is required before a trial, pilot, or initial order develops into regular purchasing. |
| Desk Research | Desk research covered government statistics, regulatory publications, trade data, industry associations, technical literature, standards, company filings, product information, and official corporate announcements. Sources were reviewed for relevance, publication date, geographic coverage, and consistency with the defined market scope. Claims relating to performance, applications, approvals, capacity, investment, and commercial activity were retained only when supported by credible public evidence. |
| Market Sizing and Forecasting | The market model combined the baseline value with historical performance, segment structure, pricing and volume indicators, adoption levels, company participation, and country-level demand conditions. Forecast assumptions considered economic activity, investment trends, regulatory developments, technology adoption, purchasing cycles, supply availability, and barriers to wider market use. Segment and regional estimates were reconciled before the final market total was calculated. |
| Data Validation | Estimates were checked against multiple independent indicators, including public data, company activity, trade patterns, industry developments, and findings from primary interviews. Validation also tested whether products, services, applications, and company revenues fell within the defined market boundaries. Adjacent categories, unsupported claims, overlapping revenues, and activities without direct market relevance were excluded to reduce double counting and maintain consistency across segments and countries. |
Matrix Acidizing Chemicals Market by Segments
Matrix Acidizing Chemicals Market segmented by Chemical Type:
- Hydrochloric acid systems
- Mud acid systems
- Organic acid systems
- Chelating agents
- Corrosion inhibitors
- Surfactant packages
Matrix Acidizing Chemicals Market segmented by Reservoir Type:
- Carbonate reservoirs
- Sandstone reservoirs
- Mixed lithology
- HPHT reservoirs
- Mature reservoirs
Matrix Acidizing Chemicals Market segmented by Application:
- Near-wellbore damage removal
- Permeability restoration
- Scale removal
- Stimulation
- Pre-frac treatment
Matrix Acidizing Chemicals Market segmented by Well Type:
- Oil wells
- Gas wells
- Horizontal wells
- Offshore wells
- Unconventional wells
Matrix Acidizing Chemicals Market segmented by Sales Channel:
- Stimulation service companies
- Direct operator contracts
- Specialty chemical suppliers
- Regional distributors
Matrix Acidizing Chemicals Market by Region:
- North America
- United States
- Canada
- Latin America
- Brazil
- Mexico
- Argentina
- Chile
- Western Europe
- Germany
- France
- United Kingdom
- Italy
- Spain
- Benelux
- Nordics
- Eastern Europe
- Poland
- Czech Republic
- Romania
- Hungary
- East Asia
- China
- Japan
- South Korea
- South Asia and Pacific
- India
- ASEAN
- Australia and New Zealand
- Middle East and Africa
- GCC Countries
- South Africa
- Türkiye
- Israel
Research Sources and Bibliography
- International Energy Agency. (2025, June 5). World Energy Investment 2025.
- International Energy Agency. (2025, June 17). Oil 2025: Analysis and forecast to 2030.
- Society of Petroleum Engineers. (2025, March 1). Case Study • Beyond Acid: Advancing Unconventional Reservoir Recovery With Chemical Restimulation.
- Society of Petroleum Engineers. (2025, June 1). Study Investigates Effect of Fracture and Vug Networks on Acid-Stimulation Process.
- Society of Petroleum Engineers. (2025, June 1). Autonomous Flow-Control Devices Optimize Matrix Acid Stimulation.
- Society of Petroleum Engineers. (2025, June 1). Targeted Acid-Stimulation Technique Enhances Production in the Montney.
- Halliburton. (2025, August 13). ConocoPhillips awards Halliburton multi-year well stimulation services contract in the North Sea.
- International Energy Agency. (2025, September 16). The Implications of Oil and Gas Field Decline Rates.
- Baker Hughes. (2025, September 17). Baker Hughes Secures Multi-Year Contract with Petrobras for Offshore Stimulation Vessels.
- Society of Petroleum Engineers. (2025, August 1). Analysis, Skin Calculation With Dual-Method Stimulation Enhances Gas Production.
- Oman News Agency. (2026, January 27). Oman's Oil Exports Surpass 307 Million Barrels by End of December 2025.
- General Authority for Statistics. (2026, March 9). GASTAT: Saudi economy records 4.5% growth in 2025.
- Abu Dhabi Media Office. (2025, June 11). Supreme Council for Financial and Economic Affairs awards 3 oil and gas production concessions to ADNOC and partners.
- Agência Nacional do Petróleo, Gás Natural e Biocombustíveis. (2026, June 30). ANP divulga dados consolidados do setor regulado em 2025.
- USA Energy Information Administration. (2026, March 31). USA crude oil production rose in 2025, setting new record.
- Canada Energy Regulator. (2026, June 17). Market Snapshot: Canada sets new record in crude oil production in 2025.
- Ministry of Economy, Trade and Industry. (2026, February 17). FY2024 Independent Development Ratio of Oil and Natural Gas in Japan Released.
- SLB. (2026, August 6). SLB and Equinor Sign Multi-Year Stimulation Agreement for Norwegian Continental Shelf.
- Halliburton. (2025, October 15). Petrobras awards Halliburton deepwater contracts for completion and stimulation services in Brazil.
- SNF. (2025, August 15). SNF to Acquire Obsidian Chemical Solutions LLC.
- Innospec Inc. (2026, February 18). Annual report on Form 10-K for the year ended December 31, 2025.
- Italmatch Chemicals. (2025, March 12). Strategic redefinition of Italmatch's business units.
- SLB. (2025, July 16). SLB Completes Acquisition of ChampionX.
- Clariant. (2025, September 8). Clariant Oil Services launches customer portal for seamless digital access.
- Halliburton. (2026, February 22). Pertamina and Halliburton sign an integrated unconventional fracturing MOU in Indonesia.
- Nouryon. (2025, June 18). Nouryon launches Innovation Center for oilfield solutions in Texas, US.
- Innospec. (2025, March 24). Innospec Announces LaZuli™ Product Line for Deepwater Subsea Production.
- Baker Hughes. (2026, April 28). 2025 Corporate Sustainability Report.
- Clariant. (2025, November 3). Clariant Oil Services recognized by Petrobras with Best Suppliers Award for Chemical Products.
- SLB. (2025, December 23). Aramco Awards SLB Long-Term Contract to Support Kingdom's Unconventional Gas Production Growth.
- Halliburton. (2026, July 15). Aramco awards Halliburton long-term contract for unconventional gas program.
- Baker Hughes. (2026, September 2). Baker Hughes Collaborates with OGDC to Optimize Existing Well Production.
- Clariant. (2026, July 29). Clariant appoints Gapuma Group as Well Service Additives distributor across West Africa.
- Innospec. (2025, April 9). Innospec Oilfield Services' OKC manufacturing center has earned ISO 9001 certification!
- Nouryon. (2025, February 10). Nouryon opens new office in Al Dhahran to strengthen presence in Saudi Arabia and the Middle East.
- BSI. (2025, February 26). ISO 45001:2018 certificate for Italmatch Chemicals GB Ltd and Aubin Energy DMCC.
- SNF. (2026, January 2). SNF GROUP COMPLETES THE ACQUISITION OF THE OIL & GAS DIVISION OF SYENSQO.
This bibliography is provided for reader reference and is not exhaustive. The full report contains the complete reference list and detailed citations.
This Report Answers
- How large is the matrix acidizing chemicals market in 2026 and what value is forecast for 2036?
- Which existing-well economics support repeat demand for matrix acidizing chemistry?
- Why do hydrochloric acid systems hold the leading position within chemical type?
- How do carbonate reservoirs change reaction control and additive requirements?
- Why does near-wellbore damage removal lead the application category?
- How do country growth rates differ across Oman, KSA, UAE, Brazil, USA, Canada and Japan?
- Which companies integrate stimulation services with specialty acidizing chemistry?
- What corrosion, placement, qualification and logistics conditions can limit treatment economics?
Frequently Asked Questions
How big is the Matrix Acidizing Chemicals Market in 2026?
The matrix acidizing chemicals market is valued at USD 1.9 billion in 2026 and is projected to reach USD 3.2 billion by 2036. Existing-well production recovery supports demand where localized formation damage can be treated below fracture pressure.
What is the CAGR of the Matrix Acidizing Chemicals Market from 2026 to 2036?
The matrix acidizing chemicals market is projected to grow at a CAGR of 5.6% between 2026 and 2036. Production-restoration work on producing wells supports expansion where reservoir contact remains commercially recoverable.
Which chemical type leads the Matrix Acidizing Chemicals Market?
The hydrochloric acid systems segment is expected to hold 28.0% of chemical type demand in the matrix acidizing chemicals market in 2026, driven by familiar field practice and broad additive compatibility. Engineers can tune reaction and placement with inhibitors, retarders and diversion additives.
Which application leads the Matrix Acidizing Chemicals Market?
The near-wellbore damage removal segment is expected to hold 31.0% of application demand in the matrix acidizing chemicals market in 2026, attributable to its direct link with recoverable productivity loss. Operators can compare treatment cost with expected recovered production without funding a new fracture network.
Which countries are projected to record the highest growth in the Matrix Acidizing Chemicals Market?
Oman is projected to grow at 6.4% CAGR, followed by KSA at 6.1% and UAE at 6.0% through 2036. Local service capacity and active upstream programs distinguish the Gulf growth group.
Which companies are active in the Matrix Acidizing Chemicals Market?
Key companies operating in the market include SLB, Halliburton, Baker Hughes, Clariant, Innospec, Nouryon, Italmatch Chemicals, and SNF. Integrated contractors coordinate field execution, while specialty formulators compete on chemistry breadth, qualification support and regional supply.
Preview the report firsthand - request a free sample
Get SampleGet the brochure for pricing and purchase details.
Get PDFTable of Content
- Key Takeaways
- Market Size and CAGR
- Top Growth Driver
- Fastest Growing Segment
- Leading Region
- Key Companies
- Emerging Opportunities
- Executive Summary
- Global Market Outlook
- Demand-side Trends
- Supply-side Trends
- Technology Roadmap Analysis
- Analysis and Recommendations
- Analyst Perspective (What is happening? Why now? What should investors know?)
- Key Questions Answered
- How large is the market?
- What is the CAGR?
- What are key trends?
- Which region dominates?
- Who are the leaders?
- Market Overview
- Market Coverage / Taxonomy
- Market Definition / Scope / Limitations
- Research Methodology
- Chapter Orientation
- Analytical Lens and Working Hypotheses
- Market Structure, Signals, and Trend Drivers
- Benchmarking and Cross-market Comparability
- Market Sizing, Forecasting, and Opportunity Mapping
- Research Design and Evidence Framework
- Desk Research Programme (Secondary Evidence)
- Expert Input and Fieldwork (Primary Evidence)
- Tooling, Models, and Reference Databases
- Data Engineering and Model Build
- Quality Assurance and Audit Trail
- Market Background
- Market Dynamics (Drivers, Restraints, Opportunity, Trends)
- Scenario Forecast (Optimistic, Likely, Conservative)
- Impact Analysis
- AI Impact
- Sustainability Impact
- Regulatory Impact
- Technology Impact
- Consumer / Buyer Analysis
- Purchase Drivers
- Adoption Barriers
- Buyer Journey
- Opportunity Map Analysis
- Product Life Cycle Analysis
- Supply Chain Analysis
- Investment Feasibility Matrix
- Value Chain Analysis
- PESTLE and Porter's Analysis
- Regulatory Landscape
- Regional Parent Market Outlook
- Production and Consumption Statistics
- Import and Export Statistics
- Global Market Analysis and Forecast, 2021 to 2036
- Historical Market Size Value (USD Billion) Analysis, 2021 to 2025
- Current and Future Market Size Value (USD Billion) Projections, 2026 to 2036
- Y-o-Y Growth Trend Analysis
- Absolute $ Opportunity Analysis
- Global Market Pricing Analysis, 2021 to 2036
- Global Market Analysis and Forecast, By Chemical Type, 2021 to 2036
- Introduction / Key Findings
- Historical Market Size Value (USD Billion) Analysis By Chemical Type, 2021 to 2025
- Current and Future Market Size Value (USD Billion) Analysis and Forecast By Chemical Type, 2026 to 2036
- Hydrochloric acid systems
- Mud acid systems
- Organic acid systems
- Chelating agents
- Corrosion inhibitors
- Surfactant packages
- Hydrochloric acid systems
- Y-o-Y Growth Trend Analysis By Chemical Type, 2021 to 2025
- Absolute $ Opportunity Analysis By Chemical Type, 2026 to 2036
- Global Market Analysis and Forecast, By Reservoir Type, 2021 to 2036
- Introduction / Key Findings
- Historical Market Size Value (USD Billion) Analysis By Reservoir Type, 2021 to 2025
- Current and Future Market Size Value (USD Billion) Analysis and Forecast By Reservoir Type, 2026 to 2036
- Carbonate reservoirs
- Sandstone reservoirs
- Mixed lithology
- HPHT reservoirs
- Mature reservoirs
- Carbonate reservoirs
- Y-o-Y Growth Trend Analysis By Reservoir Type, 2021 to 2025
- Absolute $ Opportunity Analysis By Reservoir Type, 2026 to 2036
- Global Market Analysis and Forecast, By Application, 2021 to 2036
- Introduction / Key Findings
- Historical Market Size Value (USD Billion) Analysis By Application, 2021 to 2025
- Current and Future Market Size Value (USD Billion) Analysis and Forecast By Application, 2026 to 2036
- Near-wellbore damage removal
- Permeability restoration
- Scale removal
- Stimulation
- Pre-frac treatment
- Near-wellbore damage removal
- Y-o-Y Growth Trend Analysis By Application, 2021 to 2025
- Absolute $ Opportunity Analysis By Application, 2026 to 2036
- Global Market Analysis and Forecast, By Well Type, 2021 to 2036
- Introduction / Key Findings
- Historical Market Size Value (USD Billion) Analysis By Well Type, 2021 to 2025
- Current and Future Market Size Value (USD Billion) Analysis and Forecast By Well Type, 2026 to 2036
- Oil wells
- Gas wells
- Horizontal wells
- Offshore wells
- Unconventional wells
- Oil wells
- Y-o-Y Growth Trend Analysis By Well Type, 2021 to 2025
- Absolute $ Opportunity Analysis By Well Type, 2026 to 2036
- Global Market Analysis and Forecast, By Sales Channel, 2021 to 2036
- Introduction / Key Findings
- Historical Market Size Value (USD Billion) Analysis By Sales Channel, 2021 to 2025
- Current and Future Market Size Value (USD Billion) Analysis and Forecast By Sales Channel, 2026 to 2036
- Stimulation service companies
- Direct operator contracts
- Specialty chemical suppliers
- Regional distributors
- Stimulation service companies
- Y-o-Y Growth Trend Analysis By Sales Channel, 2021 to 2025
- Absolute $ Opportunity Analysis By Sales Channel, 2026 to 2036
- Global Market Analysis and Forecast, By Region, 2021 to 2036
- Introduction
- Historical Market Size Value (USD Billion) Analysis By Region, 2021 to 2025
- Current Market Size Value (USD Billion) Analysis and Forecast By Region, 2026 to 2036
- North America
- Latin America
- Western Europe
- Eastern Europe
- East Asia
- South Asia and Pacific
- Middle East & Africa
- Market Attractiveness Analysis By Region
- North America Market Analysis and Forecast, By Country, 2021 to 2036
- Historical Market Size Value (USD Billion) Trend Analysis By Market Taxonomy, 2021 to 2025
- Market Size Value (USD Billion) Forecast By Market Taxonomy, 2026 to 2036
- By Country
- USA
- Canada
- By Chemical Type
- By Reservoir Type
- By Application
- By Well Type
- By Sales Channel
- By Country
- Market Attractiveness Analysis
- By Country
- By Chemical Type
- By Reservoir Type
- By Application
- By Well Type
- By Sales Channel
- Key Takeaways
- Latin America Market Analysis and Forecast, By Country
- Historical Market Size Value (USD Billion) Trend Analysis By Market Taxonomy, 2021 to 2025
- Market Size Value (USD Billion) Forecast By Market Taxonomy, 2026 to 2036
- By Country
- Brazil
- Mexico
- Chile
- Rest of Latin America
- By Chemical Type
- By Reservoir Type
- By Application
- By Well Type
- By Sales Channel
- By Country
- Market Attractiveness Analysis
- By Country
- By Chemical Type
- By Reservoir Type
- By Application
- By Well Type
- By Sales Channel
- Key Takeaways
- Western Europe Market Analysis and Forecast, By Country
- Historical Market Size Value (USD Billion) Trend Analysis By Market Taxonomy, 2021 to 2025
- Market Size Value (USD Billion) Forecast By Market Taxonomy, 2026 to 2036
- By Country
- Germany
- UK
- Italy
- Spain
- France
- Nordic
- BENELUX
- Rest of Western Europe
- By Chemical Type
- By Reservoir Type
- By Application
- By Well Type
- By Sales Channel
- By Country
- Market Attractiveness Analysis
- By Country
- By Chemical Type
- By Reservoir Type
- By Application
- By Well Type
- By Sales Channel
- Key Takeaways
- Eastern Europe Market Analysis and Forecast, By Country
- Historical Market Size Value (USD Billion) Trend Analysis By Market Taxonomy, 2021 to 2025
- Market Size Value (USD Billion) Forecast By Market Taxonomy, 2026 to 2036
- By Country
- Russia
- Poland
- Hungary
- Balkan & Baltic
- Rest of Eastern Europe
- By Chemical Type
- By Reservoir Type
- By Application
- By Well Type
- By Sales Channel
- By Country
- Market Attractiveness Analysis
- By Country
- By Chemical Type
- By Reservoir Type
- By Application
- By Well Type
- By Sales Channel
- Key Takeaways
- East Asia Market Analysis and Forecast, By Country
- Historical Market Size Value (USD Billion) Trend Analysis By Market Taxonomy, 2021 to 2025
- Market Size Value (USD Billion) Forecast By Market Taxonomy, 2026 to 2036
- By Country
- China
- Japan
- South Korea
- By Chemical Type
- By Reservoir Type
- By Application
- By Well Type
- By Sales Channel
- By Country
- Market Attractiveness Analysis
- By Country
- By Chemical Type
- By Reservoir Type
- By Application
- By Well Type
- By Sales Channel
- Key Takeaways
- South Asia and Pacific Market Analysis and Forecast, By Country
- Historical Market Size Value (USD Billion) Trend Analysis By Market Taxonomy, 2021 to 2025
- Market Size Value (USD Billion) Forecast By Market Taxonomy, 2026 to 2036
- By Country
- India
- ASEAN
- Australia & New Zealand
- Rest of South Asia and Pacific
- By Chemical Type
- By Reservoir Type
- By Application
- By Well Type
- By Sales Channel
- By Country
- Market Attractiveness Analysis
- By Country
- By Chemical Type
- By Reservoir Type
- By Application
- By Well Type
- By Sales Channel
- Key Takeaways
- Middle East & Africa Market Analysis and Forecast, By Country
- Historical Market Size Value (USD Billion) Trend Analysis By Market Taxonomy, 2021 to 2025
- Market Size Value (USD Billion) Forecast By Market Taxonomy, 2026 to 2036
- By Country
- Kingdom of Saudi Arabia
- Other GCC Countries
- Türkiye
- South Africa
- Other African Union
- Rest of Middle East & Africa
- By Chemical Type
- By Reservoir Type
- By Application
- By Well Type
- By Sales Channel
- By Country
- Market Attractiveness Analysis
- By Country
- By Chemical Type
- By Reservoir Type
- By Application
- By Well Type
- By Sales Channel
- Key Takeaways
- Key Countries Market Analysis
- USA
- Pricing Analysis
- Market Share Analysis, 2025
- By Chemical Type
- By Reservoir Type
- By Application
- By Well Type
- By Sales Channel
- Canada
- Pricing Analysis
- Market Share Analysis, 2025
- By Chemical Type
- By Reservoir Type
- By Application
- By Well Type
- By Sales Channel
- Mexico
- Pricing Analysis
- Market Share Analysis, 2025
- By Chemical Type
- By Reservoir Type
- By Application
- By Well Type
- By Sales Channel
- Brazil
- Pricing Analysis
- Market Share Analysis, 2025
- By Chemical Type
- By Reservoir Type
- By Application
- By Well Type
- By Sales Channel
- Chile
- Pricing Analysis
- Market Share Analysis, 2025
- By Chemical Type
- By Reservoir Type
- By Application
- By Well Type
- By Sales Channel
- Germany
- Pricing Analysis
- Market Share Analysis, 2025
- By Chemical Type
- By Reservoir Type
- By Application
- By Well Type
- By Sales Channel
- UK
- Pricing Analysis
- Market Share Analysis, 2025
- By Chemical Type
- By Reservoir Type
- By Application
- By Well Type
- By Sales Channel
- Italy
- Pricing Analysis
- Market Share Analysis, 2025
- By Chemical Type
- By Reservoir Type
- By Application
- By Well Type
- By Sales Channel
- Spain
- Pricing Analysis
- Market Share Analysis, 2025
- By Chemical Type
- By Reservoir Type
- By Application
- By Well Type
- By Sales Channel
- France
- Pricing Analysis
- Market Share Analysis, 2025
- By Chemical Type
- By Reservoir Type
- By Application
- By Well Type
- By Sales Channel
- India
- Pricing Analysis
- Market Share Analysis, 2025
- By Chemical Type
- By Reservoir Type
- By Application
- By Well Type
- By Sales Channel
- ASEAN
- Pricing Analysis
- Market Share Analysis, 2025
- By Chemical Type
- By Reservoir Type
- By Application
- By Well Type
- By Sales Channel
- Australia & New Zealand
- Pricing Analysis
- Market Share Analysis, 2025
- By Chemical Type
- By Reservoir Type
- By Application
- By Well Type
- By Sales Channel
- China
- Pricing Analysis
- Market Share Analysis, 2025
- By Chemical Type
- By Reservoir Type
- By Application
- By Well Type
- By Sales Channel
- Japan
- Pricing Analysis
- Market Share Analysis, 2025
- By Chemical Type
- By Reservoir Type
- By Application
- By Well Type
- By Sales Channel
- South Korea
- Pricing Analysis
- Market Share Analysis, 2025
- By Chemical Type
- By Reservoir Type
- By Application
- By Well Type
- By Sales Channel
- Russia
- Pricing Analysis
- Market Share Analysis, 2025
- By Chemical Type
- By Reservoir Type
- By Application
- By Well Type
- By Sales Channel
- Poland
- Pricing Analysis
- Market Share Analysis, 2025
- By Chemical Type
- By Reservoir Type
- By Application
- By Well Type
- By Sales Channel
- Hungary
- Pricing Analysis
- Market Share Analysis, 2025
- By Chemical Type
- By Reservoir Type
- By Application
- By Well Type
- By Sales Channel
- Kingdom of Saudi Arabia
- Pricing Analysis
- Market Share Analysis, 2025
- By Chemical Type
- By Reservoir Type
- By Application
- By Well Type
- By Sales Channel
- Türkiye
- Pricing Analysis
- Market Share Analysis, 2025
- By Chemical Type
- By Reservoir Type
- By Application
- By Well Type
- By Sales Channel
- South Africa
- Pricing Analysis
- Market Share Analysis, 2025
- By Chemical Type
- By Reservoir Type
- By Application
- By Well Type
- By Sales Channel
- USA
- Market Structure Analysis
- Competition Dashboard
- Competition Benchmarking
- Market Share Analysis of Top Players
- By Regional
- By Chemical Type
- By Reservoir Type
- By Application
- By Well Type
- By Sales Channel
- Emerging Startups
- Innovation Benchmarking
- Competition Analysis
- Competition Deep Dive
- SLB
- Overview
- Product Portfolio
- Profitability by Market Segments
- Sales Footprint
- Strategy Overview
- Marketing Strategy
- Product Strategy
- Channel Strategy
- Halliburton
- Baker Hughes
- ChampionX
- Clariant
- Innospec
- Nouryon
- Solvay
- TETRA Technologies
- Aubin Group
- SLB
- Case Studies
- Success Stories
- Recent Developments
- Competition Deep Dive
- Assumptions & Acronyms Used


