

- Market Size (2026)
- USD 475.8 Mn
- Forecast (2036)
- USD 1075.7 Mn
- CAGR (2026 to 2036)
- 8.5%
How big is Megawatt AI Rack Transient Buffering Systems Market in 2026?
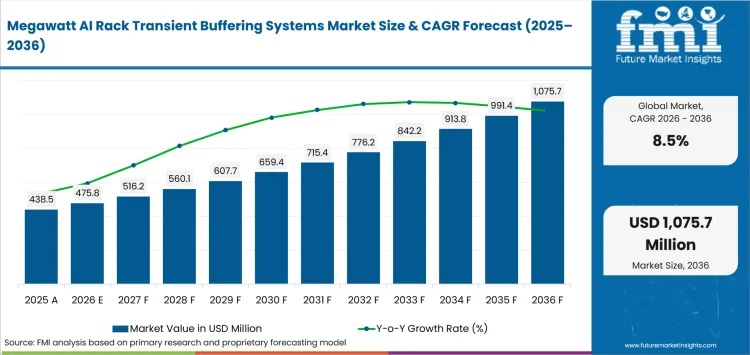
USD 475.8 million in 2026 and USD 1,075.7 million by 2036 at an 8.5% CAGR.
Demand for megawatt AI rack transient buffering systems is projected to expand at 8.5% CAGR between 2026 and 2036, increasing valuation from USD 475.8 million in 2026 to USD 1,075.7 million by 2036. Synchronized accelerator fleets make short electrical excursions a design problem instead of an occasional disturbance. In May 2026 the USA Department of Energy documented repetitive electrical oscillations from tightly coordinated AI chips. Fast local buffering limits how far those oscillations travel into generators and switchgear before reaching upstream utility equipment.
France offers a different order path because connection-ready greenfield sites let developers specify transient control while electrical packages remain open. The French Economy Ministry identified 63 suitable data-center sites in January 2026 after screening land availability and grid connection conditions. The 63-site screening gives developers a planning advantage while mature USA campuses carry more retrofit compatibility work.
Key Takeaways
- Synchronized accelerator fleets are increasing demand for systems that absorb short power excursions before voltage and load instability reaches upstream equipment.
- By solution function, transient buffering is estimated to hold 25.0% in 2026 owing to direct control of fast workload-driven power excursions.
- In 2026, the 1-10 ms segment is expected to lead response time with 32.0% share because it balances rapid intervention with usable energy capacity.
- The 250-500 kW segment is projected to hold 34.0% of rack - pod load demand in 2026, attributable to the present transition toward higher compute density.
- Qualification slows wider adoption since protection settings and energy storage controls must operate safely under normal cycling and fault conditions.
- Some of the key players in this market include Skeleton Technologies, Piller Group GmbH, Eaton Corporation plc, Vertiv Holdings Co., Schneider Electric SE, Delta Electronics, Inc., ABB Ltd., and Flex Ltd.
Analyst Perspective
"Electrical architects should test a buffer against representative GPU load steps and the site's fault-clearing scheme before comparing purchase price. A qualified design earns value by reducing upstream peak exposure without forcing a separate protection architecture or an additional service path."
- Sudip saha, Principal Consultant, Future Market Insights
How is the Megawatt AI Rack Transient Buffering Systems Market segmented?
Solution Function, Response Time, Rack - pod Load, Facility Type, Sales Channel and Region.
Market taxonomy covers solution function (transient buffering, harmonic mitigation, voltage ride-through, power-factor correction, event measurement / recording), response time (1-10 ms, sub-millisecond, 11-100 ms, above 100 ms), rack - pod load (250-500 kW, below 250 kW, 501-750 kW, above 750 kW), facility type (hyperscale AI, colocation, enterprise data centers, HPC / research), sales channel (OEM direct, electrical integrator / EPC, power-quality specialist, distributor / service partner), and region.
What makes Transient buffering central to the Solution Function category?
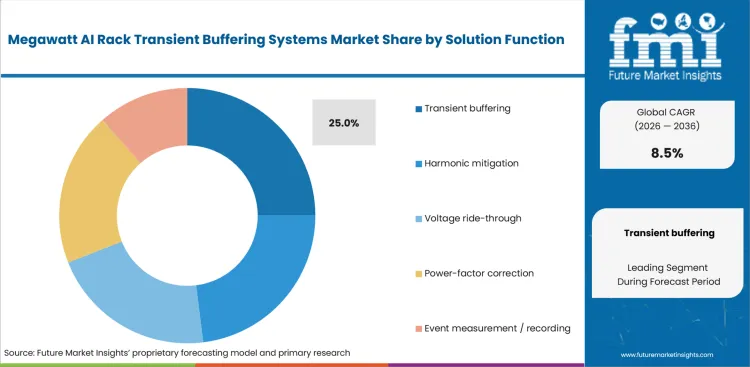
Transient buffering addresses the immediate mismatch between GPU load steps and slower upstream electrical infrastructure in dense AI racks. Supercapacitor systems are especially useful where repeated charge and discharge must follow accelerator cycles without imposing the same duty on generators or remote batteries.
- By solution function the transient buffering segment is estimated to hold 25.0% in 2026 owing to direct control of fast workload-driven excursions.
- Skeleton Technologies launched GrapheneGPU in May 2025 after hyperscaler-profile validation and scheduled initial shipments for June. The system targets repeated AI power peaks so those excursions do not propagate into the wider facility electrical chain.
Why does 1-10 ms lead the Response Time category?
The 1-10 ms window catches abrupt rack events early enough to shield slower facility equipment from the first load step. Vertiv documented in December 2025 that its AI Load Simulator moved from first use in Bologna toward global testing of complete power trains. Modular UPS systems give electrical teams a control point between rack electronics and upstream distribution.
- In 2026, the 1-10 ms segment is expected to lead response time with 32.0% share due to its fit between fast intervention and usable energy sizing.
- Electrical teams use this band to test UPS transfer behavior against repeatable GPU load steps during final buffer sizing.
How does 250-500 kW shape demand within the Rack - Pod load category?
The 250-500 kW class covers dense installations that need stronger buffering while many racks remain below megawatt power. Power distribution units must absorb larger steps while keeping protection and conversion compatible with the facility bus.
- The 250-500 kW segment is projected to hold 34.0% of rack - pod load demand in 2026 because it captures the present transition to higher compute density.
- Schneider Electric disclosed an 800 VDC sidecar in October 2025 with modular energy storage for load smoothing and rack support up to 1.2 MW. Its architecture lets current projects scale into higher rack voltages without replacing the whole power path.
What supports Hyperscale AI within the Facility Type category?
Hyperscale AI sites expose electrical equipment to synchronized accelerator fleets that produce larger steps than mixed enterprise workloads. Piller Group GmbH stated in June 2025 that more than 200 battery-free UPS units were being supplied for the Nebius Mäntsälä expansion. Data center power management therefore becomes a rack-to-facility task that must preserve compute uptime without overloading generation or grid connections.
- By facility type, hyperscale AI is forecast to represent 45.0% in 2026 owing to the concentration of high-density compute and coordinated workload changes.
- One rack event can appear at several distribution layers during fleet-wide workload shifts, so operators need repeatable stabilization through the power train.
What are the drivers, restraints and opportunities in the Megawatt AI Rack Transient Buffering Systems Market?
Synchronized GPU loads increase demand for fast buffering while 800 VDC safety qualification slows deployment and integrated DC power architectures widen the revenue route.
- Driver: Repetitive accelerator load steps make rapid power smoothing part of normal AI facility operation instead of an outage-only function.
- Restraint: Higher DC voltages require protection studies that account for capacitor placement and fault-clearing behavior before operators approve new architectures.
- Opportunity: Pre-engineered DC power blocks can package buffering with conversion and protection so operators qualify fewer site-specific interfaces.
Synchronized AI Load Steps Increase Buffering Demand
Synchronized accelerator fleets impose repeated electrical swings that generators and utility feeds cannot follow at the same speed. Eaton documented edge-based detection of AI power bursts in September 2025, giving operators event records that reveal where oscillations enter the facility power train. Electrical disturbance analytics then lets engineering teams size short-duration buffers against measured duty cycles instead of relying only on rack nameplate power.
800 VDC Safety Work Extends Qualification
Transient fault current and clearing time determine whether a buffering design is safe to maintain, so power quality monitoring cannot replace protection coordination. Schneider Electric's August 2026 arc-flash study tested two 800 VDC architectures and found that capacitor placement changes early fault behavior. Engineering teams therefore need fault studies that cover capacitor discharge and protective-device behavior as they prepare repeated deployments.
Integrated DC Power Blocks Shift Revenue Toward Pre-Engineered Systems
Pre-engineered DC power blocks give integrators one place to coordinate buffering and conversion with protection settings for dense AI racks. AI rack power budgeting becomes more useful once electrical teams can compare buffer placement against conversion losses and fault behavior in a repeatable block. ABB's October 2025 NVIDIA collaboration placed 800 VDC distribution and higher-voltage UPS architecture inside one grid-to-rack design program, giving equipment makers a clearer route to sell qualified power blocks.
Which country CAGRs are profiled in the Megawatt AI Rack Transient Buffering Systems Market?
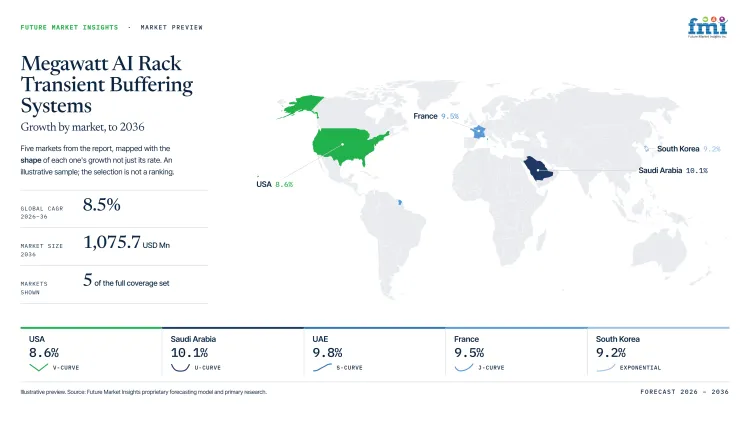
| Country | CAGR |
|---|---|
| Saudi Arabia | 10.1% |
| UAE | 9.8% |
| France | 9.5% |
| South Korea | 9.2% |
| USA | 8.6% |
How do country-level CAGRs compare in the Megawatt AI Rack Transient Buffering Systems Market?
The country CAGRs span 1.5 percentage points and form a tight growth band led by Gulf greenfield projects. France follows closely while South Korea and the USA occupy the lower range for different reasons. The narrow spread masks different project timing, site constraints and electrical redesign requirements before transient-control equipment reaches procurement.
- Saudi Arabia pairs hyperscale campuses with large on-site power programs.
- UAE projects can pair nuclear, solar and gas supply within one hyperscale campus plan.
- France pairs nuclear-heavy generation with data center power engineering for dense campuses.
- South Korea draws on domestic electronics expertise for high-density power conversion.
- USA procurement spans owner-operated hyperscalers and major colocation platforms.
Similar CAGRs therefore produce different order timing because each country reaches procurement through a distinct infrastructure path. The full report provides country-level CAGR analysis across North America, Latin America, Europe, East Asia, South Asia, Oceania and the Middle East and Africa.
Country-wise Analysis
- Greenfield AI campuses let developers set high-voltage distribution and transient-control requirements while EPC packages remain open for major equipment decisions. Saudi demand is projected to record 10.1% CAGR during the assessment period because MCIT documented operational data-center capacity above 440 MW in 2025. Local EPC access and expanding service coverage shorten qualification for buffers that must coordinate with new high-voltage distribution packages. The same schedule leaves little time to rerun transient studies once package interfaces are frozen. Compressed construction schedules require power quality test systems to prove repeatable behavior so later campus phases can reuse the electrical design.
- Abu Dhabi developers are sequencing large AI campuses with repeatable power blocks that must be qualified during each cluster's commissioning sequence under a fixed 2026 calendar. Abu Dhabi Media Office stated in May 2025 that Stargate UAE's first 200-megawatt cluster is expected to go live in 2026. Demand for megawatt AI rack transient buffering systems in the UAE is forecast to rise at 9.8% CAGR over the forecast period driven by greenfield specification freedom. Platform interoperability is a qualification risk, so electrical teams need stable interfaces early enough for later campus phases to reuse the first power design for successive buildings.
- Large AI campuses can draw on established high-voltage engineering while new connection studies determine how much power each site can secure for dense compute. France exported 90 TWh of electricity during 2024 according to the Élysée's February 2025 statement, giving new data-center projects additional system headroom. France is estimated to post 9.5% CAGR over the forecast period given its power base and dense European electrical engineering capacity. Early grid connection planning gives developers a clearer sequence for electrical studies and major equipment reservations. Buffering packages must fit local connection studies and European protection practice for EPC teams to accept one design across several rack generations on the same campus.
- Adoption of megawatt AI rack transient buffering systems in South Korea is estimated to expand at 9.2% CAGR through 2036 tied to public compute investment. MSIT's February 2025 plan targets 18,000 high-performance GPUs and improved rules for AI data-center locations and power supply. Dense metropolitan sites leave little tolerance for inefficient power footprints, which makes compact buffering hardware and local commissioning support commercially relevant. Local integrators can shorten commissioning by working within established domestic protection standards and service practices. The remaining constraint is physical: unfamiliar equipment must fit constrained electrical rooms without weakening maintenance access or efficiency.
- USA demand is forecast to rise at 8.6% CAGR through 2036 reflecting a broad retrofit base and continued large-scale investment in high-density AI facilities. Large operators frequently add accelerator capacity to existing campuses as utility limits and installed protection schemes restrict electrical redesign during phased upgrades at older sites. EIA estimated in May 2026 that servers accounted for 7% of commercial-sector electricity consumption during 2025, reinforcing the scale of the electrical load. Existing service networks support deployment, but retrofit projects must prove that fast buffering does not disrupt fault recovery or black-start orchestration during generator restoration and transfer testing.
Who are the notable companies in the Megawatt AI Rack Transient Buffering Systems Market?
Skeleton Technologies, Piller Group GmbH, Eaton Corporation plc, Vertiv Holdings Co., Schneider Electric SE, Delta Electronics, Inc., ABB Ltd., and Flex Ltd. are the notable companies serving this market.
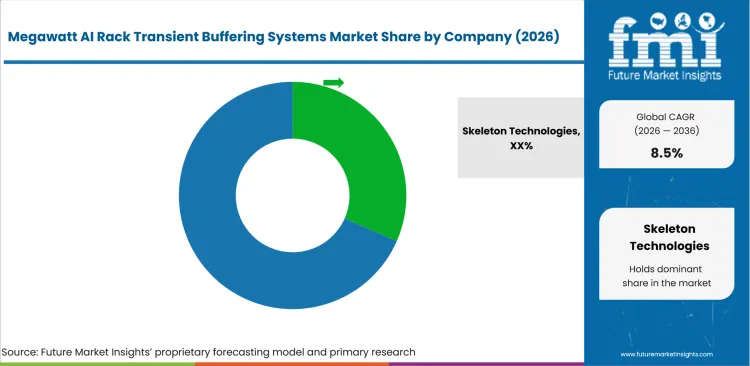
Skeleton Technologies and Piller Group GmbH compete with broader electrical groups that bring UPS and distribution into the same qualification package. New entrants need verified power-train interaction during qualification for electrical architects to accept an unfamiliar buffering design.
- Skeleton Technologies and Piller Group GmbH provide fast storage or kinetic stabilization for AI load changes.
- Eaton Corporation plc, Vertiv Holdings Co., Schneider Electric SE, Delta Electronics, Inc., and ABB Ltd. integrate UPS, DC distribution, protection or power quality.
- Flex Ltd. manufactures rack-level conversion and capacitive energy storage within its global AI infrastructure platform.
Competitive Benchmarking: Megawatt AI Rack Transient Buffering Systems Market
| Company | Fast-Cycle Buffering Depth | AI Rack - pod Power Integration | High-Voltage DC and Power-Quality Integration | Geographic Reach |
|---|---|---|---|---|
| Skeleton Technologies | High | High | High | Europe and North America |
| Piller Group GmbH | High | Medium | High | Europe and North America with global projects |
| Eaton Corporation plc | High | High | High | Global |
| Vertiv Holdings Co. | Medium | High | High | Global |
| Schneider Electric SE | High | High | High | Global |
| Delta Electronics, Inc. | Medium | High | High | Global |
| ABB Ltd. | Medium | High | High | Global |
| Flex Ltd. | High | High | Medium | Global manufacturing reach |
Scoring basis: Fast-cycle depth is High for purpose-built buffering, Medium for documented transient control and Low for adjacent UPS functions. Rack - pod integration is High for high-density architecture, Medium for facility integration and Low for adjacent equipment. High-voltage DC integration is High with stabilization or protection, Medium for one route and Low for conventional architecture. Geographic reach is descriptive and uses current official operating evidence for active regions and documented international projects.
Key Developments in the Megawatt AI Rack Transient Buffering Systems Market
- In June 2026, Skeleton Technologies launched GrapheneUPS for AI data centers with continuous power protection and active grid stabilization during voltage disturbances and restoration events.
- In November 2025, Piller Group GmbH disclosed SHIELDX dynamic power stabilization for a 400 MW USA AI data-center power project designed to manage rapid repetitive load changes.
- In October 2025, Eaton Corporation plc unveiled an 800 VDC reference architecture for NVIDIA AI infrastructure that includes supercapacitors alongside busbar and DC connector technologies.
Key Players in the Megawatt AI Rack Transient Buffering Systems Market
Fast-Response Storage and Stabilization
- Skeleton Technologies
- Piller Group GmbH
Integrated Data Center Power Architecture
- Eaton Corporation plc
- Vertiv Holdings Co.
- Schneider Electric SE
- Delta Electronics, Inc.
- ABB Ltd.
Rack Power and Infrastructure Manufacturing
- Flex Ltd.
Megawatt AI Rack Transient Buffering Systems Market - Report Scope
| Coverage field | Report scope |
|---|---|
| Market breakdown | By solution function, response time, rack - pod load, facility type, sales channel and region. |
| Quantitative Units | USD Million. |
| Market Definition | Commercial hardware and integrated systems sold to buffer, condition, or record fast electrical events associated with high-density AI racks and pods. |
| Regions Covered | North America, Latin America, Europe, East Asia, South Asia and Pacific, and Middle East and Africa. |
| Countries Covered | Saudi Arabia, UAE, France, South Korea, USA, and 20+ countries included in the full report. |
| Key Companies Profiled | Skeleton Technologies, Piller Group GmbH, Eaton Corporation plc, Vertiv Holdings Co., Schneider Electric SE, Delta Electronics, Inc., ABB Ltd., and Flex Ltd. |
| Forecast Period | 2026 to 2036. |
| Approach | Primary and secondary research with market triangulation. |
Megawatt AI Rack Transient Buffering Systems Market - Research Methodology
| Method | Approach |
|---|---|
| Primary Research | FMI analysts gathered input from manufacturers, service providers, technology developers, distributors, end users, procurement teams, and subject-matter experts. Interviews examined purchasing decisions, product or service evaluation, adoption barriers, approval requirements, pricing considerations, and expectations for technical or commercial support. Respondents were also asked what evidence is required before a trial, pilot, or initial order develops into regular purchasing. |
| Desk Research | Desk research covered government statistics, regulatory publications, trade data, industry associations, technical literature, standards, company filings, product information, and official corporate announcements. Sources were reviewed for relevance, publication date, geographic coverage, and consistency with the defined market scope. Claims relating to performance, applications, approvals, capacity, investment, and commercial activity were retained only when supported by credible public evidence. |
| Market Sizing and Forecasting | The market model combined the baseline value with historical performance, segment structure, pricing and volume indicators, adoption levels, company participation, and country-level demand conditions. Forecast assumptions considered economic activity, investment trends, regulatory developments, technology adoption, purchasing cycles, supply availability, and barriers to wider market use. Segment and regional estimates were reconciled before the final market total was calculated. |
| Data Validation | Estimates were checked against multiple independent indicators, including public data, company activity, trade patterns, industry developments, and findings from primary interviews. Validation also tested whether products, services, applications, and company revenues fell within the defined market boundaries. Adjacent categories, unsupported claims, overlapping revenues, and activities without direct market relevance were excluded to reduce double counting and maintain consistency across segments and countries. |
Megawatt AI Rack Transient Buffering Systems Market by Segments
Megawatt AI Rack Transient Buffering Systems Market segmented by Solution Function:
- Transient buffering
- Harmonic mitigation
- Voltage ride-through
- Power-factor correction
- Event measurement / recording
Megawatt AI Rack Transient Buffering Systems Market segmented by Response Time:
- 1-10 ms
- Sub-millisecond
- 11-100 ms
- Above 100 ms
Megawatt AI Rack Transient Buffering Systems Market segmented by Rack - pod Load:
- 250-500 kW
- Below 250 kW
- 501-750 kW
- Above 750 kW
Megawatt AI Rack Transient Buffering Systems Market segmented by Facility Type:
- Hyperscale AI
- Colocation
- Enterprise data centers
- HPC / research
Megawatt AI Rack Transient Buffering Systems Market segmented by Sales Channel:
- OEM direct
- Electrical integrator / EPC
- Power-quality specialist
- Distributor / service partner
Megawatt AI Rack Transient Buffering Systems Market by Region:
- North America
- United States
- Canada
- Latin America
- Brazil
- Mexico
- Chile
- Rest of Latin America
- Western Europe
- Germany
- United Kingdom
- Italy
- Spain
- France
- Nordics
- Benelux
- Rest of Western Europe
- Eastern Europe
- Russia
- Poland
- Hungary
- Balkan and Baltic States
- Rest of Eastern Europe
- East Asia
- China
- Japan
- South Korea
- South Asia and Pacific
- India
- ASEAN
- Australia and New Zealand
- Rest of South Asia and Pacific
- Middle East and Africa
- Kingdom of Saudi Arabia
- Other GCC Countries
- Türkiye
- South Africa
- Other African Union Countries
- Rest of Middle East and Africa
Research Sources and Bibliography
- USA Department of Energy, Office of Electricity. (2026, May 28). Monitoring Oscillations from Large Data Centers.
- Ministère de l'Économie, des Finances et de la Souveraineté industrielle, énergétique et numérique. (2026, January 30). Rencontres des centres de données : la dynamique des projets d’infrastructures numériques se confirme.
- Skeleton Technologies. (2025, May 28). Skeleton's New Product Cuts AI Data Center Energy Use by 44% and Boosts Computing Power by 40%.
- Vertiv. (2025, December 3). Vertiv™ AI Load Simulator: Innovation for precise power validation.
- Schneider Electric. (2025, October 13). Schneider Electric Highlights Innovation in 800 VDC Power Systems in support of NVIDIA’s next generation GPUs.
- Piller Group GmbH. (2025, June 16). Piller Supports Finland’s AI Infrastructure Expansion with Critical Power Protection.
- Eaton. (2025, September 9). Eaton delivers edge-based innovation to help mitigate the impact of AI power bursting on both data centers and the grid.
- Schneider Electric. (2026, August 3). Schneider Electric releases pioneering study assessing arc flash risk in 800 VDC data centers aligning with world's leading hyperscalers.
- ABB. (2025, October 13). ABB to develop next-generation AI data centers with NVIDIA.
- Ministry of Communications and Information Technology, Saudi Arabia. (2026, April 28). Saudi Arabia Strengthens Its Global Position in Artificial Intelligence Through Data Center Growth and Accelerated Smart Manufacturing.
- Abu Dhabi Media Office. (2025, May 22). Global tech alliance launches 'Stargate UAE'.
- Élysée Palace. (2025, February 11). Business Day du Sommet pour l'action sur l'intelligence artificielle à Station F.
- Ministry of Science and ICT, Republic of Korea. (2025, February 20). Korea to Expand AI Computing Infrastructure to Strengthen National AI Capabilities and Achieve Global Leadership.
- USA Energy Information Administration. (2026, May 19). Data center server energy use grows across the commercial building stock.
- Flex. (2025, October 13). Flex announces new AI infrastructure platform to speed deployment by up to 30%.
- Delta Electronics, Inc. (2026, March 30). 2025 Annual Report.
- Skeleton Technologies. (2026, June 4). Skeleton launches GrapheneUPS, a high-density UPS designed for AI infrastructure.
- Piller Group GmbH. (2025, November 26). Bergen Engines secures 400MW Contract for US AI Data Center Power Plant.
- Eaton. (2025, October 13). Eaton unveils next-generation architecture to advance 800 VDC power infrastructure for AI factories.
- Skeleton Technologies. (2026, June 25). Skeleton Technologies Supercapacitor Sets Record for Highest Peak Current Certified by UL at 3,500 Amperes.
- Eaton. (2025, December 10). Eaton invests $50M+ in new Virginia facility to advance grid-to-chip AI data center solutions.
- Vertiv. (2025, October 13). From vision to readiness: Vertiv collaborates with NVIDIA to advance 800 VDC platform designs to power the next generation of AI factories.
- Schneider Electric. (2026, March 16). Schneider Electric teams with NVIDIA to develop validated blueprints to design, simulate, build, operate and maintain gigawatt-scale AI Factories.
- Delta Electronics, Inc. (2026, May 28). Delta Bolsters 800 VDC Architecture for Next-gen AI Factories with Cutting-Edge Power, Cooling and Microgrid Solutions.
- ABB. (2026, March 26). ABB and VoltaGrid extend collaboration on data center power infrastructure.
- Flex. (2026, March 16). Flex Launches 800 VDC Power Rack for Next-Generation NVIDIA AI Infrastructure.
- Piller Group GmbH. (2026, May 8). Bergen Engines Secures 500MW+ of Orders from Liberty Energy to Advance Power Services for AI Data Centers.
This bibliography is provided for reader reference and is not exhaustive. The full report contains the complete reference list and detailed citations
This Report Answers
- How large is the megawatt AI rack transient buffering systems market in 2026 and 2036?
- Which electrical conditions increase demand for rapid AI rack buffering?
- Why does transient buffering lead solution function demand in 2026?
- How does the 1-10 ms response band shape system selection?
- Why does 250-500 kW lead rack - pod load demand?
- How do growth conditions differ among the five profiled countries?
- Which companies supply buffering, stabilization and integrated AI power architecture?
- Which qualification issues limit commercial adoption?
Frequently Asked Questions
How big is the Megawatt AI Rack Transient Buffering Systems Market in 2026?
The megawatt AI rack transient buffering systems market is valued at USD 475.8 million in 2026 and is projected to reach USD 1,075.7 million by 2036. Synchronized accelerator power excursions increase demand for fast local buffers that protect slower upstream equipment during workload changes.
What is the CAGR of the Megawatt AI Rack Transient Buffering Systems Market from 2026 to 2036?
The megawatt AI rack transient buffering systems market is projected to grow at a CAGR of 8.5% between 2026 and 2036. Expansion follows higher rack density and repeated GPU load changes that stress upstream electrical equipment.
Which solution function leads the Megawatt AI Rack Transient Buffering Systems Market?
The transient buffering segment is expected to hold 25.0% of the megawatt AI rack transient buffering systems market in 2026, driven by direct control of workload-driven power excursions. Its short response path limits electrical stress passed to slower upstream equipment during synchronized accelerator workload changes.
Which rack - pod load segment leads the Megawatt AI Rack Transient Buffering Systems Market?
The 250-500 kW segment is expected to hold 34.0% of the megawatt AI rack transient buffering systems market in 2026, attributable to the transition from high-density racks toward megawatt designs. Electrical teams use this band to avoid redesign while retaining room for higher-voltage architecture.
Which companies are active in the Megawatt AI Rack Transient Buffering Systems Market?
The megawatt AI rack transient buffering systems market includes Skeleton Technologies, Piller Group GmbH, Eaton Corporation plc, Vertiv Holdings Co., Schneider Electric SE, Delta Electronics, Inc., ABB Ltd., and Flex Ltd. Their positions span fast storage, UPS design, high-voltage distribution and facility stabilization.
Preview the report firsthand - request a free sample
Get SampleGet the brochure for pricing and purchase details.
Get PDFTable of Content
- Key Takeaways
- Market Size and CAGR
- Top Growth Driver
- Fastest Growing Segment
- Leading Region
- Key Companies
- Emerging Opportunities
- Executive Summary
- Global Market Outlook
- Demand-side Trends
- Supply-side Trends
- Technology Roadmap Analysis
- Analysis and Recommendations
- Analyst Perspective (What is happening? Why now? What should investors know?)
- Key Questions Answered
- How large is the market?
- What is the CAGR?
- What are key trends?
- Which region dominates?
- Who are the leaders?
- Market Overview
- Market Coverage / Taxonomy
- Market Definition / Scope / Limitations
- Research Methodology
- Chapter Orientation
- Analytical Lens and Working Hypotheses
- Market Structure, Signals, and Trend Drivers
- Benchmarking and Cross-market Comparability
- Market Sizing, Forecasting, and Opportunity Mapping
- Research Design and Evidence Framework
- Desk Research Programme (Secondary Evidence)
- Expert Input and Fieldwork (Primary Evidence)
- Tooling, Models, and Reference Databases
- Data Engineering and Model Build
- Quality Assurance and Audit Trail
- Market Background
- Market Dynamics (Drivers, Restraints, Opportunity, Trends)
- Scenario Forecast (Optimistic, Likely, Conservative)
- Impact Analysis
- AI Impact
- Sustainability Impact
- Regulatory Impact
- Technology Impact
- Consumer / Buyer Analysis
- Purchase Drivers
- Adoption Barriers
- Buyer Journey
- Opportunity Map Analysis
- Product Life Cycle Analysis
- Supply Chain Analysis
- Investment Feasibility Matrix
- Value Chain Analysis
- PESTLE and Porter's Analysis
- Regulatory Landscape
- Regional Parent Market Outlook
- Production and Consumption Statistics
- Import and Export Statistics
- Global Market Analysis and Forecast, 2021 to 2036
- Historical Market Size Value (USD Million) Analysis, 2021 to 2025
- Current and Future Market Size Value (USD Million) Projections, 2026 to 2036
- Y-o-Y Growth Trend Analysis
- Absolute $ Opportunity Analysis
- Global Market Pricing Analysis, 2021 to 2036
- Global Market Analysis and Forecast, By Solution Function, 2021 to 2036
- Introduction / Key Findings
- Historical Market Size Value (USD Million) Analysis By Solution Function, 2021 to 2025
- Current and Future Market Size Value (USD Million) Analysis and Forecast By Solution Function, 2026 to 2036
- Transient buffering
- Harmonic mitigation
- Voltage ride-through
- Power-factor correction
- Event measurement / recording
- Transient buffering
- Y-o-Y Growth Trend Analysis By Solution Function, 2021 to 2025
- Absolute $ Opportunity Analysis By Solution Function, 2026 to 2036
- Global Market Analysis and Forecast, By Response Time, 2021 to 2036
- Introduction / Key Findings
- Historical Market Size Value (USD Million) Analysis By Response Time, 2021 to 2025
- Current and Future Market Size Value (USD Million) Analysis and Forecast By Response Time, 2026 to 2036
- 1-10 ms
- Sub-millisecond
- 11-100 ms
- Above 100 ms
- 1-10 ms
- Y-o-Y Growth Trend Analysis By Response Time, 2021 to 2025
- Absolute $ Opportunity Analysis By Response Time, 2026 to 2036
- Global Market Analysis and Forecast, By Rack / Pod Load, 2021 to 2036
- Introduction / Key Findings
- Historical Market Size Value (USD Million) Analysis By Rack / Pod Load, 2021 to 2025
- Current and Future Market Size Value (USD Million) Analysis and Forecast By Rack / Pod Load, 2026 to 2036
- 250-500 kW
- Below 250 kW
- 501-750 kW
- Above 750 kW
- 250-500 kW
- Y-o-Y Growth Trend Analysis By Rack / Pod Load, 2021 to 2025
- Absolute $ Opportunity Analysis By Rack / Pod Load, 2026 to 2036
- Global Market Analysis and Forecast, By Facility Type, 2021 to 2036
- Introduction / Key Findings
- Historical Market Size Value (USD Million) Analysis By Facility Type, 2021 to 2025
- Current and Future Market Size Value (USD Million) Analysis and Forecast By Facility Type, 2026 to 2036
- Hyperscale AI
- Colocation
- Enterprise data centers
- HPC / research
- Hyperscale AI
- Y-o-Y Growth Trend Analysis By Facility Type, 2021 to 2025
- Absolute $ Opportunity Analysis By Facility Type, 2026 to 2036
- Global Market Analysis and Forecast, By Sales Channel, 2021 to 2036
- Introduction / Key Findings
- Historical Market Size Value (USD Million) Analysis By Sales Channel, 2021 to 2025
- Current and Future Market Size Value (USD Million) Analysis and Forecast By Sales Channel, 2026 to 2036
- OEM direct
- Electrical integrator / EPC
- Power-quality specialist
- Distributor / service partner
- OEM direct
- Y-o-Y Growth Trend Analysis By Sales Channel, 2021 to 2025
- Absolute $ Opportunity Analysis By Sales Channel, 2026 to 2036
- Global Market Analysis and Forecast, By Region, 2021 to 2036
- Introduction
- Historical Market Size Value (USD Million) Analysis By Region, 2021 to 2025
- Current Market Size Value (USD Million) Analysis and Forecast By Region, 2026 to 2036
- North America
- Latin America
- Western Europe
- Eastern Europe
- East Asia
- South Asia and Pacific
- Middle East & Africa
- Market Attractiveness Analysis By Region
- North America Market Analysis and Forecast, By Country, 2021 to 2036
- Historical Market Size Value (USD Million) Trend Analysis By Market Taxonomy, 2021 to 2025
- Market Size Value (USD Million) Forecast By Market Taxonomy, 2026 to 2036
- By Country
- USA
- Canada
- By Solution Function
- By Response Time
- By Rack / Pod Load
- By Facility Type
- By Sales Channel
- By Country
- Market Attractiveness Analysis
- By Country
- By Solution Function
- By Response Time
- By Rack / Pod Load
- By Facility Type
- By Sales Channel
- Key Takeaways
- Latin America Market Analysis and Forecast, By Country
- Historical Market Size Value (USD Million) Trend Analysis By Market Taxonomy, 2021 to 2025
- Market Size Value (USD Million) Forecast By Market Taxonomy, 2026 to 2036
- By Country
- Brazil
- Mexico
- Chile
- Rest of Latin America
- By Solution Function
- By Response Time
- By Rack / Pod Load
- By Facility Type
- By Sales Channel
- By Country
- Market Attractiveness Analysis
- By Country
- By Solution Function
- By Response Time
- By Rack / Pod Load
- By Facility Type
- By Sales Channel
- Key Takeaways
- Western Europe Market Analysis and Forecast, By Country
- Historical Market Size Value (USD Million) Trend Analysis By Market Taxonomy, 2021 to 2025
- Market Size Value (USD Million) Forecast By Market Taxonomy, 2026 to 2036
- By Country
- Germany
- UK
- Italy
- Spain
- France
- Nordic
- BENELUX
- Rest of Western Europe
- By Solution Function
- By Response Time
- By Rack / Pod Load
- By Facility Type
- By Sales Channel
- By Country
- Market Attractiveness Analysis
- By Country
- By Solution Function
- By Response Time
- By Rack / Pod Load
- By Facility Type
- By Sales Channel
- Key Takeaways
- Eastern Europe Market Analysis and Forecast, By Country
- Historical Market Size Value (USD Million) Trend Analysis By Market Taxonomy, 2021 to 2025
- Market Size Value (USD Million) Forecast By Market Taxonomy, 2026 to 2036
- By Country
- Russia
- Poland
- Hungary
- Balkan & Baltic
- Rest of Eastern Europe
- By Solution Function
- By Response Time
- By Rack / Pod Load
- By Facility Type
- By Sales Channel
- By Country
- Market Attractiveness Analysis
- By Country
- By Solution Function
- By Response Time
- By Rack / Pod Load
- By Facility Type
- By Sales Channel
- Key Takeaways
- East Asia Market Analysis and Forecast, By Country
- Historical Market Size Value (USD Million) Trend Analysis By Market Taxonomy, 2021 to 2025
- Market Size Value (USD Million) Forecast By Market Taxonomy, 2026 to 2036
- By Country
- China
- Japan
- South Korea
- By Solution Function
- By Response Time
- By Rack / Pod Load
- By Facility Type
- By Sales Channel
- By Country
- Market Attractiveness Analysis
- By Country
- By Solution Function
- By Response Time
- By Rack / Pod Load
- By Facility Type
- By Sales Channel
- Key Takeaways
- South Asia and Pacific Market Analysis and Forecast, By Country
- Historical Market Size Value (USD Million) Trend Analysis By Market Taxonomy, 2021 to 2025
- Market Size Value (USD Million) Forecast By Market Taxonomy, 2026 to 2036
- By Country
- India
- ASEAN
- Australia & New Zealand
- Rest of South Asia and Pacific
- By Solution Function
- By Response Time
- By Rack / Pod Load
- By Facility Type
- By Sales Channel
- By Country
- Market Attractiveness Analysis
- By Country
- By Solution Function
- By Response Time
- By Rack / Pod Load
- By Facility Type
- By Sales Channel
- Key Takeaways
- Middle East & Africa Market Analysis and Forecast, By Country
- Historical Market Size Value (USD Million) Trend Analysis By Market Taxonomy, 2021 to 2025
- Market Size Value (USD Million) Forecast By Market Taxonomy, 2026 to 2036
- By Country
- Kingdom of Saudi Arabia
- Other GCC Countries
- Türkiye
- South Africa
- Other African Union
- Rest of Middle East & Africa
- By Solution Function
- By Response Time
- By Rack / Pod Load
- By Facility Type
- By Sales Channel
- By Country
- Market Attractiveness Analysis
- By Country
- By Solution Function
- By Response Time
- By Rack / Pod Load
- By Facility Type
- By Sales Channel
- Key Takeaways
- Key Countries Market Analysis
- USA
- Pricing Analysis
- Market Share Analysis, 2025
- By Solution Function
- By Response Time
- By Rack / Pod Load
- By Facility Type
- By Sales Channel
- Canada
- Pricing Analysis
- Market Share Analysis, 2025
- By Solution Function
- By Response Time
- By Rack / Pod Load
- By Facility Type
- By Sales Channel
- Mexico
- Pricing Analysis
- Market Share Analysis, 2025
- By Solution Function
- By Response Time
- By Rack / Pod Load
- By Facility Type
- By Sales Channel
- Brazil
- Pricing Analysis
- Market Share Analysis, 2025
- By Solution Function
- By Response Time
- By Rack / Pod Load
- By Facility Type
- By Sales Channel
- Chile
- Pricing Analysis
- Market Share Analysis, 2025
- By Solution Function
- By Response Time
- By Rack / Pod Load
- By Facility Type
- By Sales Channel
- Germany
- Pricing Analysis
- Market Share Analysis, 2025
- By Solution Function
- By Response Time
- By Rack / Pod Load
- By Facility Type
- By Sales Channel
- UK
- Pricing Analysis
- Market Share Analysis, 2025
- By Solution Function
- By Response Time
- By Rack / Pod Load
- By Facility Type
- By Sales Channel
- Italy
- Pricing Analysis
- Market Share Analysis, 2025
- By Solution Function
- By Response Time
- By Rack / Pod Load
- By Facility Type
- By Sales Channel
- Spain
- Pricing Analysis
- Market Share Analysis, 2025
- By Solution Function
- By Response Time
- By Rack / Pod Load
- By Facility Type
- By Sales Channel
- France
- Pricing Analysis
- Market Share Analysis, 2025
- By Solution Function
- By Response Time
- By Rack / Pod Load
- By Facility Type
- By Sales Channel
- India
- Pricing Analysis
- Market Share Analysis, 2025
- By Solution Function
- By Response Time
- By Rack / Pod Load
- By Facility Type
- By Sales Channel
- ASEAN
- Pricing Analysis
- Market Share Analysis, 2025
- By Solution Function
- By Response Time
- By Rack / Pod Load
- By Facility Type
- By Sales Channel
- Australia & New Zealand
- Pricing Analysis
- Market Share Analysis, 2025
- By Solution Function
- By Response Time
- By Rack / Pod Load
- By Facility Type
- By Sales Channel
- China
- Pricing Analysis
- Market Share Analysis, 2025
- By Solution Function
- By Response Time
- By Rack / Pod Load
- By Facility Type
- By Sales Channel
- Japan
- Pricing Analysis
- Market Share Analysis, 2025
- By Solution Function
- By Response Time
- By Rack / Pod Load
- By Facility Type
- By Sales Channel
- South Korea
- Pricing Analysis
- Market Share Analysis, 2025
- By Solution Function
- By Response Time
- By Rack / Pod Load
- By Facility Type
- By Sales Channel
- Russia
- Pricing Analysis
- Market Share Analysis, 2025
- By Solution Function
- By Response Time
- By Rack / Pod Load
- By Facility Type
- By Sales Channel
- Poland
- Pricing Analysis
- Market Share Analysis, 2025
- By Solution Function
- By Response Time
- By Rack / Pod Load
- By Facility Type
- By Sales Channel
- Hungary
- Pricing Analysis
- Market Share Analysis, 2025
- By Solution Function
- By Response Time
- By Rack / Pod Load
- By Facility Type
- By Sales Channel
- Kingdom of Saudi Arabia
- Pricing Analysis
- Market Share Analysis, 2025
- By Solution Function
- By Response Time
- By Rack / Pod Load
- By Facility Type
- By Sales Channel
- Türkiye
- Pricing Analysis
- Market Share Analysis, 2025
- By Solution Function
- By Response Time
- By Rack / Pod Load
- By Facility Type
- By Sales Channel
- South Africa
- Pricing Analysis
- Market Share Analysis, 2025
- By Solution Function
- By Response Time
- By Rack / Pod Load
- By Facility Type
- By Sales Channel
- USA
- Market Structure Analysis
- Competition Dashboard
- Competition Benchmarking
- Market Share Analysis of Top Players
- By Regional
- By Solution Function
- By Response Time
- By Rack / Pod Load
- By Facility Type
- By Sales Channel
- Emerging Startups
- Innovation Benchmarking
- Competition Analysis
- Competition Deep Dive
- Skeleton Technologies
- Overview
- Product Portfolio
- Profitability by Market Segments
- Sales Footprint
- Strategy Overview
- Marketing Strategy
- Product Strategy
- Channel Strategy
- Eaton
- Skeleton Technologies
- Case Studies
- Success Stories
- Recent Developments
- Competition Deep Dive
- Assumptions & Acronyms Used


