Mixed Reality Surgery Market Size and Share Forecast Outlook 2025 to 2035

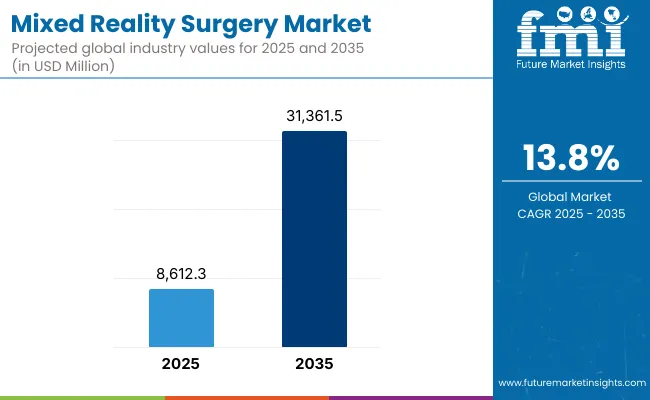
The mixed reality surgery has been forecasted to attain a valuation of USD 8,612.3 million in 2025, rising to USD 31,361.5 million by 2035, representing an incremental gain of USD 22,749.2 million and a total growth of approximately 27.5% over the forecast period. A compound annual growth rate (CAGR) of 13.8% is expected to be recorded, indicating a rapid expansion trajectory for the Mixed Reality Surgery Market.
Quick Stats for Mixed Reality Surgery Market

  •  Industry Value (2025): USD 8,612.3 million
  • Forecast Value (2035): USD 31361.5 million
  • Forecast CAGR: 13.8%
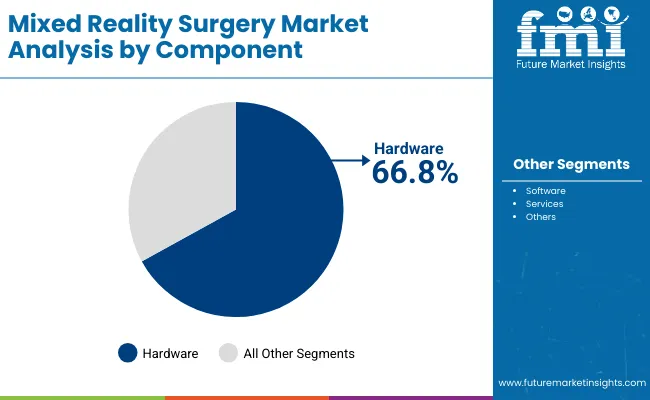
  • Leading Segment in 2025 (Component Type): Hardware - 66.8% share
  • Key Growth Regions: North America, Europe & Asia Pacific
  • Top Key Players: Zimmer Biomet, Brainlab SE, Augmedics, MEDIVIS, Surgical Theater, Inc., Proximie, SentiAR, Orthofix Medical Inc., Proprio, EchoPixel, Pixee, ApoQlar

Mixed Reality Surgery Market

Mixed Reality Surgery Market Key Takeaways

Metric Value
Mixed Reality Surgery Market Estimated Value in (2025E) USD 8,612.3 million
Mixed Reality Surgery Market Forecast Value in (2035F) USD 31,361.5 million
Forecast CAGR (2025 to 2035) 13.8%

Between 2025 and 2030, the Mixed Reality Surgery Market will gain broader adoption across hospitals, surgical centers, and medical universities, as surgeons and clinicians increasingly rely on immersive technologies for surgical planning, intraoperative guidance, and advanced training. Market value is projected to rise from USD 8,612.3 million in 2025 to USD 17178.5 million in 2030, reflecting accelerating demand for augmented and virtual reality solutions in operating rooms.

Growth is supported by improvements in headset design, integration of real-time imaging, and AI-driven simulation software, which make mixed reality tools more accessible to both large hospitals and mid-tier medical institutions. Broader applications in surgical interventions, coupled with heightened investment in digital health infrastructure, are anticipated to boost mixed reality adoption over the forecast period.

Between 2030 and 2035, the Mixed Reality Surgery Market is projected to expand further from grow from USD 17,178.5 million to USD  31,361.5 million, contributing USD  14183.0 million, which equals 62.3% of the total decade growth. This acceleration deepens across advanced hospitals, surgical training centers, and specialized clinics. Market value is expected to increase by USD 17,178.5 million over this period, advances in lightweight headsets, AI-powered visualization, and real-time surgical navigation will define the next generation of MR platforms, making them indispensable for precision surgery and immersive medical education.

From 2020 to 2024, the Mixed Reality Surgery Market advanced from early pilot deployments to wider adoption in leading hospitals and medical universities, growing from USD 4,886.0 million to USD 7,535.0 million. This phase was marked by the integration of mixed reality platforms into surgical training, preoperative planning, and simulation-based education. Healthcare technology providers have collaborated with medical institutions to enhance headset ergonomics, optimize real-time visualization, and refine system functionality, paving the way for wider clinical adoption.

Going forward, the global mixed reality surgery ecosystem will integrate AI-driven surgical guidance, real-time 3D visualization, and interoperability with robotic and imaging systems. These innovations will lower adoption barriers, expand applications across complex procedures, and improve surgical precision positioning mixed reality as a core technology in operating rooms, surgical training, and immersive medical education.

Why the Mixed Reality Surgery Market is growing?

The growth of the Mixed Reality Surgery Market is reinforced by its ability to transform surgical workflows through immersive visualization, simulation, and real-time guidance. Unlike conventional imaging or training methods, mixed reality enables precise anatomical mapping, enhanced intraoperative navigation, and simulation-based surgical education making it an essential technology for advancing complex procedures and improving patient outcomes.

Over the last decade, the scope of mixed reality in surgery has expanded beyond early training demonstrations. It is now a critical tool in preoperative planning, intraoperative visualization, and immersive surgical education. Mixed reality enables surgeons to interact with 3D anatomical models, align imaging data with patient anatomy, and simulate complex procedures with high accuracy. With rising demand for accuracy in surgical interventions, mixed reality is increasingly adopted as a critical technology in leading hospitals, specialty surgical centers, and academic medical institutions.

Another factor driving adoption is the shift from pilot-stage deployments to fully integrated mixed reality surgical platforms. With vendors now offering turnkey solutions that combine head-mounted displays, real-time imaging overlays, haptic feedback, and AI-driven guidance systems, surgeons can achieve advanced visualization and precision directly in the operating room. This decentralization is transforming accessibility, particularly in healthcare systems expanding their digital infrastructure and surgical innovation capacity.

Moreover, increasing demand from interdisciplinary fields including robotic-assisted surgery, AI-driven diagnostics, and surgical navigation systems is fostering the development of hybrid mixed reality platforms that combine visualization, real-time data integration, and tactile simulation.

Segmental Analysis

The market is segmented by product, application, technology, end user, sales channel, and region. Component include software, hardware, and services. Technology type classification covers Augmented Reality (AR), Virtual Reality (VR). Based on end user, the segmentation includes hospitals, research organizations, ambulatory surgical centers, specialty clinics and others. Regionally, the scope spans North America, Latin America, Western and Eastern Europe, East Asia, South Asia and Pacific, and the Middle East and Africa.
Insights into the Component Segment with Hardware Leading the Demand

Mixed Reality Surgery Market By Component

By Component Market Value Share, 2025
Software 22.0%
Hardware 66.8%
Services 11.2%

Hardware is projected to lead the component category with a 66.8% market share in 2025, and is expected to maintain this position due to its ability to deliver immersive visualization and high surgical precision in compact, clinically adaptable systems. Unlike Software, hardware provides real-time 3D overlays and interactive feedback, enabling surgeons to navigate complex procedures with unprecedented accuracy. This technological edge firmly positions hardware as the backbone of adoption across hospitals, ambulatory surgical centers, and specialty clinics.

Recent advances in head-mounted displays, AI-enhanced imaging overlays, and haptic simulation platforms, combined with innovations in surgical navigation and cloud-based integration, have enabled MR (Mixed Reality) surgery systems to operate near the theoretical limits of surgical precision. Moreover, integration with robotic-assisted platforms and intraoperative imaging modalities allows surgeons to perform highly complex procedures such as neurosurgery, orthopedic reconstruction, and cardiovascular interventions making hardware indispensable for frontier surgical applications.

A key factor behind its dominance is the growing presence of MR (Mixed Reality) surgery systems hardware in hospitals, ambulatory surgical centers, and medical universities. With commercial vendors now offering turnkey solutions that require minimal calibration, hardware platforms are becoming more accessible to a wider range of healthcare institutions. Their relatively lower infrastructure requirements compared to traditional robotic surgery suites further position them as the go-to component for digital surgery, minimally invasive procedures, and immersive medical training.

As demand for personalized medicine, advanced surgical training, and minimally invasive procedures continues to rise, the ease of deployment and outcome-enhancing capabilities of MR (Mixed Reality) surgery systems ensure that it remains the backbone of next-generation surgical ecosystems across clinical and academic settings worldwide.
Insights into the Technology Segment with Augmented Reality (AR) Dominating the Market

Mixed Reality Surgery Market By Technology

Technology Type Market Value Share, 2025
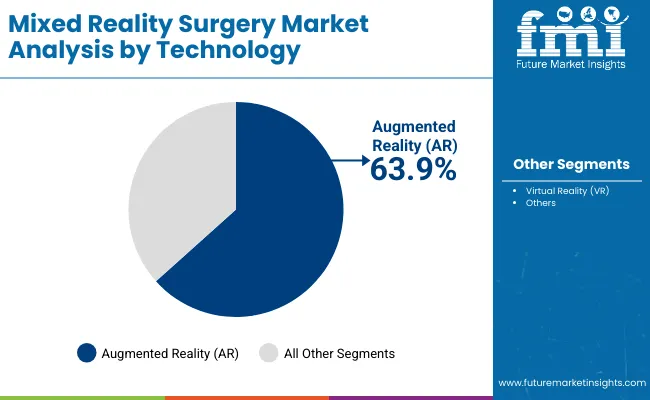
Augmented Reality (AR) 63.9%
Virtual Reality (VR) 36.1%

Augmented Reality (AR) continues to dominate the technology landscape in mixed reality (MR) surgery, accounting for 63.9% of total market value in 2025. This technology remains the foundation of next-generation surgical systems due to its proven ability to overlay critical anatomical information, provide real-time 3D guidance, and enhance intraoperative decision-making. As an essential tool across hospitals, ambulatory surgical centers, and medical training institutions, AR offers unmatched support for complex procedures, minimally invasive surgeries, and immersive surgical education.

What makes AR irreplaceable is its seamless integration with surgical workflows, mature software platforms, and advanced hardware ecosystems. Many hospitals and academic institutions have developed long-standing expertise using AR-enabled head-mounted displays, AI-enhanced visualization tools, and cloud-integrated surgical navigation systems. These platforms create a robust framework for precise surgical planning, rehearsal, and execution. AR technology is particularly effective in neurosurgery, orthopedic reconstruction, and cardiovascular interventions, where real-time overlays and interactive guidance significantly improve procedural accuracy.

Recent improvements in display resolution, tracking precision, and software algorithms have further enhanced the usability and adoption of AR, making systems increasingly practical for routine surgical use. Moreover, ongoing investment in training programs, academic curricula, and hospital implementation initiatives ensures a sustained pipeline of skilled users and continued market growth.

While Virtual Reality (VR) is gaining traction in niche applications such as fully immersive surgical simulation and remote collaboration, AR remains the mainstay of the global MR surgery market, largely due to its real-time applicability, versatility across procedures, and broad compatibility with diverse clinical settings.

What are the Drivers, Restraints, and Key Trends of the Mixed Reality Surgery Market?

The adoption of Mixed Reality (MR) surgery is accelerating across clinical, academic, and training environments as hardware, software, and AI capabilities converge to enhance surgical precision and procedural efficiency. While growth momentum is strong, the market faces structural challenges tied to cost, training requirements, and integration complexity.

Clinical Significance of MR Surgery Systems

MR systems are becoming essential in complex procedures such as neurosurgery, orthopedic reconstruction, and cardiovascular interventions. By overlaying real-time 3D anatomical visualizations onto the surgical field, MR provides surgeons with interactive guidance that conventional surgical tools cannot replicate. Hospitals, academic medical centers, and specialty clinics are increasingly adopting MR platforms to improve patient outcomes, reduce intraoperative errors, and enhance procedural confidence.

Shift Toward Compact, Integrated, and Accessible MR Systems

The MR market is expanding as manufacturers offer lab-ready solutions that are easier to deploy across hospitals and training centers. Modern MR platforms combine head-mounted displays, haptic feedback, AI-powered guidance, and cloud-based surgical navigation into compact, clinically adaptable systems. These innovations reduce infrastructure requirements compared with traditional robotic or simulation suites, enabling broader adoption in clinical and academic settings.

Adoption Challenges for MR Surgery Systems

MR surgery systems require significant investment in hardware, software, and personnel training, creating adoption barriers for smaller hospitals or centers with limited budgets. Integration into existing surgical workflows demands technical expertise, and staff must be trained to operate the systems effectively. Additionally, ensuring sterile environments, compatibility with imaging modalities, and regulatory compliance adds layers of complexity.
Analysis of Mixed Reality Surgery Market, By Key Countries

Mixed Reality Surgery Market By Country

Countries CAGR
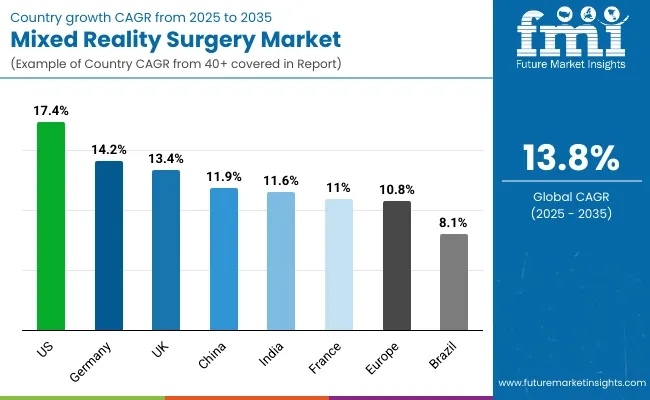
USA 17.4%
Brazil 8.1%
China 11.9%
India 11.6%
Europe 10.8%
Germany 14.2%
France 11.0%
UK 13.4%

The adoption and growth patterns of Mixed Reality (MR) surgery systems vary significantly across regions, influenced by healthcare infrastructure maturity, government support for advanced medical technologies, and specialized clinical application demand.

In the United States, the MR surgery market is characterized by rapid growth, driven by advanced hospitals, research universities, and medical technology companies investing in AR- and VR-enabled surgical systems. Widespread adoption is supported by access to cutting-edge imaging modalities, integration with robotic-assisted platforms, and early adoption of AI-enhanced surgical planning tools. Continuous investment in digital surgery, clinical training programs, and procedural innovation is propelling the market, with a projected CAGR of 17.4%.

In Europe, countries such as Germany, France, and the UK lead in MR surgery adoption due to strong governmental backing, robust healthcare infrastructure, and established medical research networks. Hospitals and specialty clinics are increasingly integrating MR platforms for neurosurgery, orthopedic reconstruction, and minimally invasive procedures. Regulatory support for advanced medical technologies, combined with national funding for digital surgery initiatives, enables widespread deployment, while ongoing training programs cultivate skilled personnel for MR-assisted procedures. The market is expected to expand at a CAGR of 14.2% in Germany, 11.0% in France, and 13.4% in the UK

In emerging markets such as China, India, and Brazil, growth is driven by improving healthcare infrastructure, rising adoption of advanced surgical technologies, and increasing investment in medical training and research. Hospitals in metropolitan centers are increasingly leveraging MR systems to enhance surgical outcomes and reduce procedural risks, with projected CAGRs of 11.9% in China, 11.6% in India, and 8.1% in Brazil.

Overall, the global MR surgery market reflects a strategic combination of technological advancement, healthcare investment, and policy support, which together shape the pace and scale of adoption across different countries. Regional infrastructure, clinician training, and integration into surgical workflows remain key determinants of market grow

Sales Outlook for Mixed Reality Surgery Market in the United States

The Mixed Reality (MR) surgery market in the United States is projected to expand at a CAGR of 17.4% between 2025 and 2035, reflecting rapid adoption across hospitals, surgical centers, and academic medical institutions. The USA remains the most mature and research-intensive market for MR-assisted surgery, with early integration into complex surgical programs, digital surgery initiatives, and medical training curricula. Leading institutions such as Johns Hopkins Hospital, Mayo Clinic, and Cleveland Clinic, alongside top medical universities and research centers, are setting benchmarks for MR applications. The USA also hosts several of the world’s most advanced surgical simulation and robotic-assisted surgery platforms, providing widespread access to MR-enabled systems.

  • Commercial interest from medical device companies and surgical startups is driving demand for MR systems in preoperative planning, intraoperative guidance, and post-operative training.
  • USA vendors are developing AI-integrated MR software platforms that provide real-time surgical guidance, workflow optimization, and automated performance feedback, reducing training time and enhancing usability.
  • Cross-disciplinary collaborations between hospitals, medical schools, and research institutes are fostering hybrid programs where MR technology is used alongside robotic-assisted surgery, advanced imaging, and AI-based decision support to improve procedural accuracy and patient outcomes.

Growth and Expansion Outlook for Mixed Reality Surgery Market in India

The adoption of Mixed Reality (MR) and immersive surgical technologies in India is gradually increasing, driven by growing interest in digital surgery, surgical training, and advanced procedural tools. While specific MR-assisted surgical platforms are not widely documented in Indian hospitals, leading institutions are exploring AR/VR technologies for surgical education and procedural simulation. Overall adoption remains limited, largely due to high setup costs, specialized training requirements, and reliance on both private and government funding.

  • Most deployments of digital surgery systems in India are grant- or investment-dependent, influenced by initiatives from the Ministry of Health & Family Welfare, private healthcare investors, and hospital capital expenditure programs.
  • Collaborations with international vendors and medical technology companies remain important, as domestic manufacturing of advanced MR or AR/VR surgical platforms is still limited.
  • Some hospitals and medical colleges are experimenting with modular AR/VR setups and simulation labs to provide cost-effective surgical training and enhance clinician exposure to immersive technologies.

Sales Outlook for Mixed Reality Surgery Market in China

Europe Countries 2025
Germany 23.5%
UK 18.9%
France 14.2%
Italy 13.5%
Spain 15.0%
BENELUX 6.9%
Nordic Countries 5.9%
Rest of Western Europe 2.1%
Europe Countries 2035
Germany 24.2%
UK 19.5%
France 14.6%
Italy 13.9%
Spain 15.5%
BENELUX 5.7%
Nordic Countries 4.9%
Rest of Western Europe 1.5%

China’s adoption of Mixed Reality (MR) in surgery is gradually expanding, supported by growing investment in digital healthcare, advanced surgical technologies, and training infrastructure. Institutions such as Peking Union Medical College Hospital, Shanghai Ruij in Hospital, and West China Hospital are at the forefront of integrating digital and immersive surgical solutions, including AR and VR, into training programs and advanced procedures. National and provincial healthcare initiatives are promoting the use of AR/VR technologies to enhance surgical education, procedural planning, and clinical outcomes.

  • Domestic companies are developing robotic-assisted and AR/VR-enabled surgical solutions for hospitals and teaching centers, emphasizing cost-effective deployment, intuitive interfaces, and enhanced guidance.
  • Hospitals are increasingly exploring multi-tool surgical setups, combining robotic surgery, advanced imaging, and AR/VR visualization to improve workflow and training capabilities.
  • Government co-funding programs in major cities such as Beijing, Shanghai, and Shenzhen are supporting the deployment of digital surgery technologies, extending adoption beyond metropolitan hospitals and academic centers.

Growth and Expansion Outlook for Mixed Reality Surgery Market in the United Kingdom

The Mixed Reality (MR) surgery market in the United Kingdom is projected to grow at a CAGR of 13.4% between 2025 and 2035, supported by strong public investment in digital healthcare, surgical innovation, and medical education. Institutions including Guy’s and St Thomas’ NHS Foundation Trust, University College London Hospitals, and Oxford University Hospitals are integrating MR-enabled platforms to complement robotic systems and AI-guided navigation. The country benefits from coordinated adoption programs, where MR-assisted surgery systems are deployed in teaching hospitals and clinical training centers nationwide.

In 2021 to 2025, the UK has seen increased deployment of hospital- and lab-based MR systems, often supported by National Health Service (NHS) funding and collaborative programs with technology vendors. These platforms are increasingly used alongside robotic-assisted surgery, advanced imaging modalities, and AI-driven surgical guidance, enabling more precise and immersive procedural workflows.

  • Cross-institutional training programs and clinician workshops are enhancing operator proficiency and reducing learning curves for MR-assisted procedures.
  • Government initiatives such as the NHS Digital Transformation Program are prioritizing capital investment in surgical technologies, including MR platforms, to modernize operating theaters and simulation centers.
  • MR-assisted surgery is also being explored in private hospital networks and specialty clinics, expanding adoption beyond public teaching hospitals and creating new clinical use cases for orthopedic, cardiovascular, and minimally invasive procedures.

In-depth Analysis of Mixed Reality Surgery Market in Germany

The Mixed Reality (MR) surgery market in Germany is anticipated to grow at a CAGR of 14.2% between 2025 and 2035. Germany is positioning itself as a key industrial and clinical hub for high-precision MR-assisted surgical applications, particularly in neurosurgery, orthopedic reconstruction, and minimally invasive cardiovascular procedures. While academic adoption remains strong, much of the current growth is driven by collaborations between leading hospitals, medical technology firms, and surgical training centers. German companies are playing a strategic role in developing MR subsystems including head-mounted displays, haptic feedback devices, and AI-assisted guidance software which are now being integrated into both domestic and international surgical platforms.
  • Instrumentation and technology firms in Germany are key suppliers of MR-critical components and export extensively to hospitals and medical institutions across Europe.
  • Applied clinical centers are using MR platforms to enhance preoperative planning, intraoperative navigation, and post-operative training, improving procedural accuracy and reducing surgical risks.
  • Government and research funding programs are supporting multi-institution initiatives that integrate MR-assisted surgery into broader surgical simulation, robotic-assisted procedures, and clinical training ecosystems.

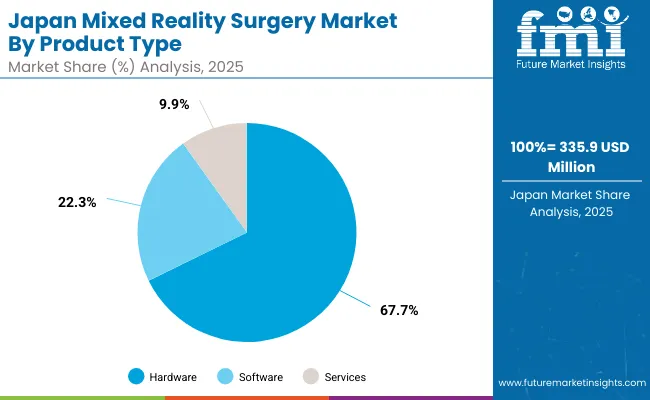
Growth Outlook for Mixed Reality Surgery Market in Japan

Mixed Reality Surgery Market Japan

Product Market Value Share, 2025
Software 22.3%
Hardware 67.7%
Services 9.9%

The Mixed Reality (MR) surgery market in Japan is projected to reach USD 335.9 million by 2025. Hardware will lead the product landscape with a 67.7% share, followed by software at 22.3%. Japan’s MR surgery market is shaped by a long-standing focus on surgical innovation, medical simulation, and minimally invasive procedures. The University of Tokyo Hospital, Osaka University Hospital, and Kyoto University Hospital, are integrating MR hardware and software platforms specialty procedures. Many institutions operate both standalone MR systems and fully integrated platforms, enabling a range of applications from preoperative planning to intraoperative guidance and surgical training.
  • Japan’s national healthcare and technology initiatives are increasing capital funding for high-end MR systems across hospitals and teaching centers.
  • AI- and haptic-enhanced MR solutions are gaining traction in Japanese medical centers, improving procedural precision and patient outcomes.
  • A strong culture of in-house system development allows hospitals and local vendors to customize MR platforms for specific surgical applications, though it can slow interoperability and standardization across commercial systems.

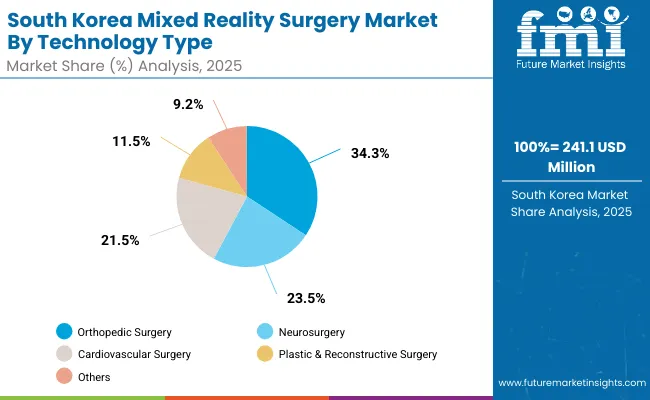
Opportunity Analysis of South Korea Mixed Reality Surgery Market

Mixed Reality Surgery Market South Korea

Technology Type Market Value Share, 2025
Orthopedic Surgery 34.3%
Neurosurgery 23.5%
Cardiovascular Surgery 21.5%
Plastic & Reconstructive Surgery 11.5%
Others 9.2%

The Mixed Reality (MR) surgery market in South Korea is projected to reach USD 241.1 million by 2025. Orthopedic surgery is expected to lead the technology type with a 34.3% share, followed by neurosurgery at 23.5%. South Korea’s MR surgery market is evolving from early adoption in academic hospitals toward broad clinical integration in specialized surgical centers. Adoption is extending beyond academic hospitals into specialized surgical centers, driven by government-backed modernization programs and investments in hybrid operating rooms.

Institutions such as Severance Hospital, Bundang Seoul National University Hospital, and Samsung Changwon Hospital are utilizing MR technology to improve intraoperative visualization and procedural accuracy. A key differentiator for South Korea is its rapid integration of MR with robotic-assisted surgery and AI-driven intraoperative guidance, enhancing precision and reducing procedural risks.
  • Major hospitals are piloting hybrid MR setups integrated with surgical robotics and imaging suites, enabling real-time visualization and interactive surgical planning.
  • Domestic medical device companies are partnering with universities and hospitals to develop customized MR platforms for orthopedic, neurosurgical, and cardiovascular applications.
  • Advanced digital infrastructure and high-speed networks allow integration of MR systems with remote consultation, training simulations, and multi-center surgical collaboration platforms.

Competitive Landscape of Mixed Reality Surgery Market

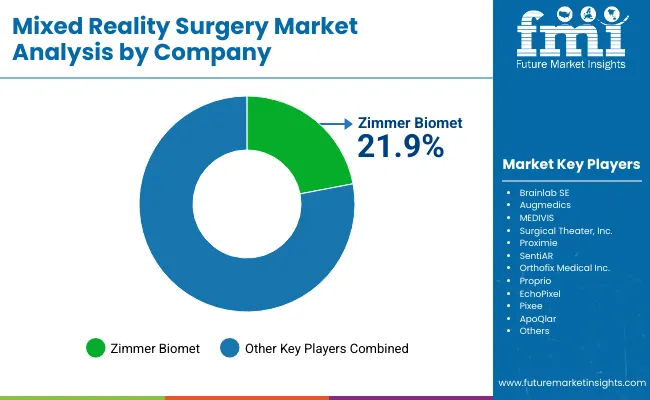
Mixed Reality Surgery Market By Company

The MR surgery market is moderately concentrated, with Zimmer Biomet holding a leading global position due to its specialization in orthopedic and neurosurgical MR-assisted platforms. The company’s dominance is driven by its integrated systems approach offering complete hardware, software, and simulation solutions with AI-enhanced guidance and intraoperative visualization. Zimmer Biomet also provides robust support for surgical training, preoperative planning, and robotic-assisted integrations, positioning itself as a go-to vendor for high-precision clinical applications.

The other key players, collectively accounting for 78.1% of the market, include Brainlab SE, Augmedics, MEDIVIS, Surgical Theater, Inc., Proximie, SentiAR, Orthofix Medical Inc., Proprio, EchoPixel, Pixee, and ApoQlar. The other key players are active across various MR-assisted applications, including orthopedic, neurosurgical, cardiovascular, and training-focused platforms. Together, they expand the competitive landscape and foster innovation in surgical visualization, intraoperative guidance, and immersive medical training.

Key Developments in Mixed Reality Surgery Market

  • In Sep 2025, Augmedics completed its 10,000th AR-guided spine surgery using the xvision Spine System®, performed at UConn Health by Dr. Isaac L. Moss. The milestone underscores the increasing adoption of AR navigation in spine surgery, enhancing precision, efficiency, and surgeon focus. Additionally, the company introduced the CT-Fluoro registration method, expanding access to AR-guided procedures and demonstrating the growing impact of mixed reality technologies in surgical workflows.
  • In Apr 2025, Medivis received FDA 510(k) clearance for its Spine Navigation platform, an AR- and AI-driven system that provides real-time, holographic visualization of patient anatomy for spine procedures. This technology enhances surgical precision in minimally invasive and open spine surgeries and contributes to the Mixed Reality Surgery Market.

Scope of the Report

Item Value
Quantitative Units USD 8612.3 million
Component Type Hardware, Software and services
Technology Type Augmented Reality (AR), Virtual Reality (VR)
End User Hospitals, Ambulatory Surgical Centers, Specialty Clinics, Research Organizations, Others
Regions Covered North America, Latin America, Western Europe, Eastern Europe, East Asia, South Asia & Pacific, Middle East & Africa
Countries Covered USA, Brazil, China, India, Europe, Germany, France and UK
Key Companies Profiled Zimmer Biomet, Brainlab SE, Augmedics, MEDIVIS, Surgical Theater, Inc., Proximie, SentiAR, Orthofix Medical Inc., Proprio, EchoPixel, Pixee, ApoQlar and others

Key Segments

By Component:

  • Software
  • Hardware
  • Services

By Technology:

  • Augmented Reality (AR)
  • Virtual Reality (VR)

By Application:

  • Orthopedic Surgery
  • Neurosurgery
  • Cardiovascular Surgery
  • Plastic & Reconstructive Surgery
  • Others

By End User:

  • Hospitals
  • Ambulatory Surgical Centers
  • Speciality Clinics
  • Research Organizations
  • Others

By Region:

  • North America
  • Latin America
  • Western Europe
  • Eastern Europe
  • East Asia
  • South Asia
  • MEA

Table of Content

  1. Executive Summary
    • Global Market Outlook
    • Demand-side Trends
    • Supply-side Trends
    • Technology Roadmap Analysis
    • Analysis and Recommendations
  2. Market Overview
    • Market Coverage / Taxonomy
    • Market Definition / Scope / Limitations
  3. Market Background
    • Market Dynamics
      • Drivers
      • Restraints
      • Opportunity
      • Trends
    • Scenario Forecast
      • Demand in Optimistic Scenario
      • Demand in Likely Scenario
      • Demand in Conservative Scenario
    • Opportunity Map Analysis
    • Product Life Cycle Analysis
    • Technological Advancement
    • Investment Feasibility Matrix
    • PESTLE and Porter’s Analysis
    • Regulatory Landscape
  4. By Key Regions
  5. By Key Countries
    • Regional Parent Market Outlook
  6. Recent Product Launches/Approvals
  7. Global Market Analysis 2020 to 2024 and Forecast, 2025 to 2035
    • Historical Market Size Value (USD Million) Analysis, 2020 to 2024
    • Current and Future Market Size Value (USD Million) Projections, 2025 to 2035
      • Y-o-Y Growth Trend Analysis
      • Absolute $ Opportunity Analysis
  8. Global Global Market Analysis 2020 to 2024 and Forecast 2025 to 2035, By Component
    • Introduction / Key Findings
    • Historical Market Size Value (USD Million) Analysis By Component, 2020 to 2024
    • Current and Future Market Size Value (USD Million) Analysis and Forecast By Component, 2025 to 2035
      • Software
      • Hardware
      • Services
    • Y-o-Y Growth Trend Analysis By Component, 2020 to 2024
    • Absolute $ Opportunity Analysis By Component, 2025 to 2035
  9. Global Global Market Analysis 2020 to 2024 and Forecast 2025 to 2035, By Technology
    • Introduction / Key Findings
    • Historical Market Size Value (USD Million) Analysis By Technology, 2020 to 2024
    • Current and Future Market Size Value (USD Million) Analysis and Forecast By Technology, 2025 to 2035
      • Augmented Reality (AR)
      • Virtual Reality (VR)
    • Y-o-Y Growth Trend Analysis By Technology, 2020 to 2024
    • Absolute $ Opportunity Analysis By Technology, 2025 to 2035
  10. Global Global Market Analysis 2020 to 2024 and Forecast 2025 to 2035, By Application
    • Introduction / Key Findings
    • Historical Market Size Value (USD Million) Analysis By Application, 2020 to 2024
    • Current and Future Market Size Value (USD Million) Analysis and Forecast By Application, 2025 to 2035
      • Orthopedic Surgery
      • Neurosurgery
      • Cardiovascular Surgery
      • Plastic & Reconstructive Surgery
      • Others
    • Y-o-Y Growth Trend Analysis By Application, 2020 to 2024
    • Absolute $ Opportunity Analysis By Application, 2025 to 2035
  11. Global Global Market Analysis 2020 to 2024 and Forecast 2025 to 2035, By End User
    • Introduction / Key Findings
    • Historical Market Size Value (USD Million) Analysis By End User, 2020 to 2024
    • Current and Future Market Size Value (USD Million) Analysis and Forecast By End User, 2025 to 2035
      • Hospitals
      • Ambulatory Surgical Centers
      • Speciality Clinics
      • Research Organizations
      • Others
    • Y-o-Y Growth Trend Analysis By End User, 2020 to 2024
    • Absolute $ Opportunity Analysis By End User, 2025 to 2035
  12. Global Global Market Analysis 2020 to 2024 and Forecast 2025 to 2035, By Region
    • Introduction
    • Historical Market Size Value (USD Million) Analysis By Region, 2020 to 2024
    • Current Market Size Value (USD Million) Analysis and Forecast By Region, 2025 to 2035
      • North America
      • Latin America
      • Western Europe
      • Eastern Europe
      • East Asia
      • South Asia
      • MEA
    • Market Attractiveness Analysis By Region
  13. North America Global Market Analysis 2020 to 2024 and Forecast 2025 to 2035, By Country
    • Historical Market Size Value (USD Million) Trend Analysis By Market Taxonomy, 2020 to 2024
    • Market Size Value (USD Million) Forecast By Market Taxonomy, 2025 to 2035
      • By Country
        • USA
        • Canada
        • Mexico
      • By Component
      • By Technology
      • By Application
      • By End User
    • Market Attractiveness Analysis
      • By Country
      • By Component
      • By Technology
      • By Application
      • By End User
    • Key Takeaways
  14. Latin America Global Market Analysis 2020 to 2024 and Forecast 2025 to 2035, By Country
    • Historical Market Size Value (USD Million) Trend Analysis By Market Taxonomy, 2020 to 2024
    • Market Size Value (USD Million) Forecast By Market Taxonomy, 2025 to 2035
      • By Country
        • Brazil
        • Argentina
        • Rest of Latin America
      • By Component
      • By Technology
      • By Application
      • By End User
    • Market Attractiveness Analysis
      • By Country
      • By Component
      • By Technology
      • By Application
      • By End User
    • Key Takeaways
  15. Western Europe Global Market Analysis 2020 to 2024 and Forecast 2025 to 2035, By Country
    • Historical Market Size Value (USD Million) Trend Analysis By Market Taxonomy, 2020 to 2024
    • Market Size Value (USD Million) Forecast By Market Taxonomy, 2025 to 2035
      • By Country
        • Germany
        • Italy
        • France
        • UK
        • Spain
        • BENELUX
        • Nordic Countries
        • Rest of Western Europe
      • By Component
      • By Technology
      • By Application
      • By End User
    • Market Attractiveness Analysis
      • By Country
      • By Component
      • By Technology
      • By Application
      • By End User
    • Key Takeaways
  16. Eastern Europe Global Market Analysis 2020 to 2024 and Forecast 2025 to 2035, By Country
    • Historical Market Size Value (USD Million) Trend Analysis By Market Taxonomy, 2020 to 2024
    • Market Size Value (USD Million) Forecast By Market Taxonomy, 2025 to 2035
      • By Country
        • Russia
        • Hungry
        • Poland
        • Rest of Eastern Europe
      • By Component
      • By Technology
      • By Application
      • By End User
    • Market Attractiveness Analysis
      • By Country
      • By Component
      • By Technology
      • By Application
      • By End User
    • Key Takeaways
  17. East Asia Global Market Analysis 2020 to 2024 and Forecast 2025 to 2035, By Country
    • Historical Market Size Value (USD Million) Trend Analysis By Market Taxonomy, 2020 to 2024
    • Market Size Value (USD Million) Forecast By Market Taxonomy, 2025 to 2035
      • By Country
        • China
        • Japan
        • South Korea
      • By Component
      • By Technology
      • By Application
      • By End User
    • Market Attractiveness Analysis
      • By Country
      • By Component
      • By Technology
      • By Application
      • By End User
    • Key Takeaways
  18. South Asia Global Market Analysis 2020 to 2024 and Forecast 2025 to 2035, By Country
    • Historical Market Size Value (USD Million) Trend Analysis By Market Taxonomy, 2020 to 2024
    • Market Size Value (USD Million) Forecast By Market Taxonomy, 2025 to 2035
      • By Country
        • India
        • ASEAN Countries
        • Australia & New Zealand
        • Rest of South Asia
      • By Component
      • By Technology
      • By Application
      • By End User
    • Market Attractiveness Analysis
      • By Country
      • By Component
      • By Technology
      • By Application
      • By End User
    • Key Takeaways
  19. MEA Global Market Analysis 2020 to 2024 and Forecast 2025 to 2035, By Country
    • Historical Market Size Value (USD Million) Trend Analysis By Market Taxonomy, 2020 to 2024
    • Market Size Value (USD Million) Forecast By Market Taxonomy, 2025 to 2035
      • By Country
        • Saudi Arabia
        • Türkiye
        • South Africa
        • Other African Union
        • Rest of MEA
      • By Component
      • By Technology
      • By Application
      • By End User
    • Market Attractiveness Analysis
      • By Country
      • By Component
      • By Technology
      • By Application
      • By End User
    • Key Takeaways
  20. Key Countries Global Market Analysis
    • USA
      • Pricing Analysis
      • Market Share Analysis, 2024
        • By Component
        • By Technology
        • By Application
        • By End User
    • Brazil
      • Pricing Analysis
      • Market Share Analysis, 2024
        • By Component
        • By Technology
        • By Application
        • By End User
    • China
      • Pricing Analysis
      • Market Share Analysis, 2024
        • By Component
        • By Technology
        • By Application
        • By End User
    • India
      • Pricing Analysis
      • Market Share Analysis, 2024
        • By Component
        • By Technology
        • By Application
        • By End User
    • Europe
      • Pricing Analysis
      • Market Share Analysis, 2024
        • By Component
        • By Technology
        • By Application
        • By End User
    • Germany
      • Pricing Analysis
      • Market Share Analysis, 2024
        • By Component
        • By Technology
        • By Application
        • By End User
    • France
      • Pricing Analysis
      • Market Share Analysis, 2024
        • By Component
        • By Technology
        • By Application
        • By End User
    • UK
      • Pricing Analysis
      • Market Share Analysis, 2024
        • By Component
        • By Technology
        • By Application
        • By End User
  21. Market Structure Analysis
    • Competition Dashboard
    • Competition Benchmarking
    • Market Share Analysis of Top Players
      • By Regional
      • By Component
      • By Technology
      • By Application
      • By End User
  22. Competition Analysis
    • Competition Deep Dive
      • Zimmer Biomet
        • Overview
        • Product Portfolio
        • Profitability by Market Segments (Product/Age /Sales Channel/Region)
        • Sales Footprint
        • Strategy Overview
          • Marketing Strategy
          • Product Strategy
          • Channel Strategy
      • Brainlab SE
        • Overview
        • Product Portfolio
        • Profitability by Market Segments (Product/Age /Sales Channel/Region)
        • Sales Footprint
        • Strategy Overview
          • Marketing Strategy
          • Product Strategy
          • Channel Strategy
      • Augmedics
        • Overview
        • Product Portfolio
        • Profitability by Market Segments (Product/Age /Sales Channel/Region)
        • Sales Footprint
        • Strategy Overview
          • Marketing Strategy
          • Product Strategy
          • Channel Strategy
      • MEDIVIS
        • Overview
        • Product Portfolio
        • Profitability by Market Segments (Product/Age /Sales Channel/Region)
        • Sales Footprint
        • Strategy Overview
          • Marketing Strategy
          • Product Strategy
          • Channel Strategy
      • Surgical Theater, Inc.
        • Overview
        • Product Portfolio
        • Profitability by Market Segments (Product/Age /Sales Channel/Region)
        • Sales Footprint
        • Strategy Overview
          • Marketing Strategy
          • Product Strategy
          • Channel Strategy
      • Proximie
        • Overview
        • Product Portfolio
        • Profitability by Market Segments (Product/Age /Sales Channel/Region)
        • Sales Footprint
        • Strategy Overview
          • Marketing Strategy
          • Product Strategy
          • Channel Strategy
      • SentiAR
        • Overview
        • Product Portfolio
        • Profitability by Market Segments (Product/Age /Sales Channel/Region)
        • Sales Footprint
        • Strategy Overview
          • Marketing Strategy
          • Product Strategy
          • Channel Strategy
      • Orthofix Medical Inc.
        • Overview
        • Product Portfolio
        • Profitability by Market Segments (Product/Age /Sales Channel/Region)
        • Sales Footprint
        • Strategy Overview
          • Marketing Strategy
          • Product Strategy
          • Channel Strategy
      • Proprio
        • Overview
        • Product Portfolio
        • Profitability by Market Segments (Product/Age /Sales Channel/Region)
        • Sales Footprint
        • Strategy Overview
          • Marketing Strategy
          • Product Strategy
          • Channel Strategy
      • EchoPixel
        • Overview
        • Product Portfolio
        • Profitability by Market Segments (Product/Age /Sales Channel/Region)
        • Sales Footprint
        • Strategy Overview
          • Marketing Strategy
          • Product Strategy
          • Channel Strategy
      • Pixee
        • Overview
        • Product Portfolio
        • Profitability by Market Segments (Product/Age /Sales Channel/Region)
        • Sales Footprint
        • Strategy Overview
          • Marketing Strategy
          • Product Strategy
          • Channel Strategy
      • ApoQlar
        • Overview
        • Product Portfolio
        • Profitability by Market Segments (Product/Age /Sales Channel/Region)
        • Sales Footprint
        • Strategy Overview
          • Marketing Strategy
          • Product Strategy
          • Channel Strategy
  23. Assumptions & Acronyms Used
  24. Research Methodology

List of Tables

  • Table 1: Global Market Value (USD Million) Forecast by Region, 2020-2035
  • Table 2: Global Market Value (USD Million) Forecast by Component, 2020-2035
  • Table 3: Global Market Value (USD Million) Forecast by Technology, 2020-2035
  • Table 4: Global Market Value (USD Million) Forecast by Application, 2020-2035
  • Table 5: Global Market Value (USD Million) Forecast by End User, 2020-2035
  • Table 6: North America Market Value (USD Million) Forecast by Country, 2020-2035
  • Table 7: North America Market Value (USD Million) Forecast by Component, 2020-2035
  • Table 8: North America Market Value (USD Million) Forecast by Technology, 2020-2035
  • Table 9: North America Market Value (USD Million) Forecast by Application, 2020-2035
  • Table 10: North America Market Value (USD Million) Forecast by End User, 2020-2035
  • Table 11: Latin America Market Value (USD Million) Forecast by Country, 2020-2035
  • Table 12: Latin America Market Value (USD Million) Forecast by Component, 2020-2035
  • Table 13: Latin America Market Value (USD Million) Forecast by Technology, 2020-2035
  • Table 14: Latin America Market Value (USD Million) Forecast by Application, 2020-2035
  • Table 15: Latin America Market Value (USD Million) Forecast by End User, 2020-2035
  • Table 16: Western Europe Market Value (USD Million) Forecast by Country, 2020-2035
  • Table 17: Western Europe Market Value (USD Million) Forecast by Component, 2020-2035
  • Table 18: Western Europe Market Value (USD Million) Forecast by Technology, 2020-2035
  • Table 19: Western Europe Market Value (USD Million) Forecast by Application, 2020-2035
  • Table 20: Western Europe Market Value (USD Million) Forecast by End User, 2020-2035
  • Table 21: Eastern Europe Market Value (USD Million) Forecast by Country, 2020-2035
  • Table 22: Eastern Europe Market Value (USD Million) Forecast by Component, 2020-2035
  • Table 23: Eastern Europe Market Value (USD Million) Forecast by Technology, 2020-2035
  • Table 24: Eastern Europe Market Value (USD Million) Forecast by Application, 2020-2035
  • Table 25: Eastern Europe Market Value (USD Million) Forecast by End User, 2020-2035
  • Table 26: East Asia Market Value (USD Million) Forecast by Country, 2020-2035
  • Table 27: East Asia Market Value (USD Million) Forecast by Component, 2020-2035
  • Table 28: East Asia Market Value (USD Million) Forecast by Technology, 2020-2035
  • Table 29: East Asia Market Value (USD Million) Forecast by Application, 2020-2035
  • Table 30: East Asia Market Value (USD Million) Forecast by End User, 2020-2035
  • Table 31: South Asia Market Value (USD Million) Forecast by Country, 2020-2035
  • Table 32: South Asia Market Value (USD Million) Forecast by Component, 2020-2035
  • Table 33: South Asia Market Value (USD Million) Forecast by Technology, 2020-2035
  • Table 34: South Asia Market Value (USD Million) Forecast by Application, 2020-2035
  • Table 35: South Asia Market Value (USD Million) Forecast by End User, 2020-2035
  • Table 36: MEA Market Value (USD Million) Forecast by Country, 2020-2035
  • Table 37: MEA Market Value (USD Million) Forecast by Component, 2020-2035
  • Table 38: MEA Market Value (USD Million) Forecast by Technology, 2020-2035
  • Table 39: MEA Market Value (USD Million) Forecast by Application, 2020-2035
  • Table 40: MEA Market Value (USD Million) Forecast by End User, 2020-2035

List of Figures

  • Figure 1: Global Market Value (USD Million) by Component, 2025-2035
  • Figure 2: Global Market Value (USD Million) by Technology, 2025-2035
  • Figure 3: Global Market Value (USD Million) by Application, 2025-2035
  • Figure 4: Global Market Value (USD Million) by End User, 2025-2035
  • Figure 5: Global Market Value (USD Million) by Region, 2025-2035
  • Figure 6: Global Market Value (USD Million) Analysis by Region, 2020-2035
  • Figure 7: Global Market Value Share (%) and BPS Analysis by Region, 2025-2035
  • Figure 8: Global Market Y-o-Y Growth (%) Projections by Region, 2025-2035
  • Figure 9: Global Market Value (USD Million) Analysis by Component, 2020-2035
  • Figure 10: Global Market Value Share (%) and BPS Analysis by Component, 2025-2035
  • Figure 11: Global Market Y-o-Y Growth (%) Projections by Component, 2025-2035
  • Figure 12: Global Market Value (USD Million) Analysis by Technology, 2020-2035
  • Figure 13: Global Market Value Share (%) and BPS Analysis by Technology, 2025-2035
  • Figure 14: Global Market Y-o-Y Growth (%) Projections by Technology, 2025-2035
  • Figure 15: Global Market Value (USD Million) Analysis by Application, 2020-2035
  • Figure 16: Global Market Value Share (%) and BPS Analysis by Application, 2025-2035
  • Figure 17: Global Market Y-o-Y Growth (%) Projections by Application, 2025-2035
  • Figure 18: Global Market Value (USD Million) Analysis by End User, 2020-2035
  • Figure 19: Global Market Value Share (%) and BPS Analysis by End User, 2025-2035
  • Figure 20: Global Market Y-o-Y Growth (%) Projections by End User, 2025-2035
  • Figure 21: Global Market Attractiveness by Component, 2025-2035
  • Figure 22: Global Market Attractiveness by Technology, 2025-2035
  • Figure 23: Global Market Attractiveness by Application, 2025-2035
  • Figure 24: Global Market Attractiveness by End User, 2025-2035
  • Figure 25: Global Market Attractiveness by Region, 2025-2035
  • Figure 26: North America Market Value (USD Million) by Component, 2025-2035
  • Figure 27: North America Market Value (USD Million) by Technology, 2025-2035
  • Figure 28: North America Market Value (USD Million) by Application, 2025-2035
  • Figure 29: North America Market Value (USD Million) by End User, 2025-2035
  • Figure 30: North America Market Value (USD Million) by Country, 2025-2035
  • Figure 31: North America Market Value (USD Million) Analysis by Country, 2020-2035
  • Figure 32: North America Market Value Share (%) and BPS Analysis by Country, 2025-2035
  • Figure 33: North America Market Y-o-Y Growth (%) Projections by Country, 2025-2035
  • Figure 34: North America Market Value (USD Million) Analysis by Component, 2020-2035
  • Figure 35: North America Market Value Share (%) and BPS Analysis by Component, 2025-2035
  • Figure 36: North America Market Y-o-Y Growth (%) Projections by Component, 2025-2035
  • Figure 37: North America Market Value (USD Million) Analysis by Technology, 2020-2035
  • Figure 38: North America Market Value Share (%) and BPS Analysis by Technology, 2025-2035
  • Figure 39: North America Market Y-o-Y Growth (%) Projections by Technology, 2025-2035
  • Figure 40: North America Market Value (USD Million) Analysis by Application, 2020-2035
  • Figure 41: North America Market Value Share (%) and BPS Analysis by Application, 2025-2035
  • Figure 42: North America Market Y-o-Y Growth (%) Projections by Application, 2025-2035
  • Figure 43: North America Market Value (USD Million) Analysis by End User, 2020-2035
  • Figure 44: North America Market Value Share (%) and BPS Analysis by End User, 2025-2035
  • Figure 45: North America Market Y-o-Y Growth (%) Projections by End User, 2025-2035
  • Figure 46: North America Market Attractiveness by Component, 2025-2035
  • Figure 47: North America Market Attractiveness by Technology, 2025-2035
  • Figure 48: North America Market Attractiveness by Application, 2025-2035
  • Figure 49: North America Market Attractiveness by End User, 2025-2035
  • Figure 50: North America Market Attractiveness by Country, 2025-2035
  • Figure 51: Latin America Market Value (USD Million) by Component, 2025-2035
  • Figure 52: Latin America Market Value (USD Million) by Technology, 2025-2035
  • Figure 53: Latin America Market Value (USD Million) by Application, 2025-2035
  • Figure 54: Latin America Market Value (USD Million) by End User, 2025-2035
  • Figure 55: Latin America Market Value (USD Million) by Country, 2025-2035
  • Figure 56: Latin America Market Value (USD Million) Analysis by Country, 2020-2035
  • Figure 57: Latin America Market Value Share (%) and BPS Analysis by Country, 2025-2035
  • Figure 58: Latin America Market Y-o-Y Growth (%) Projections by Country, 2025-2035
  • Figure 59: Latin America Market Value (USD Million) Analysis by Component, 2020-2035
  • Figure 60: Latin America Market Value Share (%) and BPS Analysis by Component, 2025-2035
  • Figure 61: Latin America Market Y-o-Y Growth (%) Projections by Component, 2025-2035
  • Figure 62: Latin America Market Value (USD Million) Analysis by Technology, 2020-2035
  • Figure 63: Latin America Market Value Share (%) and BPS Analysis by Technology, 2025-2035
  • Figure 64: Latin America Market Y-o-Y Growth (%) Projections by Technology, 2025-2035
  • Figure 65: Latin America Market Value (USD Million) Analysis by Application, 2020-2035
  • Figure 66: Latin America Market Value Share (%) and BPS Analysis by Application, 2025-2035
  • Figure 67: Latin America Market Y-o-Y Growth (%) Projections by Application, 2025-2035
  • Figure 68: Latin America Market Value (USD Million) Analysis by End User, 2020-2035
  • Figure 69: Latin America Market Value Share (%) and BPS Analysis by End User, 2025-2035
  • Figure 70: Latin America Market Y-o-Y Growth (%) Projections by End User, 2025-2035
  • Figure 71: Latin America Market Attractiveness by Component, 2025-2035
  • Figure 72: Latin America Market Attractiveness by Technology, 2025-2035
  • Figure 73: Latin America Market Attractiveness by Application, 2025-2035
  • Figure 74: Latin America Market Attractiveness by End User, 2025-2035
  • Figure 75: Latin America Market Attractiveness by Country, 2025-2035
  • Figure 76: Western Europe Market Value (USD Million) by Component, 2025-2035
  • Figure 77: Western Europe Market Value (USD Million) by Technology, 2025-2035
  • Figure 78: Western Europe Market Value (USD Million) by Application, 2025-2035
  • Figure 79: Western Europe Market Value (USD Million) by End User, 2025-2035
  • Figure 80: Western Europe Market Value (USD Million) by Country, 2025-2035
  • Figure 81: Western Europe Market Value (USD Million) Analysis by Country, 2020-2035
  • Figure 82: Western Europe Market Value Share (%) and BPS Analysis by Country, 2025-2035
  • Figure 83: Western Europe Market Y-o-Y Growth (%) Projections by Country, 2025-2035
  • Figure 84: Western Europe Market Value (USD Million) Analysis by Component, 2020-2035
  • Figure 85: Western Europe Market Value Share (%) and BPS Analysis by Component, 2025-2035
  • Figure 86: Western Europe Market Y-o-Y Growth (%) Projections by Component, 2025-2035
  • Figure 87: Western Europe Market Value (USD Million) Analysis by Technology, 2020-2035
  • Figure 88: Western Europe Market Value Share (%) and BPS Analysis by Technology, 2025-2035
  • Figure 89: Western Europe Market Y-o-Y Growth (%) Projections by Technology, 2025-2035
  • Figure 90: Western Europe Market Value (USD Million) Analysis by Application, 2020-2035
  • Figure 91: Western Europe Market Value Share (%) and BPS Analysis by Application, 2025-2035
  • Figure 92: Western Europe Market Y-o-Y Growth (%) Projections by Application, 2025-2035
  • Figure 93: Western Europe Market Value (USD Million) Analysis by End User, 2020-2035
  • Figure 94: Western Europe Market Value Share (%) and BPS Analysis by End User, 2025-2035
  • Figure 95: Western Europe Market Y-o-Y Growth (%) Projections by End User, 2025-2035
  • Figure 96: Western Europe Market Attractiveness by Component, 2025-2035
  • Figure 97: Western Europe Market Attractiveness by Technology, 2025-2035
  • Figure 98: Western Europe Market Attractiveness by Application, 2025-2035
  • Figure 99: Western Europe Market Attractiveness by End User, 2025-2035
  • Figure 100: Western Europe Market Attractiveness by Country, 2025-2035
  • Figure 101: Eastern Europe Market Value (USD Million) by Component, 2025-2035
  • Figure 102: Eastern Europe Market Value (USD Million) by Technology, 2025-2035
  • Figure 103: Eastern Europe Market Value (USD Million) by Application, 2025-2035
  • Figure 104: Eastern Europe Market Value (USD Million) by End User, 2025-2035
  • Figure 105: Eastern Europe Market Value (USD Million) by Country, 2025-2035
  • Figure 106: Eastern Europe Market Value (USD Million) Analysis by Country, 2020-2035
  • Figure 107: Eastern Europe Market Value Share (%) and BPS Analysis by Country, 2025-2035
  • Figure 108: Eastern Europe Market Y-o-Y Growth (%) Projections by Country, 2025-2035
  • Figure 109: Eastern Europe Market Value (USD Million) Analysis by Component, 2020-2035
  • Figure 110: Eastern Europe Market Value Share (%) and BPS Analysis by Component, 2025-2035
  • Figure 111: Eastern Europe Market Y-o-Y Growth (%) Projections by Component, 2025-2035
  • Figure 112: Eastern Europe Market Value (USD Million) Analysis by Technology, 2020-2035
  • Figure 113: Eastern Europe Market Value Share (%) and BPS Analysis by Technology, 2025-2035
  • Figure 114: Eastern Europe Market Y-o-Y Growth (%) Projections by Technology, 2025-2035
  • Figure 115: Eastern Europe Market Value (USD Million) Analysis by Application, 2020-2035
  • Figure 116: Eastern Europe Market Value Share (%) and BPS Analysis by Application, 2025-2035
  • Figure 117: Eastern Europe Market Y-o-Y Growth (%) Projections by Application, 2025-2035
  • Figure 118: Eastern Europe Market Value (USD Million) Analysis by End User, 2020-2035
  • Figure 119: Eastern Europe Market Value Share (%) and BPS Analysis by End User, 2025-2035
  • Figure 120: Eastern Europe Market Y-o-Y Growth (%) Projections by End User, 2025-2035
  • Figure 121: Eastern Europe Market Attractiveness by Component, 2025-2035
  • Figure 122: Eastern Europe Market Attractiveness by Technology, 2025-2035
  • Figure 123: Eastern Europe Market Attractiveness by Application, 2025-2035
  • Figure 124: Eastern Europe Market Attractiveness by End User, 2025-2035
  • Figure 125: Eastern Europe Market Attractiveness by Country, 2025-2035
  • Figure 126: East Asia Market Value (USD Million) by Component, 2025-2035
  • Figure 127: East Asia Market Value (USD Million) by Technology, 2025-2035
  • Figure 128: East Asia Market Value (USD Million) by Application, 2025-2035
  • Figure 129: East Asia Market Value (USD Million) by End User, 2025-2035
  • Figure 130: East Asia Market Value (USD Million) by Country, 2025-2035
  • Figure 131: East Asia Market Value (USD Million) Analysis by Country, 2020-2035
  • Figure 132: East Asia Market Value Share (%) and BPS Analysis by Country, 2025-2035
  • Figure 133: East Asia Market Y-o-Y Growth (%) Projections by Country, 2025-2035
  • Figure 134: East Asia Market Value (USD Million) Analysis by Component, 2020-2035
  • Figure 135: East Asia Market Value Share (%) and BPS Analysis by Component, 2025-2035
  • Figure 136: East Asia Market Y-o-Y Growth (%) Projections by Component, 2025-2035
  • Figure 137: East Asia Market Value (USD Million) Analysis by Technology, 2020-2035
  • Figure 138: East Asia Market Value Share (%) and BPS Analysis by Technology, 2025-2035
  • Figure 139: East Asia Market Y-o-Y Growth (%) Projections by Technology, 2025-2035
  • Figure 140: East Asia Market Value (USD Million) Analysis by Application, 2020-2035
  • Figure 141: East Asia Market Value Share (%) and BPS Analysis by Application, 2025-2035
  • Figure 142: East Asia Market Y-o-Y Growth (%) Projections by Application, 2025-2035
  • Figure 143: East Asia Market Value (USD Million) Analysis by End User, 2020-2035
  • Figure 144: East Asia Market Value Share (%) and BPS Analysis by End User, 2025-2035
  • Figure 145: East Asia Market Y-o-Y Growth (%) Projections by End User, 2025-2035
  • Figure 146: East Asia Market Attractiveness by Component, 2025-2035
  • Figure 147: East Asia Market Attractiveness by Technology, 2025-2035
  • Figure 148: East Asia Market Attractiveness by Application, 2025-2035
  • Figure 149: East Asia Market Attractiveness by End User, 2025-2035
  • Figure 150: East Asia Market Attractiveness by Country, 2025-2035
  • Figure 151: South Asia Market Value (USD Million) by Component, 2025-2035
  • Figure 152: South Asia Market Value (USD Million) by Technology, 2025-2035
  • Figure 153: South Asia Market Value (USD Million) by Application, 2025-2035
  • Figure 154: South Asia Market Value (USD Million) by End User, 2025-2035
  • Figure 155: South Asia Market Value (USD Million) by Country, 2025-2035
  • Figure 156: South Asia Market Value (USD Million) Analysis by Country, 2020-2035
  • Figure 157: South Asia Market Value Share (%) and BPS Analysis by Country, 2025-2035
  • Figure 158: South Asia Market Y-o-Y Growth (%) Projections by Country, 2025-2035
  • Figure 159: South Asia Market Value (USD Million) Analysis by Component, 2020-2035
  • Figure 160: South Asia Market Value Share (%) and BPS Analysis by Component, 2025-2035
  • Figure 161: South Asia Market Y-o-Y Growth (%) Projections by Component, 2025-2035
  • Figure 162: South Asia Market Value (USD Million) Analysis by Technology, 2020-2035
  • Figure 163: South Asia Market Value Share (%) and BPS Analysis by Technology, 2025-2035
  • Figure 164: South Asia Market Y-o-Y Growth (%) Projections by Technology, 2025-2035
  • Figure 165: South Asia Market Value (USD Million) Analysis by Application, 2020-2035
  • Figure 166: South Asia Market Value Share (%) and BPS Analysis by Application, 2025-2035
  • Figure 167: South Asia Market Y-o-Y Growth (%) Projections by Application, 2025-2035
  • Figure 168: South Asia Market Value (USD Million) Analysis by End User, 2020-2035
  • Figure 169: South Asia Market Value Share (%) and BPS Analysis by End User, 2025-2035
  • Figure 170: South Asia Market Y-o-Y Growth (%) Projections by End User, 2025-2035
  • Figure 171: South Asia Market Attractiveness by Component, 2025-2035
  • Figure 172: South Asia Market Attractiveness by Technology, 2025-2035
  • Figure 173: South Asia Market Attractiveness by Application, 2025-2035
  • Figure 174: South Asia Market Attractiveness by End User, 2025-2035
  • Figure 175: South Asia Market Attractiveness by Country, 2025-2035
  • Figure 176: MEA Market Value (USD Million) by Component, 2025-2035
  • Figure 177: MEA Market Value (USD Million) by Technology, 2025-2035
  • Figure 178: MEA Market Value (USD Million) by Application, 2025-2035
  • Figure 179: MEA Market Value (USD Million) by End User, 2025-2035
  • Figure 180: MEA Market Value (USD Million) by Country, 2025-2035
  • Figure 181: MEA Market Value (USD Million) Analysis by Country, 2020-2035
  • Figure 182: MEA Market Value Share (%) and BPS Analysis by Country, 2025-2035
  • Figure 183: MEA Market Y-o-Y Growth (%) Projections by Country, 2025-2035
  • Figure 184: MEA Market Value (USD Million) Analysis by Component, 2020-2035
  • Figure 185: MEA Market Value Share (%) and BPS Analysis by Component, 2025-2035
  • Figure 186: MEA Market Y-o-Y Growth (%) Projections by Component, 2025-2035
  • Figure 187: MEA Market Value (USD Million) Analysis by Technology, 2020-2035
  • Figure 188: MEA Market Value Share (%) and BPS Analysis by Technology, 2025-2035
  • Figure 189: MEA Market Y-o-Y Growth (%) Projections by Technology, 2025-2035
  • Figure 190: MEA Market Value (USD Million) Analysis by Application, 2020-2035
  • Figure 191: MEA Market Value Share (%) and BPS Analysis by Application, 2025-2035
  • Figure 192: MEA Market Y-o-Y Growth (%) Projections by Application, 2025-2035
  • Figure 193: MEA Market Value (USD Million) Analysis by End User, 2020-2035
  • Figure 194: MEA Market Value Share (%) and BPS Analysis by End User, 2025-2035
  • Figure 195: MEA Market Y-o-Y Growth (%) Projections by End User, 2025-2035
  • Figure 196: MEA Market Attractiveness by Component, 2025-2035
  • Figure 197: MEA Market Attractiveness by Technology, 2025-2035
  • Figure 198: MEA Market Attractiveness by Application, 2025-2035
  • Figure 199: MEA Market Attractiveness by End User, 2025-2035
  • Figure 200: MEA Market Attractiveness by Country, 2025-2035

Frequently Asked Questions

How big is the Mixed Reality Surgery Market in 2025?

The Mixed Reality Surgery Market is estimated to be valued at USD 8,612.3 million in 2025.

What will be the size of the Mixed Reality Surgery Market in 2035?

The market size for the Mixed Reality Surgery Market is projected to reach approximately USD 31,361.50 million by 2035.

How much will the Mixed Reality Surgery Market grow between 2025 and 2035?

The Mixed Reality Surgery Market is expected to grow at a CAGR of 13.8% between 2025 and 2035.

What are the key component in the Mixed Reality Surgery Market?

The key product formats in the Mixed Reality Surgery Market include Hardware, Software and services

Which technology type segment will contribute a significant share in Mixed Reality Surgery Market in 2025?

In terms of technology, Augmented Reality (AR) is projected to command the highest share at 63.9% in the Mixed Reality Surgery Market in 2025.

Explore Similar Insights

Future Market Insights

Mixed Reality Surgery Market

Chat With

MaRIA

Hi There, I am MaRIA, Your Market Research Intelligence Assistant. How may I help you?