The MPPT solar charge controllers for off-grid market increases from USD 200.4 million in 2025 to USD 444.9 million by 2035 at a CAGR of 8.3%, supported by expanding off-grid solar deployment across remote regions, rising battery-storage adoption, and wider availability of high-efficiency MPPT units suited for variable irradiance conditions. Segment structure plays a decisive role in shaping market momentum, with the 10A-50A category maintaining a dominant 50% share due to its suitability for small and mid-scale off-grid systems, including rural homes, telecommunication huts, micro-commercial setups, and agricultural power units. These controllers provide adequate solar-battery management for systems using 200–2,000 W solar arrays, making them the preferred choice in developing regions where decentralised electrification drives steady annual installations.
The 60A-100A category records faster growth as larger arrays power mini-grids, hybrid solar-battery systems, and commercial cabins. Demand is particularly strong in areas where off-grid loads expand to include refrigeration, water pumping, and multi-appliance use, requiring higher-capacity controllers with advanced MPPT algorithms and remote monitoring. Application segmentation is led by off-grid residential and remote-area power supply at 40%, reflecting strong adoption across rural communities in Asia Pacific, Latin America, and Africa. MPPT units in this segment ensure stable charging cycles for lead-acid, AGM, GEL, and increasingly lithium-ion batteries, which are now integrated into compact off-grid kits.
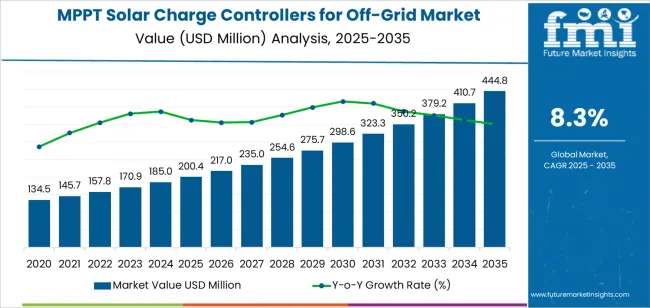
The increasing demand for off-grid solar power solutions in both developed and developing countries is contributing significantly to market growth. As more individuals, communities, and businesses in remote areas seek reliable, clean energy alternatives, the demand for off-grid solar systems equipped with MPPT controllers is expected to rise. The growing interest in sustainable energy solutions and energy independence, along with decreasing costs of solar equipment, is further driving the adoption of MPPT controllers in off-grid solar installations.
Between 2025 and 2030, the MPPT solar charge controllers for off-grid market is projected to grow from USD 200.4 million to approximately USD 290.6 million, adding USD 90.2 million, which accounts for about 36.9% of the total forecasted growth for the decade. This growth will be driven by the increasing demand for off-grid solar solutions in remote areas, the decreasing cost of solar technology, and growing energy independence trends.
From 2030 to 2035, the market is expected to expand from approximately USD 290.6 million to USD 444.9 million, adding USD 154.3 million, which constitutes about 63.1% of the overall growth. This phase will see widespread adoption of MPPT controllers in off-grid applications, further boosted by technological advancements, including enhanced battery management and improved efficiency of solar systems.
| Metric | Value |
|---|---|
| Market Value (2025) | USD 200.4 million |
| Market Forecast Value (2035) | USD 444.9 million |
| Forecast CAGR (2025 to 2035) | 8.3% |
The MPPT (Maximum Power Point Tracking) solar charge controller market for off-grid applications is growing due to the increasing demand for efficient and reliable renewable energy solutions, particularly in remote or off-grid locations. MPPT solar charge controllers optimize the power output from solar panels by continuously adjusting the load to ensure that the system operates at its highest efficiency. This makes them an essential component for off-grid solar power systems, which are widely used in rural areas, remote locations, and for emergency backup power.
The rise in global demand for off-grid solar power systems is driven by the growing need for ecologocal energy alternatives, especially in areas where access to the electrical grid is limited or unavailable. MPPT controllers are essential for maximizing the efficiency of off-grid solar systems, ensuring that solar energy is harvested and stored effectively, which is particularly crucial in areas with inconsistent sunlight or fluctuating weather conditions.
Advancements in solar technology, falling costs of solar panels, and the increasing adoption of renewable energy solutions are also contributing to market growth. In addition, governments and organizations are offering incentives and subsidies for off-grid renewable energy systems, which further support the adoption of MPPT solar charge controllers. While challenges such as installation complexity and cost remain, the overall demand for off-grid solar power solutions is expected to continue to drive the market's growth.
The market is segmented by type, application, and region. By type, the market is divided into 10A-50A and 60A-100A, with 10A-50A leading the market. Based on application, the market is categorized into off-grid residential and remote area power supply, RV and camper, solar street lights, communication base stations, and others, with off-grid residential and remote area power supply. Regionally, the market is divided into North America, Europe, Asia Pacific, and other key regions.
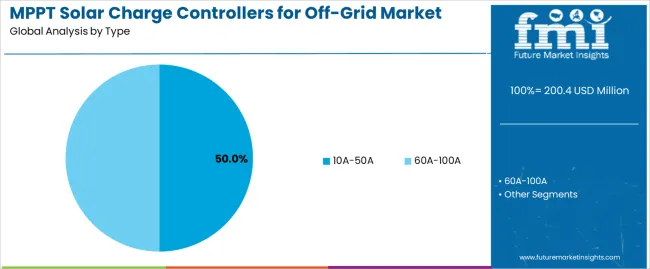
The 10A-50A segment leads the MPPT solar charge controllers for off-grid market, accounting for 50% of the total market share. This dominance is driven by the widespread use of charge controllers in off-grid solar systems with moderate power requirements. The 10A-50A range is particularly popular in off-grid residential setups, small-scale solar power installations, and remote power supply applications, as it offers sufficient power management capabilities for systems with lower energy consumption.
These controllers are also highly versatile, suitable for smaller solar arrays typically used in remote or rural areas where electricity supply is limited or unavailable. Their ability to optimize power conversion and battery charging efficiency in smaller systems has made them the preferred choice for consumers seeking affordable and efficient solar solutions. The widespread adoption of off-grid solar systems in residential and remote areas further reinforces the dominance of the 10A-50A MPPT solar charge controllers in the market.
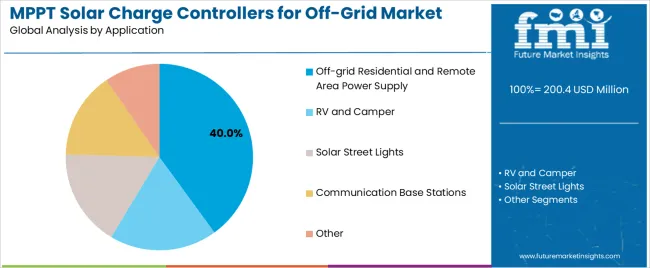
The off-grid residential and remote area power supply application dominates the MPPT solar charge controllers market, holding 40% of the total market share. This growth is driven by the increasing demand for reliable and cost-effective off-grid solar solutions, especially in remote areas that are not connected to the central power grid. Off-grid solar systems, powered by MPPT charge controllers, are crucial for providing electricity to households, small communities, and remote infrastructures, where grid connectivity is either unavailable or unreliable.
As the adoption of renewable energy sources increases, particularly in rural and developing areas, the demand for efficient, off-grid solar solutions is rising. MPPT charge controllers are essential in optimizing solar energy harvest and ensuring reliable battery charging in off-grid systems. This trend, combined with government incentives for renewable energy adoption, ensures that the off-grid residential and remote area power supply segment remains a key driver of growth in the MPPT solar charge controller market.
MPPT (Maximum Power Point Tracking) controllers deliver higher efficiency, better battery utilization, and are vital for unpredictable irradiance conditions. Key drivers include government subsidies for off‑grid renewables, the falling cost of PV modules, and growing demand in geographies with unreliable grid access. Restraints stem from higher initial cost of advanced MPPT models (versus simpler PWM types), complexity in system integration with batteries and inverters, and performance concerns in extreme environmental conditions.
Why are MPPT Solar Charge Controllers Gaining Popularity Across Computing Infrastructure?
MPPT solar charge controllers are gaining popularity because they optimize power extraction from solar panels under varying conditions and ensure efficient storage in battery banks critical in off‑grid systems where there is no backup grid. By tracking the solar panel’s optimum operating point, MPPT controllers can boost yield by 10‑30% over traditional PWM controllers, making them particularly valuable when solar resource is limited or battery cost is high. As remote installations (telecom towers, rural homes, mobile cabins) proliferate, reliability and efficient energy conversion become vital to minimize system downtime and maximize autonomy. This drives end‑users and integrators to prefer MPPT controllers despite higher cost.
How Are Technological Innovations Driving Growth in This Segment?
Technological innovations are driving growth in the MPPT solar charge controller segment by improving efficiency, intelligence, and integration capabilities. Advances include hardware‑assisted memory protection (such as memory encryption and isolation built into processors), improved memory integrity verification methods, and lightweight protection schemes tailored for embedded or resource‑constrained devices. Research‑driven solutions are addressing attack patterns like row‑hammer or access‑pattern leakage, enabling memory systems to defend against novel threats with minimal performance impact. Integration with AI/ML‑powered threat detection and trusted‑execution‑environment (TEE) memory protections allow dynamic, real‑time monitoring of memory integrity. These innovations expand the applicability of memory protection systems from high‑end servers to edge devices and help overcome earlier performance and cost barriers.
What are the Key Challenges Limiting the Adoption of MPPT Solar Charge Controllers in Off‑Grid Systems?
Despite the benefits, there are several key challenges limiting widespread adoption of MPPT solar charge controllers in off‑grid applications. One major barrier is the upfront cost-MPPT controllers are significantly more expensive than basic PWM models, which can deter smaller‑scale installers or cost‑sensitive markets. Integration complexity is another problem: matching PV voltage, battery chemistry, temperature compensation, and system wiring requires expertise; incorrect setup can degrade performance or shorten battery lifespan. Durability in remote, harsh environments (extreme heat, dust, moisture) also raises reliability concerns. Standardization issues and limited availability of local service/repair support in remote regions can discourage deployment.
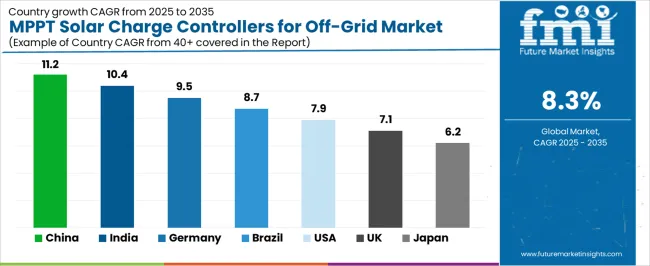
| Country | CAGR (%) |
|---|---|
| China | 11.2% |
| India | 10.4% |
| Germany | 9.5% |
| Brazil | 8.7% |
| USA | 7.9% |
| UK | 7.1% |
| Japan | 6.2% |
The MPPT solar charge controllers for off-grid market is expanding across key countries, with China leading at an 11.2% CAGR. This growth is driven by increasing demand for off-grid renewable energy solutions, especially in rural and remote areas. India follows at 10.4%, fueled by the country’s rapid adoption of solar energy and off-grid solutions to address power access issues. Germany is growing at 9.5%, supported by strong government incentives for renewable energy and energy-efficient technologies. Brazil shows an 8.7% CAGR, driven by the demand for solar solutions in off-grid areas. The USA, UK, and Japan experience steady growth at 7.9%, 7.1%, and 6.2%, respectively, as off-grid solar adoption continues to rise due to environmental concerns and the need for reliable energy solutions in remote locations.
China leads the MPPT solar charge controllers for off-grid market with an 11.2% CAGR. The country’s rapid urbanization and increasing reliance on renewable energy, particularly in rural and remote areas, are major drivers of this growth. With a focus on reducing carbon emissions and transitioning to cleaner energy sources, China is adopting off-grid solar solutions at a rapid pace. The government’s strong support for solar energy, including financial incentives and policies aimed at boosting the renewable energy sector, has further fueled demand for solar charge controllers.
The increasing availability of affordable solar technologies in China, combined with the growing need for decentralized energy solutions, has made MPPT solar charge controllers a popular choice for off-grid applications. These controllers are particularly valuable in regions with limited access to electricity, enabling rural communities to harness solar energy efficiently. As China continues to expand its solar energy infrastructure, the MPPT solar charge controller market is expected to maintain its strong growth trajectory.
India is experiencing strong growth in the MPPT solar charge controllers for off-grid market with a 10.4% CAGR. The demand for off-grid solar energy solutions in India is driven by the need to provide reliable and affordable power to remote and rural areas that are not connected to the central grid. The government’s push for renewable energy solutions, including initiatives to promote solar power in rural areas, has significantly contributed to this growth. As the cost of solar technology decreases and the availability of affordable solutions increases, more off-grid systems are being installed across the country.
India’s ambitious renewable energy targets and emphasis on achieving energy access for all are key factors driving the adoption of solar charge controllers in off-grid applications. These controllers help optimize solar energy generation and storage, ensuring that off-grid solar systems are both efficient and reliable. With an expanding solar energy market and growing investments in rural electrification, India’s MPPT solar charge controller market is set to continue growing at a strong pace.
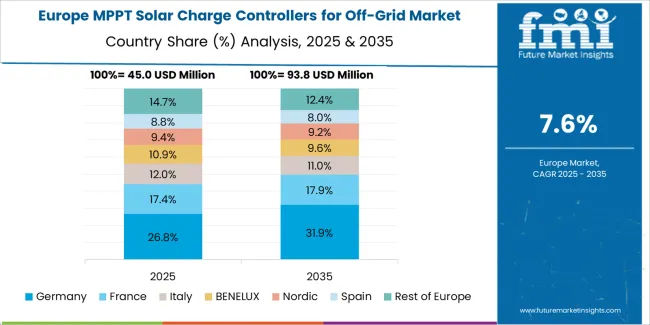
Germany is witnessing steady growth in the MPPT solar charge controllers for off-grid market with a 9.5% CAGR. The country’s strong commitment to renewable energy, driven by its Energiewende (energy transition) policy, is contributing to the growing adoption of solar energy systems, including off-grid applications. Germany is a global leader in solar energy technology, and the growing use of solar systems in remote areas is increasing the demand for MPPT solar charge controllers. These controllers are particularly important in off-grid applications, as they optimize solar panel efficiency and enhance system performance.
Germany’s high standard of living and strong support for energy-efficient technologies have encouraged the widespread adoption of off-grid solar solutions, particularly in areas where grid access is limited or unavailable. With increasing interest in reducing reliance on the grid and promoting self-sufficiency, the market for MPPT solar charge controllers in off-grid applications is expected to continue to grow. Germany’s leadership in renewable energy policies and innovation will likely keep the market expanding in the coming years.
Brazil is experiencing steady growth in the MPPT solar charge controllers for off-grid market, with an 8.7% CAGR. The country’s increasing focus on renewable energy and the demand for off-grid solar solutions, especially in rural and isolated areas, are major drivers of this growth. Brazil’s vast geographical size, with many remote regions lacking access to reliable electricity, has led to a rise in off-grid solar installations. MPPT solar charge controllers play a key role in optimizing energy storage and ensuring the efficient operation of these systems.
Brazil’s government has also made efforts to support the transition to renewable energy through various incentives, further encouraging the adoption of solar energy in off-grid applications. As solar technology becomes more affordable and accessible, more Brazilian households and communities are turning to solar power as a reliable source of energy. With continued investments in renewable energy infrastructure, the MPPT solar charge controller market in Brazil is poised for continued growth.
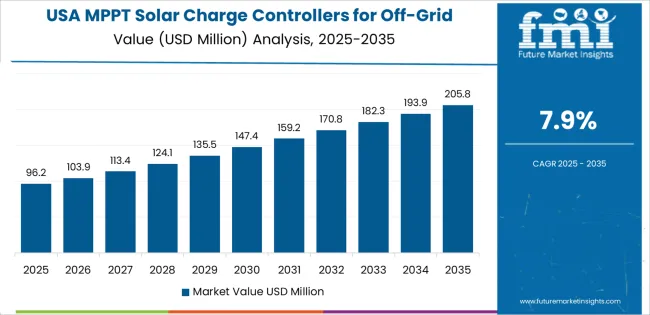
The USA is experiencing steady growth in the MPPT solar charge controllers for off-grid market, with a 7.9% CAGR. The increasing demand for off-grid solar systems, particularly in rural and remote areas, is driving the adoption of MPPT solar charge controllers. As the USA focuses more on sustainability and reducing carbon emissions, solar energy solutions, including off-grid applications, have become an attractive alternative to traditional power sources.
The growth of solar installations, particularly in areas that are not connected to the grid or are prone to power outages, is contributing to the rise in demand for solar charge controllers. MPPT solar charge controllers help optimize energy generation and storage, ensuring that solar systems are highly efficient and reliable. The USA’s emphasis on green technologies, along with the growing interest in self-sufficiency and reducing dependence on the grid, is expected to keep the market for off-grid solar solutions and charge controllers on an upward trajectory.
The UK is witnessing steady growth in the MPPT solar charge controllers for off-grid market with a 7.1% CAGR. The demand for off-grid solar systems is increasing as more consumers and businesses seek renewable energy solutions, especially in areas where grid access is limited or unreliable. The UK government’s initiatives to promote renewable energy, including solar power, are fueling the growth of off-grid solar systems. These systems, often using MPPT solar charge controllers, help optimize energy usage and increase the efficiency of solar installations.
As the UK continues to focus on reducing its carbon footprint and increasing renewable energy capacity, the demand for off-grid solar systems is expected to rise. The adoption of MPPT solar charge controllers, which ensure the efficient operation of solar systems by maximizing energy generation and storage, will continue to grow. With increased awareness of energy independence and sustainability, the UK’s off-grid solar market is poised for continued expansion.

Japan is experiencing moderate growth in the MPPT solar charge controllers for off-grid market with a 6.2% CAGR. The country’s focus on renewable energy, especially after the Fukushima disaster, has led to a significant rise in solar energy adoption. In remote and rural areas, off-grid solar solutions are becoming increasingly popular as a reliable source of power, and MPPT solar charge controllers are essential for ensuring that these systems operate efficiently.
Japan’s commitment to clean energy, coupled with government incentives and policies aimed at reducing dependence on fossil fuels, is contributing to the growth of the market. As solar technology becomes more accessible and affordable, the use of MPPT solar charge controllers in off-grid systems is expected to increase. Japan’s continued investment in solar energy infrastructure and its efforts to promote energy self-sufficiency will drive the growth of the MPPT solar charge controller market in the coming years.
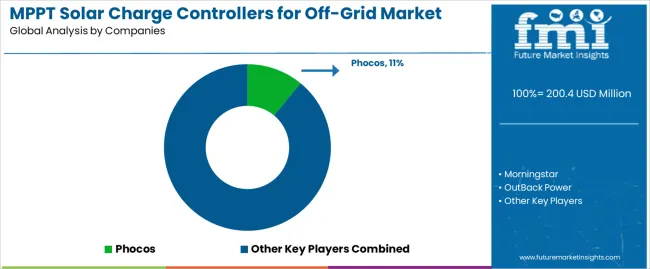
The MPPT solar charge controller market for off-grid applications is growing as the demand for efficient, reliable, and sustainable off-grid solar energy systems increases. Phocos leads the market with an 11% share, known for its advanced MPPT solar charge controllers that maximize energy harvest and improve system efficiency for off-grid solar installations. Phocos’s reputation for high-quality, durable products tailored for both residential and commercial off-grid applications positions it as a dominant player in the market.
Other significant players in the market include Morningstar, OutBack Power, and Victron Energy, each offering a range of MPPT controllers designed for off-grid solar systems. Morningstar is known for its high-performance solar charge controllers, focusing on reliable and efficient solutions for off-grid energy systems. OutBack Power offers innovative MPPT charge controllers with advanced monitoring and control features that enhance system performance. Victron Energy provides a variety of MPPT solar charge controllers, offering flexible and high-quality solutions for both off-grid and grid-tied solar systems.
Companies like Studer Innotec, Steca, and Renogy contribute to the market with cost-effective and reliable MPPT controllers. Studer Innotec is known for its robust and durable charge controllers, while Steca focuses on high-performance solar energy solutions with energy-efficient charge controllers. Renogy provides affordable and reliable MPPT controllers, catering to the growing off-grid solar market.
Other players such as Microcare, MidNite Solar, Powerwerx, and Schneider Electric also compete by offering specialized products with advanced features that optimize solar power usage and improve off-grid system efficiency. Companies like Furrion, AIMS Power, Xantrex, LIVOLTEK, Rich Solar, and Hanfsolar further enhance the competitive landscape by offering high-quality MPPT controllers and other solar energy solutions tailored to off-grid applications.
| Items | Values |
|---|---|
| Quantitative Units (2025) | USD million |
| Type | Single-Slider, Double-Slider, Others |
| Application | Residential, Commercial, Others |
| Regions Covered | Asia Pacific, Europe, North America, Latin America, Middle East & Africa |
| Countries Covered | China, Japan, South Korea, India, Australia & New Zealand, ASEAN, Rest of Asia Pacific, Germany, United Kingdom, France, Italy, Spain, Nordic, BENELUX, Rest of Europe, United States, Canada, Mexico, Brazil, Chile, Rest of Latin America, Kingdom of Saudi Arabia, Other GCC Countries, Turkey, South Africa, Other African Union, Rest of Middle East & Africa |
| Key Companies Profiled | MILGARD, Andersen Windows, Pella, YKK AP, JELD-WEN, ProVia, Stanek, Ply Gem, Simonton, Atrium, Paradigm Windows, MI Windows, Vinylmax, Champion Windows, OKNA Windows, Alside, Great Lakes Window, Rosati Windows |
| Additional Attributes | Dollar sales by type and application categories, market growth trends, market adoption by classification and application segments, regional adoption trends, competitive landscape, advancements in vinyl sliding window technologies, integration with residential and commercial construction projects. |
The global MPPT solar charge controllers for off-grid market is estimated to be valued at USD 200.4 million in 2025.
The market size for the MPPT solar charge controllers for off-grid market is projected to reach USD 444.8 million by 2035.
The MPPT solar charge controllers for off-grid market is expected to grow at a 8.3% CAGR between 2025 and 2035.
The key product types in MPPT solar charge controllers for off-grid market are 10a-50a and 60a-100a.
In terms of application, off-grid residential and remote area power supply segment to command 40.0% share in the MPPT solar charge controllers for off-grid market in 2025.


Our Research Products

The "Full Research Suite" delivers actionable market intel, deep dives on markets or technologies, so clients act faster, cut risk, and unlock growth.

The Leaderboard benchmarks and ranks top vendors, classifying them as Established Leaders, Leading Challengers, or Disruptors & Challengers.

Locates where complements amplify value and substitutes erode it, forecasting net impact by horizon

We deliver granular, decision-grade intel: market sizing, 5-year forecasts, pricing, adoption, usage, revenue, and operational KPIs—plus competitor tracking, regulation, and value chains—across 60 countries broadly.

Spot the shifts before they hit your P&L. We track inflection points, adoption curves, pricing moves, and ecosystem plays to show where demand is heading, why it is changing, and what to do next across high-growth markets and disruptive tech

Real-time reads of user behavior. We track shifting priorities, perceptions of today’s and next-gen services, and provider experience, then pace how fast tech moves from trial to adoption, blending buyer, consumer, and channel inputs with social signals (#WhySwitch, #UX).

Partner with our analyst team to build a custom report designed around your business priorities. From analysing market trends to assessing competitors or crafting bespoke datasets, we tailor insights to your needs.
Supplier Intelligence
Discovery & Profiling
Capacity & Footprint
Performance & Risk
Compliance & Governance
Commercial Readiness
Who Supplies Whom
Scorecards & Shortlists
Playbooks & Docs
Category Intelligence
Definition & Scope
Demand & Use Cases
Cost Drivers
Market Structure
Supply Chain Map
Trade & Policy
Operating Norms
Deliverables
Buyer Intelligence
Account Basics
Spend & Scope
Procurement Model
Vendor Requirements
Terms & Policies
Entry Strategy
Pain Points & Triggers
Outputs
Pricing Analysis
Benchmarks
Trends
Should-Cost
Indexation
Landed Cost
Commercial Terms
Deliverables
Brand Analysis
Positioning & Value Prop
Share & Presence
Customer Evidence
Go-to-Market
Digital & Reputation
Compliance & Trust
KPIs & Gaps
Outputs
Full Research Suite comprises of:
Market outlook & trends analysis
Interviews & case studies
Strategic recommendations
Vendor profiles & capabilities analysis
5-year forecasts
8 regions and 60+ country-level data splits
Market segment data splits
12 months of continuous data updates
DELIVERED AS:
PDF EXCEL ONLINE
Solar Module Recycling Service Market Size and Share Forecast Outlook 2025 to 2035
Solar Tracking Module Market Size and Share Forecast Outlook 2025 to 2035
Solar Analyzer Market Size and Share Forecast Outlook 2025 to 2035
Solar Aluminum Alloy Frame Market Size and Share Forecast Outlook 2025 to 2035
Solar Grade Monocrystalline Silicon Rods Market Analysis - Size, Share, and Forecast Outlook 2025 to 2035
Solar Vehicle Market Size and Share Forecast Outlook 2025 to 2035
Solar PV Module Market Size and Share Forecast Outlook 2025 to 2035
Solar Encapsulation Market Size and Share Forecast Outlook 2025 to 2035
Solar Pumps Market Analysis - Size, Share, and Forecast Outlook 2025 to 2035
Solar Mobile Light Tower Market Size and Share Forecast Outlook 2025 to 2035
Solar PV Recycling Market Size and Share Forecast Outlook 2025 to 2035
Solar Panel Market Size and Share Forecast Outlook 2025 to 2035
Solar-Powered Active Packaging Market Analysis - Size, Share, and Forecast Outlook 2025 to 2035
Solar Panel Recycling Management Market Size and Share Forecast Outlook 2025 to 2035
Solar Photovoltaic (PV) Market Size and Share Forecast Outlook 2025 to 2035
Solar EPC Market Size and Share Forecast Outlook 2025 to 2035
Solar-Powered UAV Market Size and Share Forecast Outlook 2025 to 2035
Solar Panel Cleaning Market Size and Share Forecast Outlook 2025 to 2035
Solar Salt Market Size and Share Forecast Outlook 2025 to 2035
Solar Control Window Films Market Size and Share Forecast Outlook 2025 to 2035

Thank you!
You will receive an email from our Business Development Manager. Please be sure to check your SPAM/JUNK folder too.
Chat With
MaRIA