Methodology

Mushroom Stems Market Forecast and Outlook 2025 to 2035

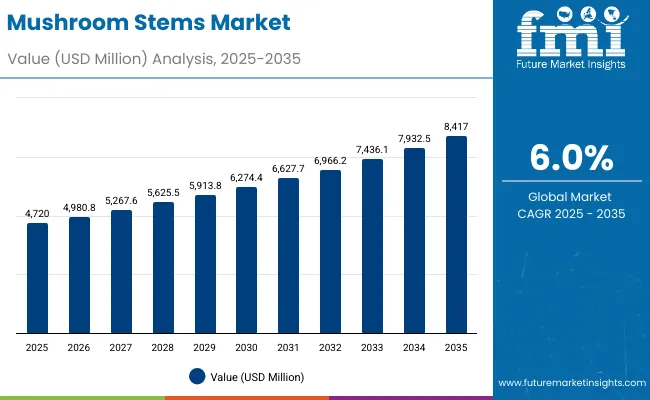
The mushroom stems market is valued at USD 4,720 million in 2025, and is set to reach USD 8,417 million by 2035 at a CAGR of 6%. China sits at the center of the mushroom-stem value chain, holding the overwhelming share of global volume yet capturing only a fraction of the potential value. The country produces the world’s largest pool of stems, but most of this biomass still flows into low-value channels despite extensive patent activity in dietary fibers, floss materials, and TCM-adjacent extracts.

Japan and South Korea, though smaller in volume, have played a disproportionate role in applied innovation. Their food-science institutions were early in demonstrating stem-derived functional ingredients and bio-composite films, and regional cosmetics brands have already commercialized reishi and snow-mushroom stem extracts in premium skincare categories an early indicator of how high-margin niches might evolve.

India represents a structurally different story: production is moderate, but the market offers one of the strongest demand frontiers for low-cost mushroom-stem valorization. Large poultry and livestock feed systems, a rising functional food sector, and a fragmented agri-processing base create room for stems to move from underutilized residue to affordable fiber and feed ingredients. Taken together, APAC remains the undisputed volume giant, but the region has yet to translate scale into margin. The opportunity lies in shifting from tonnes-driven agriculture to patent-backed, application-specific industries where stems become precursors to functional foods, biopolymers, and cosmeceuticals.
Quick Stats for Mushroom Stems Market

  • Mushroom Stems Market Value (2025): USD 4,720 million
  • Mushroom Stems Market Forecast Value (2035): USD 8,417 million
  • Mushroom Stems Market Forecast CAGR: 6%
  • Leading Source in Mushroom Stems Market: Button Mushroom Segment
  • Key Growth Regions in Mushroom Stems Market: Europe, South Asia & Pacific, and North America
  • Top Players in Mushroom Stems Market: Monaghan Mushrooms; South Mill Champs (including The Mushroom Company); Guan’s Mushroom Co.; Greenyard (Lutèce brand); Okechamp Group

Mushroom Stems Market

Mushroom Stems Market Key Takeaways

Metric Value
Market Value (2025) USD 4,720.0 million
Market Forecast (2035) USD 8,417.0 million
Growth Rate 6.0% CAGR
Leading Source Button Mushroom Segment
Primary Form Fresh Processing Segment

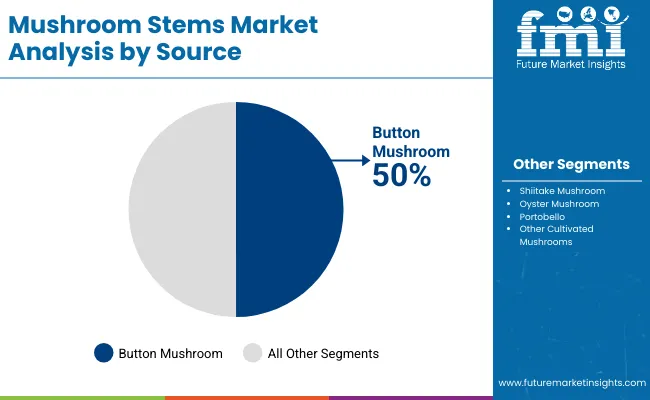
On the supply side, the structure of the market is unusually concentrated. Button mushroom stems command ~50% share by source, underpinned by scale, predictable morphology, and year-round availability. This is why processors prefer them: they lower processing risk and fit more easily into automated lines. Shiitake (20%) and oyster (12%) bring bioactive "story value" and premium positioning especially for nutraceutical and plant-based meat applications but they are structurally constrained by production base and cost. This explains the current equilibrium: button stems anchor volume; shiitake and oyster carry much of the value narrative in emerging high-margin niches.

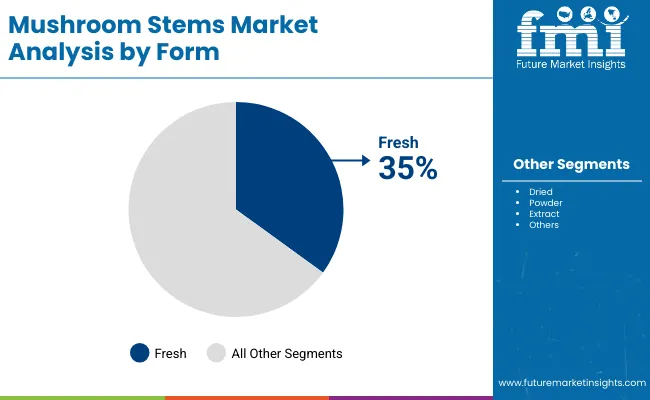
By form, the split between fresh (35%)and powder (30%) tells you where the money and complexity sit. Fresh stems are about immediacy and integration into existing processing (soups, sauces, frozen and chilled foods), which favors regions with robust cold chains and large processors. Powder, on the other hand, is the gateway into concentrated ingredients, supplements, and formulation-ready inputs, which justifies higher margins and more technical processing this is where advanced extraction, drying, and fermentation technologies become true differentiators rather than buzzwords. Extracts (15%) remain smaller in volume but are directly linked to nutraceuticals, cosmetics, and bioactive-enriched foods, i.e., the categories with the clearest willingness to pay.

The market demonstrates strong fundamentals with button mushroom processing capturing a dominant share through reliable supply capabilities and processing optimization. Industrial applications drive primary demand, supported by increasing waste utilization requirements and operational processing development. Geographic expansion remains concentrated in developed markets with established processing infrastructure, while emerging economies show accelerating adoption rates driven by food modernization initiatives and rising waste management standards.

Segmental Analysis

The market segments by source into button mushroom, shiitake mushroom, oyster mushroo, portobello, and other cultivated mushrooms, representing the evolution from basic waste materials to specialized ingredient sources for comprehensive food processing and industrial optimization. Form segmentation divides the market into fresh, dried, powder, and extract systems, reflecting distinct requirements for processing efficiency, functional reliability, and application-specific performance standards.

End use segmentation covers food & beverage, soups & sauces, plant-based meat, snacks & seasonings, nutraceuticals, animal feed, cosmetics & personal care, fertilizer & soil conditioner, bio-composites & packaging, and industrial enzymes & biomass, applications, demonstrating varied operational requirements and processing efficiency standards. Processing technology segmentation includes air drying, freeze drying, fermentation, and hot water extraction methods for specialized processing applications.

Sales channel segmentation encompasses B2B (ingredient suppliers, processors, food manufacturers) and B2C (retail packs, specialty food stores, online) distribution channels. The segmentation structure reveals technology progression from standard waste materials toward specialized mushroom stem applications with enhanced processing consistency and functional capabilities, while application diversity spans from food processing to industrial manufacturing requiring precise ingredient solutions.
By Source, the Button Mushroom Segment Accounts for Dominant Market Share

Mushroom Stems Market By Source

Market Position: Button mushroom processing commands the leading position in the mushroom stems market with 50% market share through advanced supply features, including consistent availability characteristics, operational efficiency, and processing optimization that enable manufacturers to achieve optimal performance across diverse food and industrial applications.

Value Drivers: The segment benefits from processor preference for reliable stem sources that provide consistent quality characteristics, reduced processing complexity, and operational efficiency optimization without requiring significant infrastructure modifications. Advanced processing features enable automated quality control systems, yield monitoring, and integration with existing manufacturing equipment, where operational performance and quality compliance represent critical processor requirements.

Competitive Advantages: Button mushroom processing differentiates through proven supply reliability, consistent stem characteristics, and integration with automated quality management systems that enhance processing effectiveness while maintaining optimal quality standards for diverse food and industrial applications.

Key market characteristics:

  • Advanced processing designs with optimized stem extraction configuration and operational efficiency capabilities
  • Enhanced processing effectiveness, enabling 85-90% utilization consistency with reliable stem performance
  • Manufacturing facility compatibility, including automated monitoring systems, quality integration, and process optimization for stem control

Shiitake Mushroom Applications Show Premium Market Growth

Shiitake mushroom applications maintain a 20% market position in the mushroom stems market due to their enhanced bioactive properties and specialized application characteristics. These systems appeal to processors requiring specialized performance with premium positioning for nutraceutical and health-focused applications. Market growth is driven by premium food segment expansion, emphasizing bioactive ingredient solutions and operational efficiency through optimized processing designs.

Oyster Mushroom Applications Demonstrate Specialty Solutions

Oyster mushroom applications capture 12% market share through specialized processing requirements in artisanal products, specialty foods, and niche manufacturing. These operations demand certified stem systems capable of operating with specialty processing while providing effective quality integration and performance capabilities.
By Form, Fresh Processing Shows Market Leadership

Mushroom Stems Market By Form

Market Context: Fresh form processing demonstrates market leadership in the mushroom stems market with 35% share due to widespread adoption of immediate processing systems and increasing focus on quality optimization, processing flexibility, and applications that maximize nutritional value while maintaining quality standards.

Appeal Factors: Food manufacturers prioritize stem freshness, operational efficiency, and integration with existing processing infrastructure that enables coordinated production operations across multiple application areas. The segment benefits from substantial processing investment and modernization programs that emphasize the acquisition of fresh processing systems for quality optimization and processing efficiency applications.

Growth Drivers: Processing facility expansion programs incorporate fresh stem processing as standard ingredient for production operations, while quality demands increase requirements for consistent fresh capabilities that comply with quality standards and minimize processing complexity.

Application dynamics include:

  • Strong growth in processing facilities and food operations requiring reliable stem capabilities
  • Increasing adoption in quality optimization and operational efficiency applications for manufacturers
  • Rising integration with automated food systems for operational optimization and quality assurance

Powder Processing Maintains Value-Added Demand

Powder processing captures 30% market share through comprehensive processing requirements in ingredient manufacturing, supplement production, and specialty processing operations. These operations demand reliable powder systems capable of handling concentrated processing while providing effective quality management and operational performance capabilities.
By End Use, Industrial Applications Show Market Leadership

Mushroom Stems Market By End Use

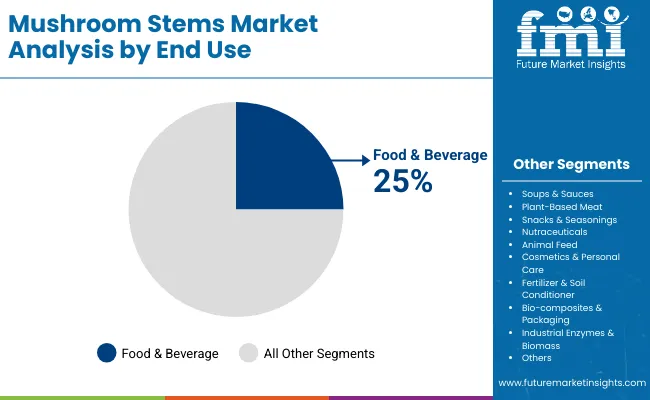
Market Context: Combined industrial applications demonstrate market leadership in the mushroom stems market with 47% share (including nutraceuticals, animal feed, cosmetics, fertilizer, bio-composites, and industrial enzymes) due to widespread adoption of waste utilization systems and increasing focus on processing optimization, circular economy principles, and applications that maximize waste value while maintaining quality standards.

Appeal Factors: Industrial processors prioritize stem consistency, operational reliability, and integration with existing processing infrastructure that enables coordinated production operations across multiple industrial applications. The segment benefits from substantial processing investment and modernization programs that emphasize the acquisition of waste utilization systems for efficiency optimization and processing applications.

Growth Drivers: Industrial facility expansion programs incorporate mushroom stem processing as standard ingredient for production operations, while circular economy demands increase requirements for consistent waste utilization capabilities that comply with quality standards and minimize processing complexity.

Food & Beverage Applications Maintain Traditional Demand

Food & beverage applications capture 25% market share through comprehensive processing requirements in soup production, seasoning manufacturing, and food processing operations requiring reliable stem systems capable of providing flavor enhancement while maintaining effective quality management and operational performance capabilities.

What are the Drivers, Restraints, and Key Trends of the Mushroom Stems Market?

Category Factor Impact Why It Matters
Driver Waste reduction initiatives & circular economy growth (processing optimization, resource efficiency) ★★★★★ Large-scale food markets require efficient, reliable waste utilization with consistent performance and environmental compliance across processing applications.
Driver Plant-based food expansion & alternative ingredients ★★★★★ Drives demand for specialized ingredient solutions and high-performance processing capabilities; suppliers providing plant-based materials gain competitive advantage.
Driver Nutraceutical market growth & bioactive compound demand (health applications, functional foods) ★★★★☆ Processing facilities need advanced ingredient solutions; demand for bioactive formats expanding addressable market segments.
Restraint Supply consistency challenges & seasonal availability (mushroom cultivation, processing infrastructure) ★★★★☆ Small processors face supply pressure; increases cost sensitivity and affects material availability in budget-sensitive markets.
Restraint Traditional ingredient competition & processing alternatives ★★★☆☆ Cost-focused applications face challenges with ingredient selection and processing requirements, limiting adoption in price-sensitive segments.
Trend Advanced extraction technology & processing enhancement (enzyme treatment, fermentation methods) ★★★★★ Growing demand for specialized processing solutions; extraction becomes core value proposition in advanced processing segments.
Trend Asian market expansion & regional processing growth ★★★★☆ Regional facility development drives demand for local ingredient solutions; regional processing capabilities drive competition toward localization.

Analysis of the Mushroom Stems Market by Key Country

Mushroom Stems Market By Country

Region/Country Strategic Positioning What to Consider
France Premium processing positioning Processing precision; market maturity
China Lead with high-volume processing systems Environmental regulations; processing complexity
Germany Premium quality positioning Over-specification; regulatory compliance
India Focus on cost-effective processing solutions Infrastructure challenges; supply availability
USA Provide industrial-grade applications FDA regulations; processing requirements
UK Offer health-compliant processing Market maturity; processing costs
Brazil Focus on agricultural integration Infrastructure challenges; market development

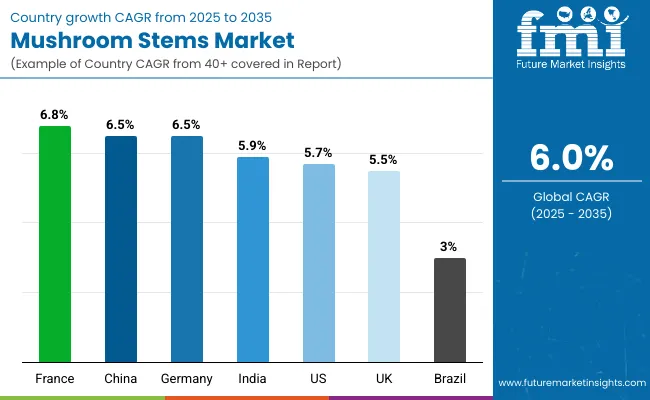
The mushroom stems market demonstrates varied regional dynamics with growth leaders including France (6.8% growth rate) and China (6.5% growth rate) driving expansion through processing initiatives and industrial capacity development. Steady Performers encompass Germany (6.4% growth rate), India (5.9% growth rate), and USA (5.7% growth rate), benefiting from established food industries and advanced processing adoption. Mature Markets feature UK (5.5% growth rate) and Brazil (3.0% growth rate), where processing technology advancement and quality standardization requirements support consistent growth patterns.

Regional synthesis reveals European and East Asian markets leading adoption through food processing expansion and industrial development, while North American countries maintain steady expansion supported by technology advancement and regulatory standardization requirements. Emerging markets show strong growth driven by food applications and processing modernization trends.

France Drives Premium Processing Market

France establishes premium processing market leadership through advanced food technology programs and established culinary infrastructure, integrating mushroom stems across food facilities and specialty applications. The country's 6.8% growth rate reflects established food industry relationships and advanced processing adoption that supports widespread use of alternative ingredients in culinary facilities and premium operations. Growth concentrates in major processing centers, including Île-de-France, Auvergne-Rhône-Alpes, and Provence-Alpes-Côte d'Azur, where food technology showcases advanced ingredient deployment that appeals to manufacturers seeking proven culinary capabilities and operational efficiency applications.

French processors leverage established supply networks and comprehensive culinary capabilities, including quality programs and application support that create customer relationships and operational advantages. The market benefits from advanced culinary standards and regulatory requirements that support alternative ingredient use while supporting technology advancement and processing optimization.

China Shows High-Volume Processing Development

China's expanding food processing market demonstrates growing mushroom stems integration with increasing adoption in commercial food facilities and industrial processing operations. The country maintains a 6.5% growth rate, supported by government food modernization initiatives and processing infrastructure development programs that promote alternative ingredient systems for food facilities. Processing centers in Guangdong, Jiangsu, and Shandong provinces showcase commercial installations where stem systems integrate with modern processing equipment to optimize food production operations.

Chinese processors adopt stem systems that provide consistent operational performance and quality compliance features, particularly appealing in food regions where processing efficiency and quality standards represent critical operational requirements. The market benefits from growing food processing capabilities and technology integration that enable domestic production of advanced ingredient systems for food applications.

Germany Demonstrates Premium Quality Focus

Germany's advanced food technology market demonstrates sophisticated mushroom stems integration with documented operational effectiveness in premium processing applications and modern facility installations through integration with existing quality systems and food infrastructure. The country maintains a 6.4% growth rate, leveraging traditional quality expertise and precision systems integration in ingredient technology. Processing centers, including North Rhine-Westphalia, Bavaria, and Baden-Württemberg, showcase premium installations where ingredient systems integrate with traditional quality platforms and modern facility management systems to optimize food operations and maintain processing quality profiles.

German processors prioritize ingredient precision and quality consistency in mushroom stems development, creating demand for premium systems with advanced features, including quality monitoring and automated processing systems. The market benefits from established quality infrastructure and commitment to food standards that provide long-term operational benefits and compliance with traditional quality processing methods.

India Shows Cost-Effective Processing Growth

India establishes cost-effective processing growth through agricultural integration programs and comprehensive supply infrastructure, integrating mushroom stems across food facilities and traditional applications. The country's 5.9% growth rate reflects growing agricultural investment and increasing adoption of processing technology that supports expanding use of alternative ingredients in Indian food facilities. Growth concentrates in major agricultural areas, including Maharashtra, Karnataka, and Punjab, where agricultural technology development showcases integrated processing systems that appeal to Indian processors seeking advanced cost-effective solutions with facility efficiency compatibility.

Indian processors focus on maintaining traditional standards while adopting modern processing efficiency, creating demand for systems that balance performance with cost advantages. The market benefits from strong agricultural infrastructure and growing processing opportunities that support ingredient technology adoption while maintaining quality standards important to Indian food applications.
USA Shows Industrial Application Development

Mushroom Stems Market Usa

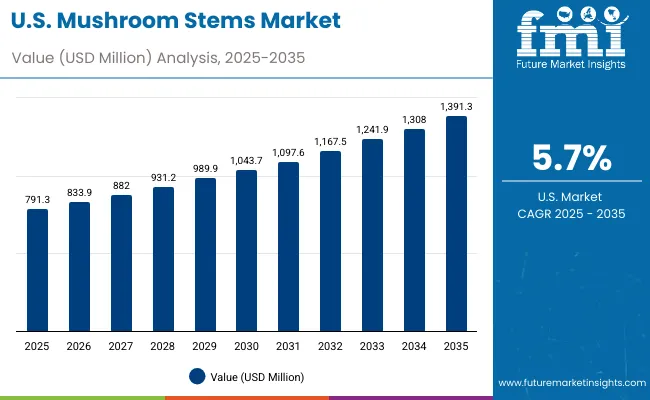
USA establishes industrial application development through comprehensive food processing programs and advanced manufacturing infrastructure, integrating mushroom stems across food facilities and industrial applications. The country's 5.7% growth rate reflects established food industry relationships and advanced processing adoption that supports widespread use of alternative ingredients in manufacturing facilities and industrial operations. Growth concentrates in major processing centers, including California, Texas, and Illinois, where food technology showcases advanced ingredient deployment that appeals to manufacturers seeking proven processing capabilities and operational efficiency applications.

American processors leverage established distribution networks and comprehensive technical capabilities, including quality programs and application support that create customer relationships and operational advantages. The market benefits from advanced food standards and FDA requirements that support alternative ingredient use while supporting technology advancement and processing optimization.

UK Shows Health-Compliant Market Development

UK establishes health-compliant market development through advanced food processing programs and established regulatory infrastructure, integrating mushroom stems across food facilities and health applications. The country's 5.5% growth rate reflects growing food industry relationships and established processing adoption that supports widespread use of alternative ingredients in food facilities and health-oriented operations. Growth concentrates in major processing areas, including London, Manchester, and Birmingham, where food technology showcases mature ingredient deployment that appeals to processors seeking proven health capabilities and operational efficiency applications.

British processors leverage established supply networks and comprehensive regulatory capabilities, including compliance programs and technical support that create customer relationships and operational advantages. The market benefits from established food standards and regulatory requirements that support alternative ingredient use while supporting technology advancement and processing optimization.

Brazil Shows Agricultural Integration Development

Brazil establishes agricultural integration development through commodity processing programs and agricultural infrastructure, integrating mushroom stems across food facilities and agricultural applications. The country's 3.0% growth rate reflects gradual agricultural investment and steady adoption of alternative processing technology that supports expanding use of specialty ingredients in Brazilian food facilities. Growth concentrates in major agricultural regions, including São Paulo, Minas Gerais, and Rio Grande do Sul, where agricultural technology development showcases integrated processing systems that appeal to Brazilian processors seeking agricultural integration solutions.

Brazilian processors focus on maintaining agricultural efficiency while adopting processing technology, creating demand for systems that balance performance with agricultural integration advantages. The market benefits from strong agricultural infrastructure and growing export opportunities that support ingredient technology adoption while maintaining efficiency standards important to Brazilian agricultural applications.
Europe Market Split by Country

Mushroom Stems Market Europe

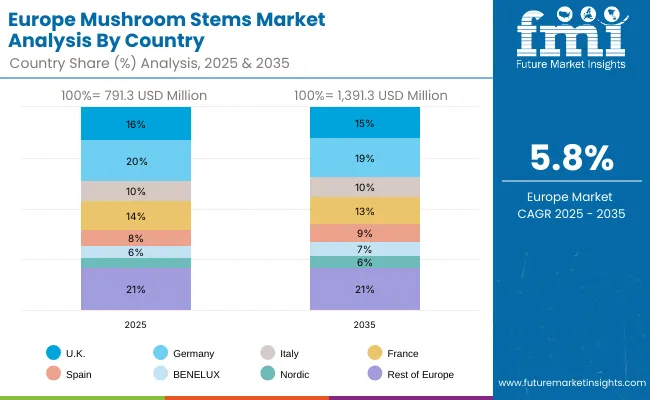
The European mushroom stems market is projected to represent a significant portion of global consumption, with strong regional distribution across major economies. Germany is expected to maintain its leadership position with USD 316.5 million in 2025, accounting for 20% European market share, supported by its advanced food processing infrastructure and major industrial centers.

United Kingdom follows with USD 253.2 million, representing 16% European market share in 2025, driven by comprehensive food programs and processing technology development initiatives. France holds USD 221.5 million through specialized culinary applications and processing compliance requirements. Italy commands USD 158.2 million, while Spain accounts for USD 126.6 million in 2025. BENELUX maintains USD 94.9 million, Nordic countries hold USD 79.1 million, and the rest of Europe region accounts for USD 332.3 million, attributed to increasing ingredient system adoption in emerging European countries and specialized food facilities implementing processing modernization programs.
Competitive Landscape of the Mushroom Stems Market

Mushroom Stems Market By Company

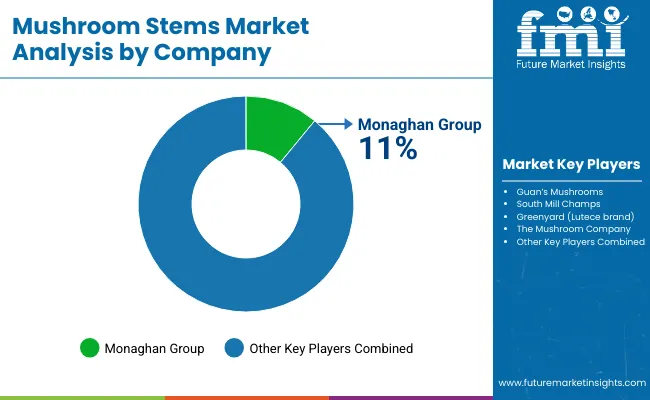
  • Structure: ~15-20 active players; top 3-4 hold ~40-45% by revenue, with Monaghan Group leading at 11.0% market share.
  • Leadership is maintained through: global processing networks, specialized ingredient systems, and regional supply capabilities (multi-application versatility + quality support + processing compliance).
  • What's commoditizing: standard mushroom stems supply and basic processing systems.
  • Margin Opportunities: specialized industrial applications, bioactive extracts, and comprehensive service contracts (quality monitoring, application support, compliance documentation).
Stakeholder What they actually control Typical strengths Typical blind spots
Global platforms Processing networks, broad ingredient portfolios, manufacturing facilities Proven reliability, multi-region support, comprehensive service Technology refresh cycles; customer lock-in dependency
Technology innovators R&D capabilities; advanced processing systems; extraction techniques Latest technology first; attractive ROI on specialized applications Service density outside core regions; customization complexity
Regional specialists Local sourcing, fast delivery, nearby technical support "Close to site" support; pragmatic pricing; local regulations Technology gaps; talent retention in food science
Application-focused ecosystems Industry expertise, technical support, specialized solutions Lowest application variation; comprehensive industry support Scaling costs if overpromised; technology obsolescence
Service specialists Quality programs, processing supply, technical training Win service-intensive applications; flexible support Scalability limitations; narrow market focus

Key Players in the Mushroom Stems Market

  • Monaghan Mushrooms
  • South Mill Champs (includes The Mushroom Company)
  • Guan’s Mushroom Co.
  • Greenyard (Lutèce brand)
  • Okechamp Group

Scope of the Report

Items Values
Quantitative Units (2025) USD 4,720 million
Source Button Mushroom, Shiitake Mushroom, Oyster Mushroom, Portobello, Other Cultivated Mushrooms
Form Fresh, Dried, Powder, Extract
End Use Food & Beverage, Soups & Sauces, Plant-Based Meat, Snacks & Seasonings, Nutraceuticals, Animal Feed, Cosmetics & Personal Care, Fertilizer & Soil Conditioner, Bio-composites & Packaging, Industrial Enzymes & Biomass
Processing Technology Air Drying, Freeze Drying, Fermentation, Hot Water Extraction
Sales Channel B2B (Ingredient Suppliers, Processors, Food Manufacturers), B2C (Retail Packs, Specialty Food Stores, Online)
Regions Covered North America, Latin America, Europe, East Asia, South Asia & Pacific, Middle East & Africa
Countries Covered China, Germany, United States, Japan, India, South Korea, France, United Kingdom, Brazil, and 25+ additional countries
Key Companies Profiled Monaghan Mushrooms; South Mill Champs (including The Mushroom Company); Guan’s Mushroom Co.; Greenyard (Lutèce brand); Okechamp Group
Additional Attributes Dollar sales by source and form categories, regional adoption trends across Europe, South Asia & Pacific, and North America, competitive landscape with processing suppliers and service providers, manufacturer preferences for quality consistency and operational reliability, integration with food platforms and processing monitoring systems.

Mushroom Stems Market by Segments

By Source:

  • Button Mushroom
  • Shiitake Mushroom
  • Oyster Mushroom
  • Portobello
  • Other Cultivated Mushrooms

By Form:

  • Fresh
  • Dried
  • Powder
  • Extract

By End Use:

  • Food & Beverage
  • Soups & Sauces
  • Plant-Based Meat
  • Snacks & Seasonings
  • Nutraceuticals
  • Animal Feed
  • Cosmetics & Personal Care
  • Fertilizer & Soil Conditioner
  • Bio-composites & Packaging
  • Industrial Enzymes & Biomass

By Processing Technology:

  • Air Drying
  • Freeze Drying
  • Fermentation
  • Hot Water Extraction

By Sales Channel:

  • B2B (Ingredient Suppliers, Processors, Food Manufacturers)
  • B2C (Retail Packs, Specialty Food Stores, Online)

By Region:

  • North America
    • United States
    • Canada
    • Mexico
  • Latin America
    • Brazil
    • Rest of Latin America
  • Europe
    • Germany
    • France
    • United Kingdom
    • Italy
    • Spain
    • BENELUX
    • Nordic
    • Rest of Europe
  • East Asia
    • China
    • Japan
    • South Korea
  • South Asia & Pacific
    • India
    • ASEAN
    • Australia & New Zealand
    • Rest of South Asia Pacific
  • Middle East & Africa
    • GCC Countries
    • South Africa
    • Rest of Middle East & Africa

Frequently Asked Questions

How big is the mushroom stems market and how fast is it growing?

It is valued at USD 4,720 million in 2025 and will reach USD 8,417 million by 2035 at a 6% CAGR.

Which mushroom type dominates stem supply?

Button mushrooms (~50% share) lead due to scale, consistency, and year-round availability.

What forms generate the most revenue?

Fresh stems (35%) lead in food processing; powder (30%) and extracts (15%) drive higher-margin functional and nutraceutical applications.

Which regions show the strongest growth?

Growth is led by France (6.8%), China (6.5%), and Germany (6.4%). Europe, South Asia & Pacific, and North America anchor adoption.

What are the top end-use industries?

Industrial applications (~47%) nutraceuticals, animal feed, cosmetics, bio-composites lead. Food & beverage (~25%) remains a core segment.

Table of Content

  1. Executive Summary
    • Global Market Outlook
    • Demand Side Trends
    • Supply Side Trends
    • Technology Roadmap Analysis
    • Analysis and Recommendations
  2. Market Overview
    • Market Coverage / Taxonomy
    • Market Definition / Scope / Limitations
  3. Market Background
    • Market Dynamics
      • Drivers
      • Restraints
      • Opportunity
      • Trends
    • Scenario Forecast
      • Demand in Optimistic Scenario
      • Demand in Likely Scenario
      • Demand in Conservative Scenario
    • Opportunity Map Analysis
    • Product Life Cycle Analysis
    • Supply Chain Analysis
    • Investment Feasibility Matrix
    • Value Chain Analysis
    • PESTLE and Porter's Analysis
    • Regulatory Landscape
    • Regional Parent Market Outlook
    • Production and Consumption Statistics
    • Import and Export Statistics
  4. Global Market Analysis 2020 to 2024 and Forecast, 2025 to 2035
    • Historical Market Size Value (USD Million) Analysis, 2020 to 2024
    • Current and Future Market Size Value (USD Million) Projections, 2025 to 2035
      • Y-o-Y Growth Trend Analysis
      • Absolute $ Opportunity Analysis
  5. Global Market Pricing Analysis 2020 to 2024 and Forecast 2025 to 2035
  6. Global Market Analysis 2020 to 2024 and Forecast 2025 to 2035, By Source
    • Introduction / Key Findings
    • Historical Market Size Value (USD Million) Analysis By Source, 2020 to 2024
    • Current and Future Market Size Value (USD Million) Analysis and Forecast By Source, 2025 to 2035
      • Button Mushroom
      • Shiitake Mushroom
      • Oyster Mushroom
      • Portobello
      • Other Cultivated Mushrooms
    • Y-o-Y Growth Trend Analysis By Source, 2020 to 2024
    • Absolute $ Opportunity Analysis By Source, 2025 to 2035
  7. Global Market Analysis 2020 to 2024 and Forecast 2025 to 2035, By Form
    • Introduction / Key Findings
    • Historical Market Size Value (USD Million) Analysis By Form, 2020 to 2024
    • Current and Future Market Size Value (USD Million) Analysis and Forecast By Form, 2025 to 2035
      • Fresh
      • Dried
      • Powder
      • Extract
    • Y-o-Y Growth Trend Analysis By Form, 2020 to 2024
    • Absolute $ Opportunity Analysis By Form, 2025 to 2035
  8. Global Market Analysis 2020 to 2024 and Forecast 2025 to 2035, By End Use
    • Introduction / Key Findings
    • Historical Market Size Value (USD Million) Analysis By End Use, 2020 to 2024
    • Current and Future Market Size Value (USD Million) Analysis and Forecast By End Use, 2025 to 2035
      • Food & Beverage
      • Soups & Sauces
      • Plant-Based Meat
      • Snacks & Seasonings
      • Nutraceuticals
      • Animal Feed
      • Cosmetics & Personal Care
      • Fertilizer & Soil Conditioner
      • Bio-composites & Packaging
      • Industrial Enzymes & Biomass
    • Y-o-Y Growth Trend Analysis By End Use, 2020 to 2024
    • Absolute $ Opportunity Analysis By End Use, 2025 to 2035
  9. Global Market Analysis 2020 to 2024 and Forecast 2025 to 2035, By Processing Technology
    • Introduction / Key Findings
    • Historical Market Size Value (USD Million) Analysis By Processing Technology, 2020 to 2024
    • Current and Future Market Size Value (USD Million) Analysis and Forecast By Processing Technology, 2025 to 2035
      • Air Drying
      • Freeze Drying
      • Fermentation
      • Hot Water Extraction
    • Y-o-Y Growth Trend Analysis By Processing Technology, 2020 to 2024
    • Absolute $ Opportunity Analysis By Processing Technology, 2025 to 2035
  10. Global Market Analysis 2020 to 2024 and Forecast 2025 to 2035, By Sales Channel
    • Introduction / Key Findings
    • Historical Market Size Value (USD Million) Analysis By Sales Channel, 2020 to 2024
    • Current and Future Market Size Value (USD Million) Analysis and Forecast By Sales Channel, 2025 to 2035
      • B2B (Ingredient Suppliers, Processors, Food Manufacturers)
      • B2C (Retail Packs, Specialty Food Stores, Online)
    • Y-o-Y Growth Trend Analysis By Sales Channel, 2020 to 2024
    • Absolute $ Opportunity Analysis By Sales Channel, 2025 to 2035
  11. Global Market Analysis 2020 to 2024 and Forecast 2025 to 2035, By Region
    • Introduction
    • Historical Market Size Value (USD Million) Analysis By Region, 2020 to 2024
    • Current Market Size Value (USD Million) Analysis and Forecast By Region, 2025 to 2035
      • North America
      • Latin America
      • Europe
      • East Asia
      • South Asia & Pacific
      • Middle East & Africa
    • Market Attractiveness Analysis By Region
  12. North America Market Analysis 2020 to 2024 and Forecast 2025 to 2035, By Country
    • Historical Market Size Value (USD Million) Trend Analysis By Market Taxonomy, 2020 to 2024
    • Market Size Value (USD Million) Forecast By Market Taxonomy, 2025 to 2035
      • By Country
      • United States
      • Canada
      • Mexico
      • By Source
      • By Form
      • By End Use
      • By Processing Technology
      • By Sales Channel
    • Market Attractiveness Analysis
      • By Country
      • By Source
      • By Form
      • By End Use
      • By Processing Technology
      • By Sales Channel
    • Key Takeaways
  13. Latin America Market Analysis 2020 to 2024 and Forecast 2025 to 2035, By Country
    • Historical Market Size Value (USD Million) Trend Analysis By Market Taxonomy, 2020 to 2024
    • Market Size Value (USD Million) Forecast By Market Taxonomy, 2025 to 2035
      • By Country
      • Brazil
      • Rest of Latin America
      • By Source
      • By Form
      • By End Use
      • By Processing Technology
      • By Sales Channel
    • Market Attractiveness Analysis
      • By Country
      • By Source
      • By Form
      • By End Use
      • By Processing Technology
      • By Sales Channel
    • Key Takeaways
  14. Europe Market Analysis 2020 to 2024 and Forecast 2025 to 2035, By Country
    • Historical Market Size Value (USD Million) Trend Analysis By Market Taxonomy, 2020 to 2024
    • Market Size Value (USD Million) Forecast By Market Taxonomy, 2025 to 2035
      • By Country
      • Germany
      • France
      • United Kingdom
      • Italy
      • Spain
      • BENELUX
      • Nordic
      • Rest of Europe
      • By Source
      • By Form
      • By End Use
      • By Processing Technology
      • By Sales Channel
    • Market Attractiveness Analysis
      • By Country
      • By Source
      • By Form
      • By End Use
      • By Processing Technology
      • By Sales Channel
    • Key Takeaways
  15. East Asia Market Analysis 2020 to 2024 and Forecast 2025 to 2035, By Country
    • Historical Market Size Value (USD Million) Trend Analysis By Market Taxonomy, 2020 to 2024
    • Market Size Value (USD Million) Forecast By Market Taxonomy, 2025 to 2035
      • By Country
      • China
      • Japan
      • South Korea
      • By Source
      • By Form
      • By End Use
      • By Processing Technology
      • By Sales Channel
    • Market Attractiveness Analysis
      • By Country
      • By Source
      • By Form
      • By End Use
      • By Processing Technology
      • By Sales Channel
    • Key Takeaways
  16. South Asia & Pacific Market Analysis 2020 to 2024 and Forecast 2025 to 2035, By Country
    • Historical Market Size Value (USD Million) Trend Analysis By Market Taxonomy, 2020 to 2024
    • Market Size Value (USD Million) Forecast By Market Taxonomy, 2025 to 2035
      • By Country
      • India
      • ASEAN
      • Australia & New Zealand
      • Rest of South Asia Pacific
      • By Source
      • By Form
      • By End Use
      • By Processing Technology
      • By Sales Channel
    • Market Attractiveness Analysis
      • By Country
      • By Source
      • By Form
      • By End Use
      • By Processing Technology
      • By Sales Channel
    • Key Takeaways
  17. Middle East & Africa Market Analysis 2020 to 2024 and Forecast 2025 to 2035, By Country
    • Historical Market Size Value (USD Million) Trend Analysis By Market Taxonomy, 2020 to 2024
    • Market Size Value (USD Million) Forecast By Market Taxonomy, 2025 to 2035
      • By Country
      • GCC Countries
      • South Africa
      • Rest of Middle East & Africa
      • By Source
      • By Form
      • By End Use
      • By Processing Technology
      • By Sales Channel
    • Market Attractiveness Analysis
      • By Country
      • By Source
      • By Form
      • By End Use
      • By Processing Technology
      • By Sales Channel
    • Key Takeaways
  18. Key Countries Market Analysis
    • United States
      • Pricing Analysis
      • Market Share Analysis, 2024
      • By Source
      • By Form
      • By End Use
      • By Processing Technology
      • By Sales Channel
    • Canada
      • Pricing Analysis
      • Market Share Analysis, 2024
      • By Source
      • By Form
      • By End Use
      • By Processing Technology
      • By Sales Channel
    • Mexico
      • Pricing Analysis
      • Market Share Analysis, 2024
      • By Source
      • By Form
      • By End Use
      • By Processing Technology
      • By Sales Channel
    • Brazil
      • Pricing Analysis
      • Market Share Analysis, 2024
      • By Source
      • By Form
      • By End Use
      • By Processing Technology
      • By Sales Channel
    • Germany
      • Pricing Analysis
      • Market Share Analysis, 2024
      • By Source
      • By Form
      • By End Use
      • By Processing Technology
      • By Sales Channel
    • France
      • Pricing Analysis
      • Market Share Analysis, 2024
      • By Source
      • By Form
      • By End Use
      • By Processing Technology
      • By Sales Channel
    • United Kingdom
      • Pricing Analysis
      • Market Share Analysis, 2024
      • By Source
      • By Form
      • By End Use
      • By Processing Technology
      • By Sales Channel
    • Italy
      • Pricing Analysis
      • Market Share Analysis, 2024
      • By Source
      • By Form
      • By End Use
      • By Processing Technology
      • By Sales Channel
    • Spain
      • Pricing Analysis
      • Market Share Analysis, 2024
      • By Source
      • By Form
      • By End Use
      • By Processing Technology
      • By Sales Channel
    • China
      • Pricing Analysis
      • Market Share Analysis, 2024
      • By Source
      • By Form
      • By End Use
      • By Processing Technology
      • By Sales Channel
    • Japan
      • Pricing Analysis
      • Market Share Analysis, 2024
      • By Source
      • By Form
      • By End Use
      • By Processing Technology
      • By Sales Channel
    • South Korea
      • Pricing Analysis
      • Market Share Analysis, 2024
      • By Source
      • By Form
      • By End Use
      • By Processing Technology
      • By Sales Channel
    • India
      • Pricing Analysis
      • Market Share Analysis, 2024
      • By Source
      • By Form
      • By End Use
      • By Processing Technology
      • By Sales Channel
    • ASEAN
      • Pricing Analysis
      • Market Share Analysis, 2024
      • By Source
      • By Form
      • By End Use
      • By Processing Technology
      • By Sales Channel
    • Australia & New Zealand
      • Pricing Analysis
      • Market Share Analysis, 2024
      • By Source
      • By Form
      • By End Use
      • By Processing Technology
      • By Sales Channel
    • GCC Countries
      • Pricing Analysis
      • Market Share Analysis, 2024
      • By Source
      • By Form
      • By End Use
      • By Processing Technology
      • By Sales Channel
    • South Africa
      • Pricing Analysis
      • Market Share Analysis, 2024
      • By Source
      • By Form
      • By End Use
      • By Processing Technology
      • By Sales Channel
  19. Market Structure Analysis
    • Competition Dashboard
    • Competition Benchmarking
    • Market Share Analysis of Top Players
      • By Regional
      • By Source
      • By Form
      • By End Use
      • By Processing Technology
      • By Sales Channel
  20. Competition Analysis
    • Competition Deep Dive
      • Monaghan Group
      • Overview
      • Product Portfolio
      • Profitability by Market Segments (Product/Age/Sales Channel/Region)
      • Sales Footprint
      • Strategy Overview
      • Marketing Strategy
      • Product Strategy
      • Channel Strategy
      • Guan's Mushrooms
      • South Mill Champs
      • Greenyard (Lutece brand)
      • The Mushroom Company
  21. Assumptions & Acronyms Used
  22. Research Methodology

List of Tables

  • Table 1: Global Market Value (USD Million) Forecast by Region, 2020 to 2035
  • Table 2: Global Market Value (USD Million) Forecast by Source, 2020 to 2035
  • Table 3: Global Market Value (USD Million) Forecast by Form, 2020 to 2035
  • Table 4: Global Market Value (USD Million) Forecast by End Use, 2020 to 2035
  • Table 5: Global Market Value (USD Million) Forecast by Processing Technology, 2020 to 2035
  • Table 6: Global Market Value (USD Million) Forecast by Sales Channel, 2020 to 2035
  • Table 7: North America Market Value (USD Million) Forecast by Country, 2020 to 2035
  • Table 8: North America Market Value (USD Million) Forecast by Source, 2020 to 2035
  • Table 9: North America Market Value (USD Million) Forecast by Form, 2020 to 2035
  • Table 10: North America Market Value (USD Million) Forecast by End Use, 2020 to 2035
  • Table 11: North America Market Value (USD Million) Forecast by Processing Technology, 2020 to 2035
  • Table 12: North America Market Value (USD Million) Forecast by Sales Channel, 2020 to 2035
  • Table 13: Latin America Market Value (USD Million) Forecast by Country, 2020 to 2035
  • Table 14: Latin America Market Value (USD Million) Forecast by Source, 2020 to 2035
  • Table 15: Latin America Market Value (USD Million) Forecast by Form, 2020 to 2035
  • Table 16: Latin America Market Value (USD Million) Forecast by End Use, 2020 to 2035
  • Table 17: Latin America Market Value (USD Million) Forecast by Processing Technology, 2020 to 2035
  • Table 18: Latin America Market Value (USD Million) Forecast by Sales Channel, 2020 to 2035
  • Table 19: Europe Market Value (USD Million) Forecast by Country, 2020 to 2035
  • Table 20: Europe Market Value (USD Million) Forecast by Source, 2020 to 2035
  • Table 21: Europe Market Value (USD Million) Forecast by Form, 2020 to 2035
  • Table 22: Europe Market Value (USD Million) Forecast by End Use, 2020 to 2035
  • Table 23: Europe Market Value (USD Million) Forecast by Processing Technology, 2020 to 2035
  • Table 24: Europe Market Value (USD Million) Forecast by Sales Channel, 2020 to 2035
  • Table 25: East Asia Market Value (USD Million) Forecast by Country, 2020 to 2035
  • Table 26: East Asia Market Value (USD Million) Forecast by Source, 2020 to 2035
  • Table 27: East Asia Market Value (USD Million) Forecast by Form, 2020 to 2035
  • Table 28: East Asia Market Value (USD Million) Forecast by End Use, 2020 to 2035
  • Table 29: East Asia Market Value (USD Million) Forecast by Processing Technology, 2020 to 2035
  • Table 30: East Asia Market Value (USD Million) Forecast by Sales Channel, 2020 to 2035
  • Table 31: South Asia & Pacific Market Value (USD Million) Forecast by Country, 2020 to 2035
  • Table 32: South Asia & Pacific Market Value (USD Million) Forecast by Source, 2020 to 2035
  • Table 33: South Asia & Pacific Market Value (USD Million) Forecast by Form, 2020 to 2035
  • Table 34: South Asia & Pacific Market Value (USD Million) Forecast by End Use, 2020 to 2035
  • Table 35: South Asia & Pacific Market Value (USD Million) Forecast by Processing Technology, 2020 to 2035
  • Table 36: South Asia & Pacific Market Value (USD Million) Forecast by Sales Channel, 2020 to 2035
  • Table 37: Middle East & Africa Market Value (USD Million) Forecast by Country, 2020 to 2035
  • Table 38: Middle East & Africa Market Value (USD Million) Forecast by Source, 2020 to 2035
  • Table 39: Middle East & Africa Market Value (USD Million) Forecast by Form, 2020 to 2035
  • Table 40: Middle East & Africa Market Value (USD Million) Forecast by End Use, 2020 to 2035
  • Table 41: Middle East & Africa Market Value (USD Million) Forecast by Processing Technology, 2020 to 2035
  • Table 42: Middle East & Africa Market Value (USD Million) Forecast by Sales Channel, 2020 to 2035

List of Figures

  • Figure 1: Global Market Pricing Analysis
  • Figure 2: Global Market Value (USD Million) Forecast 2020-2035
  • Figure 3: Global Market Value Share and BPS Analysis by Source, 2025 and 2035
  • Figure 4: Global Market Y-o-Y Growth Comparison by Source, 2025-2035
  • Figure 5: Global Market Attractiveness Analysis by Source
  • Figure 6: Global Market Value Share and BPS Analysis by Form, 2025 and 2035
  • Figure 7: Global Market Y-o-Y Growth Comparison by Form, 2025-2035
  • Figure 8: Global Market Attractiveness Analysis by Form
  • Figure 9: Global Market Value Share and BPS Analysis by End Use, 2025 and 2035
  • Figure 10: Global Market Y-o-Y Growth Comparison by End Use, 2025-2035
  • Figure 11: Global Market Attractiveness Analysis by End Use
  • Figure 12: Global Market Value Share and BPS Analysis by Processing Technology, 2025 and 2035
  • Figure 13: Global Market Y-o-Y Growth Comparison by Processing Technology, 2025-2035
  • Figure 14: Global Market Attractiveness Analysis by Processing Technology
  • Figure 15: Global Market Value Share and BPS Analysis by Sales Channel, 2025 and 2035
  • Figure 16: Global Market Y-o-Y Growth Comparison by Sales Channel, 2025-2035
  • Figure 17: Global Market Attractiveness Analysis by Sales Channel
  • Figure 18: Global Market Value Share and BPS Analysis by Region, 2025 and 2035
  • Figure 19: Global Market Y-o-Y Growth Comparison by Region, 2025-2035
  • Figure 20: Global Market Attractiveness Analysis by Region
  • Figure 21: North America Market Incremental Dollar Opportunity, 2025-2035
  • Figure 22: Latin America Market Incremental Dollar Opportunity, 2025-2035
  • Figure 23: Europe Market Incremental Dollar Opportunity, 2025-2035
  • Figure 24: East Asia Market Incremental Dollar Opportunity, 2025-2035
  • Figure 25: South Asia & Pacific Market Incremental Dollar Opportunity, 2025-2035
  • Figure 26: Middle East & Africa Market Incremental Dollar Opportunity, 2025-2035
  • Figure 27: North America Market Value Share and BPS Analysis by Country, 2025 and 2035
  • Figure 28: North America Market Value Share and BPS Analysis by Source, 2025 and 2035
  • Figure 29: North America Market Y-o-Y Growth Comparison by Source, 2025-2035
  • Figure 30: North America Market Attractiveness Analysis by Source
  • Figure 31: North America Market Value Share and BPS Analysis by Form, 2025 and 2035
  • Figure 32: North America Market Y-o-Y Growth Comparison by Form, 2025-2035
  • Figure 33: North America Market Attractiveness Analysis by Form
  • Figure 34: North America Market Value Share and BPS Analysis by End Use, 2025 and 2035
  • Figure 35: North America Market Y-o-Y Growth Comparison by End Use, 2025-2035
  • Figure 36: North America Market Attractiveness Analysis by End Use
  • Figure 37: North America Market Value Share and BPS Analysis by Processing Technology, 2025 and 2035
  • Figure 38: North America Market Y-o-Y Growth Comparison by Processing Technology, 2025-2035
  • Figure 39: North America Market Attractiveness Analysis by Processing Technology
  • Figure 40: North America Market Value Share and BPS Analysis by Sales Channel, 2025 and 2035
  • Figure 41: North America Market Y-o-Y Growth Comparison by Sales Channel, 2025-2035
  • Figure 42: North America Market Attractiveness Analysis by Sales Channel
  • Figure 43: Latin America Market Value Share and BPS Analysis by Country, 2025 and 2035
  • Figure 44: Latin America Market Value Share and BPS Analysis by Source, 2025 and 2035
  • Figure 45: Latin America Market Y-o-Y Growth Comparison by Source, 2025-2035
  • Figure 46: Latin America Market Attractiveness Analysis by Source
  • Figure 47: Latin America Market Value Share and BPS Analysis by Form, 2025 and 2035
  • Figure 48: Latin America Market Y-o-Y Growth Comparison by Form, 2025-2035
  • Figure 49: Latin America Market Attractiveness Analysis by Form
  • Figure 50: Latin America Market Value Share and BPS Analysis by End Use, 2025 and 2035
  • Figure 51: Latin America Market Y-o-Y Growth Comparison by End Use, 2025-2035
  • Figure 52: Latin America Market Attractiveness Analysis by End Use
  • Figure 53: Latin America Market Value Share and BPS Analysis by Processing Technology, 2025 and 2035
  • Figure 54: Latin America Market Y-o-Y Growth Comparison by Processing Technology, 2025-2035
  • Figure 55: Latin America Market Attractiveness Analysis by Processing Technology
  • Figure 56: Latin America Market Value Share and BPS Analysis by Sales Channel, 2025 and 2035
  • Figure 57: Latin America Market Y-o-Y Growth Comparison by Sales Channel, 2025-2035
  • Figure 58: Latin America Market Attractiveness Analysis by Sales Channel
  • Figure 59: Europe Market Value Share and BPS Analysis by Country, 2025 and 2035
  • Figure 60: Europe Market Value Share and BPS Analysis by Source, 2025 and 2035
  • Figure 61: Europe Market Y-o-Y Growth Comparison by Source, 2025-2035
  • Figure 62: Europe Market Attractiveness Analysis by Source
  • Figure 63: Europe Market Value Share and BPS Analysis by Form, 2025 and 2035
  • Figure 64: Europe Market Y-o-Y Growth Comparison by Form, 2025-2035
  • Figure 65: Europe Market Attractiveness Analysis by Form
  • Figure 66: Europe Market Value Share and BPS Analysis by End Use, 2025 and 2035
  • Figure 67: Europe Market Y-o-Y Growth Comparison by End Use, 2025-2035
  • Figure 68: Europe Market Attractiveness Analysis by End Use
  • Figure 69: Europe Market Value Share and BPS Analysis by Processing Technology, 2025 and 2035
  • Figure 70: Europe Market Y-o-Y Growth Comparison by Processing Technology, 2025-2035
  • Figure 71: Europe Market Attractiveness Analysis by Processing Technology
  • Figure 72: Europe Market Value Share and BPS Analysis by Sales Channel, 2025 and 2035
  • Figure 73: Europe Market Y-o-Y Growth Comparison by Sales Channel, 2025-2035
  • Figure 74: Europe Market Attractiveness Analysis by Sales Channel
  • Figure 75: East Asia Market Value Share and BPS Analysis by Country, 2025 and 2035
  • Figure 76: East Asia Market Value Share and BPS Analysis by Source, 2025 and 2035
  • Figure 77: East Asia Market Y-o-Y Growth Comparison by Source, 2025-2035
  • Figure 78: East Asia Market Attractiveness Analysis by Source
  • Figure 79: East Asia Market Value Share and BPS Analysis by Form, 2025 and 2035
  • Figure 80: East Asia Market Y-o-Y Growth Comparison by Form, 2025-2035
  • Figure 81: East Asia Market Attractiveness Analysis by Form
  • Figure 82: East Asia Market Value Share and BPS Analysis by End Use, 2025 and 2035
  • Figure 83: East Asia Market Y-o-Y Growth Comparison by End Use, 2025-2035
  • Figure 84: East Asia Market Attractiveness Analysis by End Use
  • Figure 85: East Asia Market Value Share and BPS Analysis by Processing Technology, 2025 and 2035
  • Figure 86: East Asia Market Y-o-Y Growth Comparison by Processing Technology, 2025-2035
  • Figure 87: East Asia Market Attractiveness Analysis by Processing Technology
  • Figure 88: East Asia Market Value Share and BPS Analysis by Sales Channel, 2025 and 2035
  • Figure 89: East Asia Market Y-o-Y Growth Comparison by Sales Channel, 2025-2035
  • Figure 90: East Asia Market Attractiveness Analysis by Sales Channel
  • Figure 91: South Asia & Pacific Market Value Share and BPS Analysis by Country, 2025 and 2035
  • Figure 92: South Asia & Pacific Market Value Share and BPS Analysis by Source, 2025 and 2035
  • Figure 93: South Asia & Pacific Market Y-o-Y Growth Comparison by Source, 2025-2035
  • Figure 94: South Asia & Pacific Market Attractiveness Analysis by Source
  • Figure 95: South Asia & Pacific Market Value Share and BPS Analysis by Form, 2025 and 2035
  • Figure 96: South Asia & Pacific Market Y-o-Y Growth Comparison by Form, 2025-2035
  • Figure 97: South Asia & Pacific Market Attractiveness Analysis by Form
  • Figure 98: South Asia & Pacific Market Value Share and BPS Analysis by End Use, 2025 and 2035
  • Figure 99: South Asia & Pacific Market Y-o-Y Growth Comparison by End Use, 2025-2035
  • Figure 100: South Asia & Pacific Market Attractiveness Analysis by End Use
  • Figure 101: South Asia & Pacific Market Value Share and BPS Analysis by Processing Technology, 2025 and 2035
  • Figure 102: South Asia & Pacific Market Y-o-Y Growth Comparison by Processing Technology, 2025-2035
  • Figure 103: South Asia & Pacific Market Attractiveness Analysis by Processing Technology
  • Figure 104: South Asia & Pacific Market Value Share and BPS Analysis by Sales Channel, 2025 and 2035
  • Figure 105: South Asia & Pacific Market Y-o-Y Growth Comparison by Sales Channel, 2025-2035
  • Figure 106: South Asia & Pacific Market Attractiveness Analysis by Sales Channel
  • Figure 107: Middle East & Africa Market Value Share and BPS Analysis by Country, 2025 and 2035
  • Figure 108: Middle East & Africa Market Value Share and BPS Analysis by Source, 2025 and 2035
  • Figure 109: Middle East & Africa Market Y-o-Y Growth Comparison by Source, 2025-2035
  • Figure 110: Middle East & Africa Market Attractiveness Analysis by Source
  • Figure 111: Middle East & Africa Market Value Share and BPS Analysis by Form, 2025 and 2035
  • Figure 112: Middle East & Africa Market Y-o-Y Growth Comparison by Form, 2025-2035
  • Figure 113: Middle East & Africa Market Attractiveness Analysis by Form
  • Figure 114: Middle East & Africa Market Value Share and BPS Analysis by End Use, 2025 and 2035
  • Figure 115: Middle East & Africa Market Y-o-Y Growth Comparison by End Use, 2025-2035
  • Figure 116: Middle East & Africa Market Attractiveness Analysis by End Use
  • Figure 117: Middle East & Africa Market Value Share and BPS Analysis by Processing Technology, 2025 and 2035
  • Figure 118: Middle East & Africa Market Y-o-Y Growth Comparison by Processing Technology, 2025-2035
  • Figure 119: Middle East & Africa Market Attractiveness Analysis by Processing Technology
  • Figure 120: Middle East & Africa Market Value Share and BPS Analysis by Sales Channel, 2025 and 2035
  • Figure 121: Middle East & Africa Market Y-o-Y Growth Comparison by Sales Channel, 2025-2035
  • Figure 122: Middle East & Africa Market Attractiveness Analysis by Sales Channel
  • Figure 123: Global Market - Tier Structure Analysis
  • Figure 124: Global Market - Company Share Analysis
Dashboard
Dashboard
Dashboard
Dashboard
Dashboard
Dashboard

Our Research Products

Full Research Suite

The "Full Research Suite" delivers actionable market intel, deep dives on markets or technologies, so clients act faster, cut risk, and unlock growth.

Competitor Leaderboard Report

The Leaderboard benchmarks and ranks top vendors, classifying them as Established Leaders, Leading Challengers, or Disruptors & Challengers.

Future Leaders Index

Locates where complements amplify value and substitutes erode it, forecasting net impact by horizon

Market Data & Forecasts

We deliver granular, decision-grade intel: market sizing, 5-year forecasts, pricing, adoption, usage, revenue, and operational KPIs—plus competitor tracking, regulation, and value chains—across 60 countries broadly.

Market Focus Report

Spot the shifts before they hit your P&L. We track inflection points, adoption curves, pricing moves, and ecosystem plays to show where demand is heading, why it is changing, and what to do next across high-growth markets and disruptive tech

Survey Report

Real-time reads of user behavior. We track shifting priorities, perceptions of today’s and next-gen services, and provider experience, then pace how fast tech moves from trial to adoption, blending buyer, consumer, and channel inputs with social signals (#WhySwitch, #UX).

Bespoke Reports

Partner with our analyst team to build a custom report designed around your business priorities. From analysing market trends to assessing competitors or crafting bespoke datasets, we tailor insights to your needs.

Supplier Intelligence

Discovery & Profiling

Capacity & Footprint

Performance & Risk

Compliance & Governance

Commercial Readiness

Who Supplies Whom

Scorecards & Shortlists

Playbooks & Docs

Category Intelligence

Definition & Scope

Demand & Use Cases

Cost Drivers

Market Structure

Supply Chain Map

Trade & Policy

Operating Norms

Deliverables

Buyer Intelligence

Account Basics

Spend & Scope

Procurement Model

Vendor Requirements

Terms & Policies

Entry Strategy

Pain Points & Triggers

Outputs

Pricing Analysis

Benchmarks

Trends

Should-Cost

Indexation

Landed Cost

Commercial Terms

Deliverables

Brand Analysis

Positioning & Value Prop

Share & Presence

Customer Evidence

Go-to-Market

Digital & Reputation

Compliance & Trust

KPIs & Gaps

Outputs

Full Research Suite comprises of:

Market outlook & trends analysis

Market outlook & trends analysis

Interviews & case studies

Interviews & case studies

Strategic recommendations

Strategic recommendations

Vendor profiles & capabilities analysis

Vendor profiles & capabilities analysis

5-year forecasts

5-year forecasts

8 regions and 60+ country-level data splits

8 regions and 60+ country-level data splits

Market segment data splits

Market segment data splits

12 months of continuous data updates

12 months of continuous data updates

DELIVERED AS:

PDF EXCEL ONLINE

Full Research Suite


$3500

$5000

$6500

Buy Report Now
Similar Industry Reports

Similar Industry Reports

Mushroom-Based Animal Feed Market

Mushroom-Based Animal Feed Market Size and Share Forecast Outlook 2025 to 2035

Mushroom Packaging Market

Mushroom Packaging Market Size and Share Forecast Outlook 2025 to 2035

Mushroom-Powered Skincare Market

Mushroom-Powered Skincare Market Analysis - Size, Share, and Forecast Outlook 2025 to 2035

Mushroom-Based Snacks Market

Mushroom-Based Snacks Market Analysis - Size and Share Forecast Outlook 2025 to 2035

Mushroom supplement Market

Mushroom Supplement Market Size and Share Forecast Outlook 2025 to 2035

Mushroom Beer Market

Mushroom Beer Market Trends - Brewing Innovation & Consumer Growth 2025 to 2035

Mushroom Packaging Market Share Analysis

Competitive Overview of Mushroom Packaging Companies

Mushroom Fermenter Market

Mushroom Fermenter Market Growth – Production & Demand 2025 to 2035

Mushroom Material Market

Mushroom Materials Market Growth – Trends & Forecast 2024-2034

Mushroom Gummy Market

Mushroom Gummy Market – Consumer Trends & Functional Benefits

Mushroom Protein Market

Mushroom Protein Market

Systems Administration Management Tools Market

Systems Administration Management Tools Market Size and Share Forecast Outlook 2025 to 2035

Chaga Mushroom Powder Market

Chaga Mushroom Powder Market Size and Share Forecast Outlook 2025 to 2035

Chaga Mushroom-Based Products Market

Chaga Mushroom-Based Products Market Analysis by Antioxidant, Anti-inflammatory, Alkalizing and other Applications Through 2035

White Mushroom Market Share Analysis

Leading Providers & Market Share in White Mushroom Industry

VRF Systems Market
VRF Systems Market

VRF Systems Market Growth - Trends & Forecast 2025 to 2035

Dried Mushrooms Market

Dried Mushrooms Market Analysis – Trends & Forecast 2024-2034

Canned Mushroom Market

Canned Mushroom Market Analysis by Nature, Product Type, Form, and End-Use Application Through 2035

Button Mushroom Products Market

Button Mushroom Products Market – Growth, Demand & Culinary Innovations

Cloud Systems Management Software Market

Cloud Systems Management Software Market Size and Share Forecast Outlook 2025 to 2035

Future Market Insights

Mushroom Stems Market

Chat With MaRIA

Chat With

MaRIA

Hi There, I am MaRIA, Your Market Research Intelligence Assistant. How may I help you?