Reports

- Global Locations -

Headquarters

Future Market Insights, Inc.

Christiana Corporate, 200
Continental Drive, Suite 401,
Newark, Delaware - 19713,
United States

T: +1-845-579-5705

Americas

Future Market Insights, Inc.

616 Corporate Way, Suite 2-9018,
Valley Cottage, NY 10989, United States

T: +1-347-918-3531

MEA

Future Market Insights

1602-6 Jumeirah Bay X2 Tower, Plot No: JLT-PH2-X2A,
Jumeirah Lakes Towers, Dubai,
United Arab Emirates

Europe

Future Market Insights

3rd Floor, 207 Regent Street,
W1B 3HH London
United Kingdom

T: + 44 (0) 20 8123 9659
D: +44 (0) 20 3287 4268

Asia Pacific

Future Market Insights

IndiaLand Global Tech Park, Unit UG-1, Behind Grand HighStreet, Phase 1, Hinjawadi, MH, Pune – 411057, India

Myopia and Presbyopia Treatment Market Outlook (2022-2032)

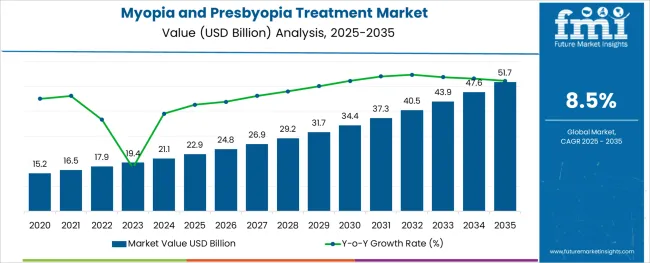
[333 Pages Report] The global myopia and presbyopia treatment market is expected to reach a market valuation of US$ 17.9 Billion by the year 2022, accelerating with a CAGR of 8.5% by 2022-2032. The myopia and presbyopia treatment market share is anticipated to be valued at about US$ 40.5 Billion by 2032 end.

Soaring myopia-related vision loss incidences and the frequency of myopia-related distant visual impairments are two of the key reasons that are anticipated to boost the myopia and presbyopia treatment market share. Secondly, during the course of the forthcoming years, the myopia and presbyopia market size is anticipated to rise given the increasing prevalence of nearsightedness on a massive level.

Attributes Value
Myopia and Presbyopia Treatment Market Size (2022) US$ 17.9 Billion
Myopia and Presbyopia Treatment Market Projected Size (2032) US$ 40.5 Billion
Myopia and Presbyopia Treatment Market Growth CAGR (2022 to 2032) 8.5%

According to the global market study on myopia and presbyopia treatment services, around the world, presbyopia affected more than 2.1 Billion people in the year 2020. As per the estimates of UN World Health Organization (WHO), untreated presbyopia affected over 826 Million of people globally in the year 2020. Consequently, over the projection period, it is anticipated that the emerging nations would see a considerable development in the adoption of myopia and presbyopia treatment services.

Elderly people those are in their early 40s and the expanding aging population who are at risk for eyesight loss—are majorly driving the myopia and presbyopia treatment market growth. Moreover, it is expected that the demand for myopia and presbyopia treatment might increase as the imbalanced lifestyle of a large section of society results in many kind of eyesight problem conditions.

Corneal inlays are an additional cutting-edge alternative for people with presbyopia which in turn is emerging as the major attraction in the global myopia and presbyopia market share. Besides, the advent of cutting-edge lenses namely implantable contact lenses and intraocular phakic intraocular lenses (PIOL) is anticipated to propel the myopia and presbyopia treatment market trends in the coming years.

Don't pay for what you don't need

Customize your report by selecting specific countries or regions and save 30%!

What are the Major Driving Factors for the Myopia and Presbyopia Treatment Market?

“On account of modern day breakthroughs in ocular lenses, it is anticipated the emerging trends in myopia and presbyopia treatment services would be instrumental in popularizing the market.”

Internationally, there is a huge surge in the need for treatment choices including contact, concave, or prescription lenses that is anticipated to strengthen the global demand for myopia and presbyopia treatment facilities. The healthcare sector of various nations are also concentrating on enhancing patient flow, and as a result, they are also thinking about expanding the number of myopia and presbyopia treatment clinics.

Amongst the most cutting-edge methods for treating presbyopia is presbyLASIK OR multifocal LASIK that is anticipated to steer the myopia and presbyopia treatment market future trends ahead. However, despite the convenience of modern day LASIK surgeries, the myopia and presbyopia treatment market opportunities is also expected to strengthen for patients experiencing dry eyes condition.

What are the Existing Challenges for the Myopia and Presbyopia Treatment Market future Trends?

Untreated presbyopia is one of the main issues that will have a significant limiting effect on the global myopia and presbyopia market. Many individuals still don't understand the aetiology of presbyopia, which leads to delayed diagnoses and less adoption of myopia and presbyopia treatment services.

Hardly two corneal inlays have been given approval to treat presbyopia at this time posing as a major restraint for the overall myopia and presbyopia market growth. However, the myopia and presbyopia market key trends and opportunities is anticipated to be aided by an expanding product portfolio and an increase in active innovations in the coming days.

Sabyasachi Ghosh
Sabyasachi Ghosh

Principal Consultant

Talk to Analyst

Find your sweet spots for generating winning opportunities in this market.

Comparative View of Adjacent Myopia and Presbyopia Treatment Market

Myopia and Presbyopia Treatment Market:

Attributes Myopia and Presbyopia Treatment Market
CAGR (2022 to 2032) 8.5%
Market Value (2022) US$ 17.9 Billion
Growth Factor Rising cases of visual impairments among the younger and older age group people alike.
Future Opportunities Improving awareness regarding the delayed treatment to boost the market.
Market Trends Novel innovations in the field of surgical procedures are driving the market.

Eye Health Supplements Market:

Attributes Eye Health Supplements Market
CAGR (2022 to 2032) 6%
Market Value (2022) US$ 1.8 Billion
Growth Factor Rise in the frequency of various age-related eye diseases
Future Opportunities An increase in the choice among older people and millennials prone to digital eye strain and myopia
Market Trends Enthusiastic endorsement by ophthalmologists for the diagnosis and intervention of eye diseases.

Ophthalmic Devices Market:

Attributes Ophthalmic Devices Market
CAGR (2022 to 2032) 5%
Market Value (2022) US$ 5.5 Billion
Growth Factor Rise of optical conditions such as glaucoma, cataracts, and retinopathy.
Future Opportunities Technical development in the tools serving for target applications.
Market Trends Improved government activities to raise awareness of visual impairment.

In the last couple of years, people's eyesight across the world has suffered significant harm as a result of more digital screen exposure. For instance, according to a study report released in July 2021 by the UK-based Feel Good Contacts, Indians endured the worst vision problems in 2020 as a result of increased screen time. Such fateful circumstances have created a huge opportunity for the global myopia and presbyopia treatment market in several other emerging economies too.

Additionally, children aged 6 to 8 showed a significant myopic shift of 0.3 diopters during the last two years, according to the research report published by Progression of Myopia in School-Aged Children after COVID-19 Home Confinement. Any further deterioration of the eyesight conditions among these age group children is anticipated to draw in huge market potential for adoption of myopia and presbyopia treatment services across the globe.

Category-wise Insights for Myopia and Presbyopia Treatment Market

“Over the years of myopia and presbyopia treatment market adoption trends, the typical recovery period for ocular procedures has been drastically shortened, thanks to cutting-edge technological solutions.”

Which is the Top Performing Category for the Myopia Treatment Market Segment?

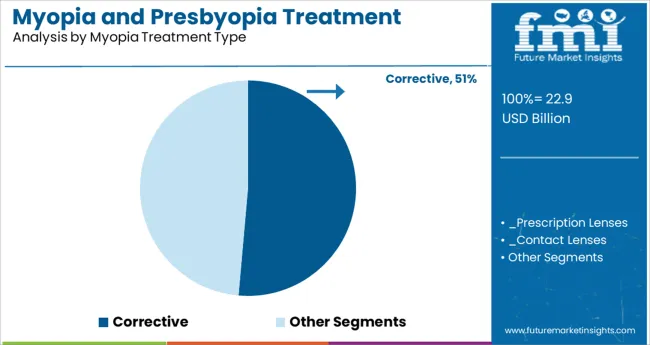
In conformity with the myopia and presbyopia market statistics, the sector with the highest revenue share by the end of year 2021— accounting for more than 30% is the single prescription lenses. Reason being, in recent years myopia treatment is getting more common in emerging nations with the rising need for corrective lenses. The patient base has expanded considerably, which is helping to boost the myopia and presbyopia market size by contribution of the single prescription lenses market segment.

On the other hand, the popularity of the surgical procedures is being influenced by its attributes including minimally invasiveness, precision, and speed. Consequently, encouraging the demand for myopia and presbyopia treatment services for this segment. During the projection period of 2022 to 2032, there will likely be an upward turn in myopia ad presbyopia market trends and forecast owing to increasing popularity of surgery segment with the readily available cutting-edge equipment and dropping service prices.

Which is the Top Performing Category for the Presbyopia Treatment Market Segment?

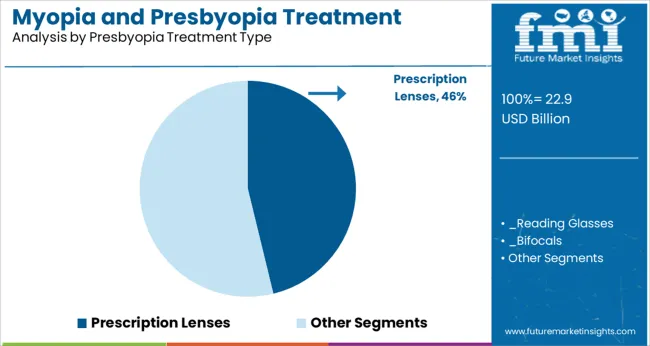
On the report of myopia and presbyopia treatment market survey until 2021, the most significant revenue share—more than 25%—was captured by prescription lenses segment. Additionally, bifocal, multifocal, monovision, and modified monovision contact lenses fall within these categories constituting the sub-segments covered by this myopia and presbyopia market analysis report.

Presbyopia can be effectively treated using conductive keratoplasty surgery, LASIK, LASEK, and PRK, among other refractive surgical techniques that have started contributing to the myopia and presbyopia market growth remarkably in recent times. The surgical procedure segment or LASIK is extensively used to cure presbyopia in high income countries.

Therefore, it is anticipated that the rapid spread of these presbyopia treatment options and growing preference for LASIK surgery would promote the all-inclusive myopia and presbyopia treatment business throughout the course of the projection period.

All things considered, due to the rising popularity of correcting presbyopia, the progressive multifocal section is anticipated to see the quickest growth over the course of the projected period. Additionally, throughout the forecast period, multifocal sub segments including those with photochromic lenses and anti-reflexive coatings are anticipated to drive the overarching myopia and presbyopia market growth
Get the data you need at a Fraction of the cost

Personalize your report by choosing insights you need
and save 40%!

Regional Analysis of the Myopia and Presbyopia Treatment Market

How Myopia and Presbyopia Treatment Market Share is performing in North America?

Owing to the accessibility of cutting-edge technologies for managing the various targeted myopia treatment types, as well as the presence of numerous market players, North America holds the leading position in the overall market with a capitalization of over 20.0%. And therefore, this region, particularly US myopia and presbyopia treatment market is anticipated to maintain its dominance over the course of the forecast period.

On a similar note, presbyopia affects around 128 Million individuals in the United States only. And one-third of these people come under above 50 years age group bracket.

What is the Performance of Myopia and Presbyopia Treatment Market in Asia Pacific Region?

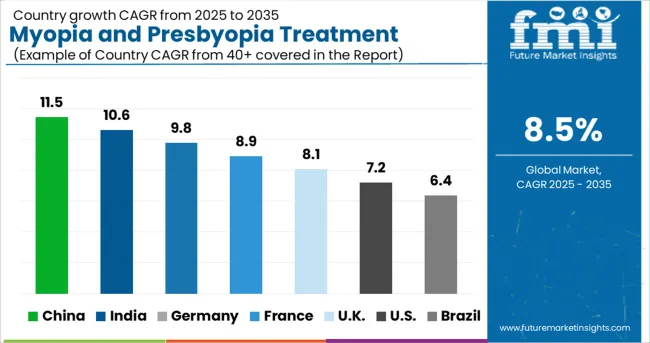
Due to the enlarging senior population count, the high prevalence of myopia-related eye treatments, and the rise in healthcare services, the Asia Pacific region is anticipated to see the sharpest growth in myopia and presbyopia treatment market trends throughout the projected period.

The market for myopia and presbyopia treatments in the regional market is anticipated to be driven by consumers' improving understanding of focused myopia therapy. Additionally, the regions comprising East Asia, South Asia, and Southeast Asia have the highest rates of vision problems that amounts to more than twice as many cases as other areas.
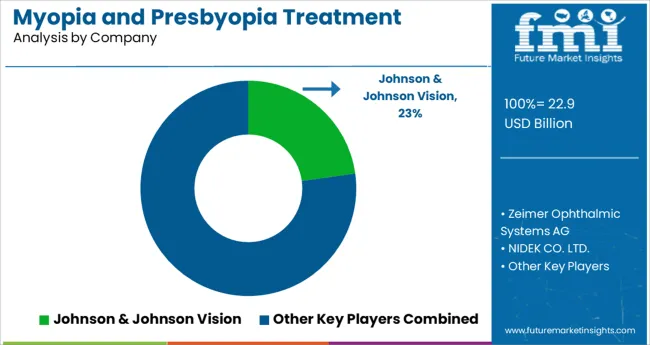
Competitive Landscape for the Myopia and Presbyopia Treatment Market

Myopia and presbyopia treatment market participants are concentrating on implementing growth initiatives, such as improvements to current technology, introduction of effective procedures, and consolidations. Myopia and presbyopia market leaders are also planning for investments in R&D to facilitate early diagnosis and create effective and speedy operating approaches to guarantee field uniqueness and solidify their market position.

Major myopia and presbyopia treatment companies like Johnson & Johnson, Essilor, and Zeimer Ophthalmic Systems AG are increasing their partnerships to create cutting-edge methodologies and therapeutic approaches to deliver better and more effective therapy for myopia and presbyopia patients.

Recent Developments in Global Myopia and Presbyopia Treatment Market

  • For all myopia and presbyopia treatment providers, Essilor introduced a dynamic web app version of the original Essilor Companion in the period of July 2021. This effort delivers an improved in-store digital Essilor marketing strategy while streamlining the digital platform for Essilor's partner companies for getting better their brand recognition.

Global Myopia and Presbyopia Treatment Market Key Players

Myopia and Presbyopia Treatment Market by Segmentation

By Myopia Treatment Type:

  • Corrective
    • Prescription Lenses
      • Single
      • Bifocal
      • Trifocal
      • Others
    • Contact Lenses
  • Surgical
  • Drugs

By Presbyopia Treatment Type:

  • Prescription Lenses
    • Reading Glasses
    • Bifocals
    • Trifocals
    • Progressive Multifocal
    • Office Progressives
  • Contact Lenses
    • Bifocal
    • Multifocal
    • Monovision
    • Modified Monovision
  • Intraocular Lenses
  • Refractive Surgery

By Region:

  • North America
  • Latin America
  • Europe
  • East Asia
  • South Asia
  • Oceania
  • Middle East and Africa

Frequently Asked Questions

At What Rate will the Myopia and Presbyopia Treatment Market Grow?

The myopia and presbyopia treatment market is expected to grow at 8.5% CAGR over 2022-2032.

What is the Net Worth of the Global Myopia and Presbyopia Treatment Market?

The myopia and presbyopia treatment market is estimated to be around US$ 17.9 Billion in 2022.

What is the Projected Value of the Myopia and Presbyopia Treatment Market?

The myopia and presbyopia treatment market is anticipated to reach a valuation of US$ 40.5 Billion by 2032.

Which is the Best Performing Segment of the Myopia and Presbyopia Treatment Market?

The single prescription treatment segments contributes almost 30%.

Which is the Leading Region for the Myopia and Presbyopia Treatment Market?

North America is the most lucrative region for myopia and presbyopia treatment market.

Table of Content

1. Executive Summary

    1.1. Global Market Outlook

    1.2. Demand-side Trends

    1.3. Supply-side Trends

    1.4. Technology Roadmap Analysis

    1.5. Analysis and Recommendations

2. Market Overview

    2.1. Market Coverage / Taxonomy

    2.2. Market Definition / Scope / Limitations

3. Market Background

    3.1. Market Dynamics

        3.1.1. Drivers

        3.1.2. Restraints

        3.1.3. Opportunity 

        3.1.4. Trends

    3.2. Scenario Forecast

        3.2.1. Demand in Optimistic Scenario

        3.2.2. Demand in Likely Scenario

        3.2.3. Demand in Conservative Scenario

    3.3. Opportunity Map Analysis

    3.4. Product Life Cycle Analysis

    3.5. Investment Feasibility Matrix

    3.6. PESTLE and Porter’s Analysis

    3.7. Regulatory Landscape

        3.7.1. By Key Regions

        3.7.2. By Key Countries

    3.8. Regional Parent Market Outlook

4. Global Market Analysis 2017-2021 and Forecast, 2022-2032

    4.1. Historical Market Size Value (US$ Mn) Analysis, 2017-2021

    4.2. Current and Future Market Size Value (US$ Mn) Projections, 2022-2032

        4.2.1. Y-o-Y Growth Trend Analysis

        4.2.2. Absolute $ Opportunity Analysis

5. Global Market Analysis 2017-2021 and Forecast 2022-2032, By Treatment Type

    5.1. Introduction / Key Findings

    5.2. Historical Market Size Value (US$ Mn) Analysis By Treatment Type, 2017-2021

    5.3. Current and Future Market Size Value (US$ Mn) Analysis and Forecast By Treatment Type, 2022-2032

        5.3.1. Myopia

            5.3.1.1. Corrective

                5.3.1.1.1. Prescription Lenses

                    5.3.1.1.1.1. Single

                    5.3.1.1.1.2. Bifocal

                    5.3.1.1.1.3. Trifocal

                    5.3.1.1.1.4. Other Prescription Lenses

                5.3.1.1.2. Contact Lenses

            5.3.1.2. Surgical

            5.3.1.3. Drugs

        5.3.2. Presbyopia

            5.3.2.1. Prescription Lenses

                5.3.2.1.1. Reading Glasses

                5.3.2.1.2. Bifocals

                5.3.2.1.3. Trifocals

                5.3.2.1.4. Progressive Multifocals

                5.3.2.1.5. Office Progressives

            5.3.2.2. Contact Lenses

                5.3.2.2.1. Bifocal

                5.3.2.2.2. Multifocal

                5.3.2.2.3. Monovision

                5.3.2.2.4. Modified Monovision

            5.3.2.3. Intraocular Lenses

            5.3.2.4. Refractive Surgery

    5.4. Y-o-Y Growth Trend Analysis By Treatment Type, 2017-2021

    5.5. Absolute $ Opportunity Analysis By Treatment Type, 2022-2032

6. Global Market Analysis 2017-2021 and Forecast 2022-2032, By Region

    6.1. Introduction

    6.2. Historical Market Size Value (US$ Mn) Analysis By Region, 2017-2021

    6.3. Current Market Size Value (US$ Mn) Analysis and Forecast By Region, 2022-2032

        6.3.1. North America

        6.3.2. Latin America

        6.3.3. Europe

        6.3.4. Asia Pacific

        6.3.5. Middle East and Africa

    6.4. Market Attractiveness Analysis By Region

7. North America Market Analysis 2017-2021 and Forecast 2022-2032, By Country

    7.1. Historical Market Size Value (US$ Mn) Trend Analysis By Market Taxonomy, 2017-2021

    7.2. Market Size Value (US$ Mn) Forecast By Market Taxonomy, 2022-2032

        7.2.1. By Country

            7.2.1.1. U.S.

            7.2.1.2. Canada

        7.2.2. By Treatment Type

    7.3. Market Attractiveness Analysis

        7.3.1. By Country

        7.3.2. By Treatment Type

    7.4. Key Takeaways

8. Latin America Market Analysis 2017-2021 and Forecast 2022-2032, By Country

    8.1. Historical Market Size Value (US$ Mn) Trend Analysis By Market Taxonomy, 2017-2021

    8.2. Market Size Value (US$ Mn) Forecast By Market Taxonomy, 2022-2032

        8.2.1. By Country

            8.2.1.1. Brazil

            8.2.1.2. Mexico

            8.2.1.3. Rest of Latin America

        8.2.2. By Treatment Type

    8.3. Market Attractiveness Analysis

        8.3.1. By Country

        8.3.2. By Treatment Type

    8.4. Key Takeaways

9. Europe Market Analysis 2017-2021 and Forecast 2022-2032, By Country

    9.1. Historical Market Size Value (US$ Mn) Trend Analysis By Market Taxonomy, 2017-2021

    9.2. Market Size Value (US$ Mn) Forecast By Market Taxonomy, 2022-2032

        9.2.1. By Country

            9.2.1.1. Germany

            9.2.1.2. U.K.

            9.2.1.3. France

            9.2.1.4. Spain

            9.2.1.5. Italy

            9.2.1.6. Russia

            9.2.1.7. Rest of Europe

        9.2.2. By Treatment Type

    9.3. Market Attractiveness Analysis

        9.3.1. By Country

        9.3.2. By Treatment Type

    9.4. Key Takeaways

10. Asia Pacific Market Analysis 2017-2021 and Forecast 2022-2032, By Country

    10.1. Historical Market Size Value (US$ Mn) Trend Analysis By Market Taxonomy, 2017-2021

    10.2. Market Size Value (US$ Mn) Forecast By Market Taxonomy, 2022-2032

        10.2.1. By Country

            10.2.1.1. China

            10.2.1.2. Japan

            10.2.1.3. India

            10.2.1.4. South Korea

            10.2.1.5. Australia

            10.2.1.6. Rest of APAC

        10.2.2. By Treatment Type

    10.3. Market Attractiveness Analysis

        10.3.1. By Country

        10.3.2. By Treatment Type

    10.4. Key Takeaways

11. Middle East and Africa Market Analysis 2017-2021 and Forecast 2022-2032, By Country

    11.1. Historical Market Size Value (US$ Mn) Trend Analysis By Market Taxonomy, 2017-2021

    11.2. Market Size Value (US$ Mn) Forecast By Market Taxonomy, 2022-2032

        11.2.1. By Country

            11.2.1.1. South Africa

            11.2.1.2. Saudi Arabia

            11.2.1.3. UAE

            11.2.1.4. Israel

            11.2.1.5. Rest of MEA

        11.2.2. By Treatment Type

    11.3. Market Attractiveness Analysis

        11.3.1. By Country

        11.3.2. By Treatment Type

    11.4. Key Takeaways

12. Key Countries Market Analysis

    12.1. U.S.

        12.1.1. Pricing Analysis

        12.1.2. Market Share Analysis, 2021

            12.1.2.1. By Treatment Type

    12.2. Canada

        12.2.1. Pricing Analysis

        12.2.2. Market Share Analysis, 2021

            12.2.2.1. By Treatment Type

    12.3. Brazil

        12.3.1. Pricing Analysis

        12.3.2. Market Share Analysis, 2021

            12.3.2.1. By Treatment Type

    12.4. Mexico

        12.4.1. Pricing Analysis

        12.4.2. Market Share Analysis, 2021

            12.4.2.1. By Treatment Type

    12.5. Germany

        12.5.1. Pricing Analysis

        12.5.2. Market Share Analysis, 2021

            12.5.2.1. By Treatment Type

    12.6. U.K.

        12.6.1. Pricing Analysis

        12.6.2. Market Share Analysis, 2021

            12.6.2.1. By Treatment Type

    12.7. France

        12.7.1. Pricing Analysis

        12.7.2. Market Share Analysis, 2021

            12.7.2.1. By Treatment Type

    12.8. Spain

        12.8.1. Pricing Analysis

        12.8.2. Market Share Analysis, 2021

            12.8.2.1. By Treatment Type

    12.9. Italy

        12.9.1. Pricing Analysis

        12.9.2. Market Share Analysis, 2021

            12.9.2.1. By Treatment Type

    12.10. Russia

        12.10.1. Pricing Analysis

        12.10.2. Market Share Analysis, 2021

            12.10.2.1. By Treatment Type

    12.11. China

        12.11.1. Pricing Analysis

        12.11.2. Market Share Analysis, 2021

            12.11.2.1. By Treatment Type

    12.12. Japan

        12.12.1. Pricing Analysis

        12.12.2. Market Share Analysis, 2021

            12.12.2.1. By Treatment Type

    12.13. India

        12.13.1. Pricing Analysis

        12.13.2. Market Share Analysis, 2021

            12.13.2.1. By Treatment Type

    12.14. South Korea

        12.14.1. Pricing Analysis

        12.14.2. Market Share Analysis, 2021

            12.14.2.1. By Treatment Type

    12.15. Australia

        12.15.1. Pricing Analysis

        12.15.2. Market Share Analysis, 2021

            12.15.2.1. By Treatment Type

    12.16. South Africa

        12.16.1. Pricing Analysis

        12.16.2. Market Share Analysis, 2021

            12.16.2.1. By Treatment Type

    12.17. Saudi Arabia

        12.17.1. Pricing Analysis

        12.17.2. Market Share Analysis, 2021

            12.17.2.1. By Treatment Type

    12.18. UAE

        12.18.1. Pricing Analysis

        12.18.2. Market Share Analysis, 2021

            12.18.2.1. By Treatment Type

    12.19. Israel

        12.19.1. Pricing Analysis

        12.19.2. Market Share Analysis, 2021

            12.19.2.1. By Treatment Type

13. Market Structure Analysis

    13.1. Competition Dashboard

    13.2. Competition Benchmarking

    13.3. Market Share Analysis of Top Players

        13.3.1. By Regional

        13.3.2. By Treatment Type

14. Competition Analysis

    14.1. Competition Deep Dive

        14.1.1. Zeimer Ophthalmic Systems AG

            14.1.1.1. Overview

            14.1.1.2. Product Portfolio

            14.1.1.3. Profitability by Market Segments

            14.1.1.4. Sales Footprint

            14.1.1.5. Strategy Overview

                14.1.1.5.1. Marketing Strategy

        14.1.2. NIDEK CO. LTD.

            14.1.2.1. Overview

            14.1.2.2. Product Portfolio

            14.1.2.3. Profitability by Market Segments

            14.1.2.4. Sales Footprint

            14.1.2.5. Strategy Overview

                14.1.2.5.1. Marketing Strategy

        14.1.3. Johnson & Johnson Vision

            14.1.3.1. Overview

            14.1.3.2. Product Portfolio

            14.1.3.3. Profitability by Market Segments

            14.1.3.4. Sales Footprint

            14.1.3.5. Strategy Overview

                14.1.3.5.1. Marketing Strategy

        14.1.4. ZEISS International

            14.1.4.1. Overview

            14.1.4.2. Product Portfolio

            14.1.4.3. Profitability by Market Segments

            14.1.4.4. Sales Footprint

            14.1.4.5. Strategy Overview

                14.1.4.5.1. Marketing Strategy

        14.1.5. ALCON VISION LLC

            14.1.5.1. Overview

            14.1.5.2. Product Portfolio

            14.1.5.3. Profitability by Market Segments

            14.1.5.4. Sales Footprint

            14.1.5.5. Strategy Overview

                14.1.5.5.1. Marketing Strategy

        14.1.6. Bausch & Lomb Incorporated

            14.1.6.1. Overview

            14.1.6.2. Product Portfolio

            14.1.6.3. Profitability by Market Segments

            14.1.6.4. Sales Footprint

            14.1.6.5. Strategy Overview

                14.1.6.5.1. Marketing Strategy

        14.1.7. Haag-Streit UK

            14.1.7.1. Overview

            14.1.7.2. Product Portfolio

            14.1.7.3. Profitability by Market Segments

            14.1.7.4. Sales Footprint

            14.1.7.5. Strategy Overview

                14.1.7.5.1. Marketing Strategy

        14.1.8. Topcon Corporation

            14.1.8.1. Overview

            14.1.8.2. Product Portfolio

            14.1.8.3. Profitability by Market Segments

            14.1.8.4. Sales Footprint

            14.1.8.5. Strategy Overview

                14.1.8.5.1. Marketing Strategy

        14.1.9. Essilor Ltd.

            14.1.9.1. Overview

            14.1.9.2. Product Portfolio

            14.1.9.3. Profitability by Market Segments

            14.1.9.4. Sales Footprint

            14.1.9.5. Strategy Overview

                14.1.9.5.1. Marketing Strategy

15. Assumptions & Acronyms Used

16. Research Methodology

Don't pay for what you don't need

Customize your report by selecting specific countries or regions and save 30%!

List of Tables

Table 1: Global Market Value (US$ Mn) Forecast by Region, 2017-2032

Table 2: Global Market Value (US$ Mn) Forecast by Treatment Type, 2017-2032

Table 3: North America Market Value (US$ Mn) Forecast by Country, 2017-2032

Table 4: North America Market Value (US$ Mn) Forecast by Treatment Type, 2017-2032

Table 5: Latin America Market Value (US$ Mn) Forecast by Country, 2017-2032

Table 6: Latin America Market Value (US$ Mn) Forecast by Treatment Type, 2017-2032

Table 7: Europe Market Value (US$ Mn) Forecast by Country, 2017-2032

Table 8: Europe Market Value (US$ Mn) Forecast by Treatment Type, 2017-2032

Table 9: Asia Pacific Market Value (US$ Mn) Forecast by Country, 2017-2032

Table 10: Asia Pacific Market Value (US$ Mn) Forecast by Treatment Type, 2017-2032

Table 11: Middle East and Africa Market Value (US$ Mn) Forecast by Country, 2017-2032

Table 12: Middle East and Africa Market Value (US$ Mn) Forecast by Treatment Type, 2017-2032
Sabyasachi Ghosh
Sabyasachi Ghosh

Principal Consultant

Talk to Analyst

Find your sweet spots for generating winning opportunities in this market.

List of Charts

Figure 1: Global Market Value (US$ Mn) by Treatment Type, 2022-2032

Figure 2: Global Market Value (US$ Mn) by Region, 2022-2032

Figure 3: Global Market Value (US$ Mn) Analysis by Region, 2017-2032

Figure 4: Global Market Value Share (%) and BPS Analysis by Region, 2022-2032

Figure 5: Global Market Y-o-Y Growth (%) Projections by Region, 2022-2032

Figure 6: Global Market Value (US$ Mn) Analysis by Treatment Type, 2017-2032

Figure 7: Global Market Value Share (%) and BPS Analysis by Treatment Type, 2022-2032

Figure 8: Global Market Y-o-Y Growth (%) Projections by Treatment Type, 2022-2032

Figure 9: Global Market Attractiveness by Treatment Type, 2022-2032

Figure 10: Global Market Attractiveness by Region, 2022-2032

Figure 11: North America Market Value (US$ Mn) by Treatment Type, 2022-2032

Figure 12: North America Market Value (US$ Mn) by Country, 2022-2032

Figure 13: North America Market Value (US$ Mn) Analysis by Country, 2017-2032

Figure 14: North America Market Value Share (%) and BPS Analysis by Country, 2022-2032

Figure 15: North America Market Y-o-Y Growth (%) Projections by Country, 2022-2032

Figure 16: North America Market Value (US$ Mn) Analysis by Treatment Type, 2017-2032

Figure 17: North America Market Value Share (%) and BPS Analysis by Treatment Type, 2022-2032

Figure 18: North America Market Y-o-Y Growth (%) Projections by Treatment Type, 2022-2032

Figure 19: North America Market Attractiveness by Treatment Type, 2022-2032

Figure 20: North America Market Attractiveness by Country, 2022-2032

Figure 21: Latin America Market Value (US$ Mn) by Treatment Type, 2022-2032

Figure 22: Latin America Market Value (US$ Mn) by Country, 2022-2032

Figure 23: Latin America Market Value (US$ Mn) Analysis by Country, 2017-2032

Figure 24: Latin America Market Value Share (%) and BPS Analysis by Country, 2022-2032

Figure 25: Latin America Market Y-o-Y Growth (%) Projections by Country, 2022-2032

Figure 26: Latin America Market Value (US$ Mn) Analysis by Treatment Type, 2017-2032

Figure 27: Latin America Market Value Share (%) and BPS Analysis by Treatment Type, 2022-2032

Figure 28: Latin America Market Y-o-Y Growth (%) Projections by Treatment Type, 2022-2032

Figure 29: Latin America Market Attractiveness by Treatment Type, 2022-2032

Figure 30: Latin America Market Attractiveness by Country, 2022-2032

Figure 31: Europe Market Value (US$ Mn) by Treatment Type, 2022-2032

Figure 32: Europe Market Value (US$ Mn) by Country, 2022-2032

Figure 33: Europe Market Value (US$ Mn) Analysis by Country, 2017-2032

Figure 34: Europe Market Value Share (%) and BPS Analysis by Country, 2022-2032

Figure 35: Europe Market Y-o-Y Growth (%) Projections by Country, 2022-2032

Figure 36: Europe Market Value (US$ Mn) Analysis by Treatment Type, 2017-2032

Figure 37: Europe Market Value Share (%) and BPS Analysis by Treatment Type, 2022-2032

Figure 38: Europe Market Y-o-Y Growth (%) Projections by Treatment Type, 2022-2032

Figure 39: Europe Market Attractiveness by Treatment Type, 2022-2032

Figure 40: Europe Market Attractiveness by Country, 2022-2032

Figure 41: Asia Pacific Market Value (US$ Mn) by Treatment Type, 2022-2032

Figure 42: Asia Pacific Market Value (US$ Mn) by Country, 2022-2032

Figure 43: Asia Pacific Market Value (US$ Mn) Analysis by Country, 2017-2032

Figure 44: Asia Pacific Market Value Share (%) and BPS Analysis by Country, 2022-2032

Figure 45: Asia Pacific Market Y-o-Y Growth (%) Projections by Country, 2022-2032

Figure 46: Asia Pacific Market Value (US$ Mn) Analysis by Treatment Type, 2017-2032

Figure 47: Asia Pacific Market Value Share (%) and BPS Analysis by Treatment Type, 2022-2032

Figure 48: Asia Pacific Market Y-o-Y Growth (%) Projections by Treatment Type, 2022-2032

Figure 49: Asia Pacific Market Attractiveness by Treatment Type, 2022-2032

Figure 50: Asia Pacific Market Attractiveness by Country, 2022-2032

Figure 51: Middle East and Africa Market Value (US$ Mn) by Treatment Type, 2022-2032

Figure 52: Middle East and Africa Market Value (US$ Mn) by Country, 2022-2032

Figure 53: Middle East and Africa Market Value (US$ Mn) Analysis by Country, 2017-2032

Figure 54: Middle East and Africa Market Value Share (%) and BPS Analysis by Country, 2022-2032

Figure 55: Middle East and Africa Market Y-o-Y Growth (%) Projections by Country, 2022-2032

Figure 56: Middle East and Africa Market Value (US$ Mn) Analysis by Treatment Type, 2017-2032

Figure 57: Middle East and Africa Market Value Share (%) and BPS Analysis by Treatment Type, 2022-2032

Figure 58: Middle East and Africa Market Y-o-Y Growth (%) Projections by Treatment Type, 2022-2032

Figure 59: Middle East and Africa Market Attractiveness by Treatment Type, 2022-2032

Figure 60: Middle East and Africa Market Attractiveness by Country, 2022-2032

Recommendations

Healthcare

Amblyopia Treatment Market

Published : July 2023

Explore Healthcare Insights

View Reports

Myopia and Presbyopia Treatment Market