Near-Eye Display Market Size and Share Forecast Outlook 2025 to 2035

The near-eye display market is estimated to be valued at USD 3.8 billion in 2025 and is projected to reach USD 32.0 billion by 2035, registering a compound annual growth rate (CAGR) of 23.6% over the forecast period.

The near-eye display market is valued at USD 3.8 billion in 2025 and is expected to reach USD 32.0 billion by 2035, with a CAGR of 23.6%. From 2021 to 2025, the market grows gradually from USD 1.3 billion to USD 3.8 billion, progressing from USD 1.6 billion, 2.0 billion, 2.5 billion, and 3.1 billion. This phase reflects early adoption in niche applications such as augmented reality (AR), virtual reality (VR), and wearable tech. The inflection point occurs around 2025, when the market sees a significant acceleration, driven by advancements in display technology and increasing demand from industries like gaming, healthcare, and automotive.

From 2026 to 2030, the market experiences a steep upward curve, growing from USD 3.8 billion to USD 13.7 billion. Values progress from USD 4.8 billion to USD 5.9 billion, 7.3 billion, 9.0 billion, and 11.1 billion as near-eye displays become more mainstream in consumer electronics, with applications expanding into immersive media and professional tools.

Between 2031 and 2035, the market reaches USD 32.0 billion, with intermediate values passing through USD 17.0 billion, 21.0 billion, 25.9 billion, and 32.0 billion. This phase sees rapid adoption and scaling across various sectors, with near-eye displays becoming a dominant technology in industries like entertainment, education, and telecommunications, solidifying its position as a key growth driver in the tech landscape.
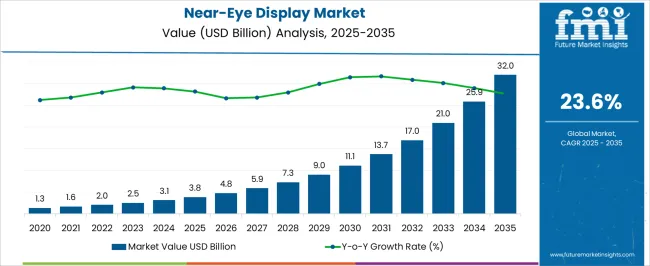
Quick Stats for Near-Eye Display Market

  • Near-Eye Display Market Value (2025): USD 3.8 billion
  • Near-Eye Display Market Forecast Value (2035): USD 32.0 billion
  • Near-Eye Display Market Forecast CAGR: 23.6%
  • Leading Segment in Near-Eye Display Market in 2025: Organic Light-emitting Diode on Silicon (OLEDOS) (28.6%)
  • Key Growth Regions in Near-Eye Display Market: North America, Asia-Pacific, Europe
  • Top Players in Near-Eye Display Market: Sony Group Corporation, Himax Technologies, Inc., Kopin Corporation, eMagin Corporation, MicroOLED Technologies, BOE Technology Group Co., Ltd., Syndiant, Inc.

Near Eye Display Market Market Value Analysis

Near-Eye Display Market Key Takeaways

Metric Value
Near-Eye Display Market Estimated Value in (2025 E) USD 3.8 billion
Near-Eye Display Market Forecast Value in (2035 F) USD 32.0 billion
Forecast CAGR (2025 to 2035) 23.6%

The display technology market is a major contributor, accounting for around 30-35%, as near-eye displays, including head-mounted displays (HMDs) and augmented reality (AR) glasses, are based on advancements in display technology, offering high-quality, immersive experiences. The consumer electronics market plays a significant role, contributing approximately 25-30%, driven by the increasing demand for immersive experiences in entertainment, gaming, and media, with near-eye displays being integral to VR headsets and AR glasses. The augmented and virtual reality market is another key driver, contributing about 20-25%, as near-eye displays are essential for providing the visual interface in AR and VR systems, enhancing gaming, training, healthcare, and education experiences.

The healthcare and medical devices market also contributes around 10-12%, as near-eye displays are used in medical applications such as surgery assistance, rehabilitation, and therapeutic exercises, improving visualization and supporting healthcare professionals. Finally, the automotive industry market contributes approximately 8-10%, as near-eye displays are being integrated into vehicles for heads-up displays (HUDs), driver assistance systems, and in-car entertainment, enhancing both driver safety and experience. These parent markets collectively demonstrate the growing demand for near-eye display technology in consumer electronics, AR/VR systems, healthcare, and automotive applications.

Why is the Near-Eye Display Market Growing?

The near-eye display market is experiencing accelerated growth, driven by rising demand for immersive visual technologies across augmented reality, virtual reality, and mixed reality applications. Increasing deployment of wearable headsets in sectors such as healthcare, education, industrial design, and consumer electronics is elevating the need for lightweight, high-resolution displays capable of delivering natural visual experiences. Continuous improvements in microdisplay technologies, optical waveguides, and low-latency rendering engines are enhancing image clarity and field of view.

Investments from technology leaders and startup ecosystems are further advancing near-eye display capabilities, making devices more compact, energy-efficient, and visually compelling. Growth in spatial computing and enterprise-grade virtual collaboration platforms is expanding use cases beyond entertainment and gaming.

Governments and commercial organizations are supporting innovation through funding and partnerships aimed at accelerating the adoption of smart wearables As component miniaturization, battery efficiency, and optical precision continue to evolve, the near-eye display market is expected to expand rapidly, positioning itself as a critical interface technology for next-generation human-machine interaction across diverse verticals.

Segmental Analysis

The near-eye display market is segmented by technology, components, resolution, application, end use industry, and geographic regions. By technology, near-eye display market is divided into organic light-emitting diode on silicon (OLEDOS), thin-film transistor (TFT) LCD, active-matrix organic light-emitting diode (AMOLED), liquid crystal on silicon (LCoS), microscopic light-emitting diode (MicroLED), digital light processing (DLP), and laser beam scanning. In terms of components, near-eye display market is classified into image generators, optical combiners, and imaging optics. Based on resolution, near-eye display market is segmented into high resolution (1080p to 4K), low resolution (Below 1080p), and ultra-high resolution (Above 4K). By application, near-eye display market is segmented into head-mounted displays (HMDs), heads-up displays (HUDs), and smart glasses. By end use industry, near-eye display market is segmented into consumer electronics, healthcare, automotive, aerospace & defense, education, industrial & manufacturing, sports & entertainment, and others. Regionally, the near-eye display industry is classified into North America, Latin America, Western Europe, Eastern Europe, Balkan & Baltic Countries, Russia & Belarus, Central Asia, East Asia, South Asia & Pacific, and the Middle East & Africa.
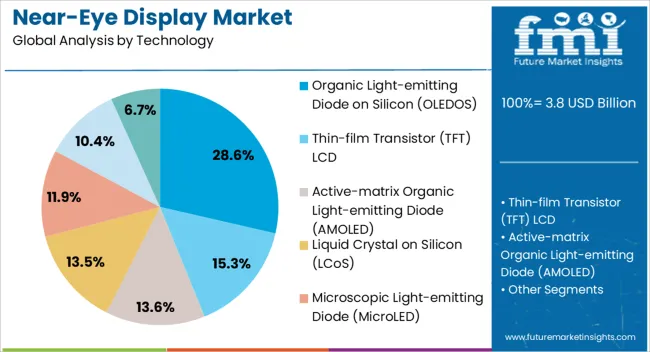
Insights into the Organic Light-emitting Diode on Silicon (OLEDOS) Technology Segment

Near Eye Display Market Analysis By Technology

The organic light-emitting diode on silicon segment is projected to hold 28.6% of the near-eye display market revenue share in 2025, making it the leading technology type. This dominance is being attributed to the ability of OLEDOS to deliver superior brightness, deep contrast, and high-speed response times in a compact form factor suitable for head-mounted displays. The self-emissive nature of OLEDOS allows for high pixel density and reduced power consumption, which are critical for wearables where space and battery life are constrained.

Its compatibility with silicon backplanes enables integration with advanced driver circuits, contributing to smoother frame delivery and reduced visual artifacts. As user experience expectations rise, particularly in gaming, enterprise training, and medical imaging, OLEDOS is being preferred for its ability to render lifelike visuals and reduce eye strain.

Manufacturing scalability and improved yields are also enhancing commercial viability, encouraging adoption across device categories With growing investment in OLED microdisplay R&D, the segment is positioned to maintain its lead by supporting high-resolution, low-latency, and durable visual solutions for both consumer and industrial-grade near-eye applications.
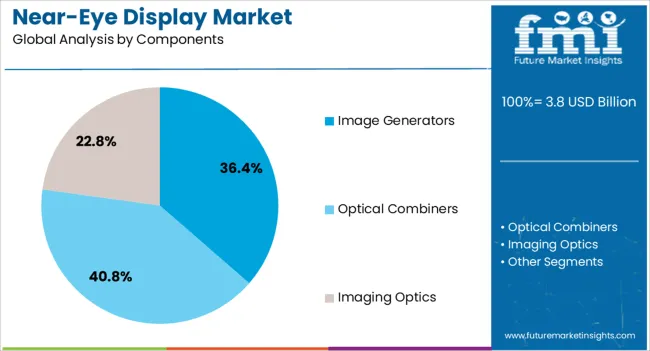
Insights into the Image Generators Component Segment

Near Eye Display Market Analysis By Components

The image generators segment is anticipated to account for 36.4% of the near-eye display market revenue share in 2025, establishing itself as the leading component category. This leadership is being driven by the central role image generators play in processing and rendering visuals that are projected through the optical systems of AR and VR devices. As demand increases for low-latency, high-frame-rate, and high-fidelity images, manufacturers are focusing on improving graphical engines and integrating AI-based enhancements for real-time performance optimization.

Image generators are becoming more compact and power-efficient while supporting complex visual workloads such as 3D modeling, object tracking, and contextual overlays. Their adaptability with emerging display technologies, including OLEDOS and microLED, is contributing to their widespread adoption in head-mounted displays.

Increased investment in silicon photonics and chip-level integration is allowing for better thermal management and enhanced processing capabilities The segment is expected to benefit from the growing deployment of near-eye systems in enterprise settings, where high-quality visual rendering is crucial for training, simulation, and field operations.
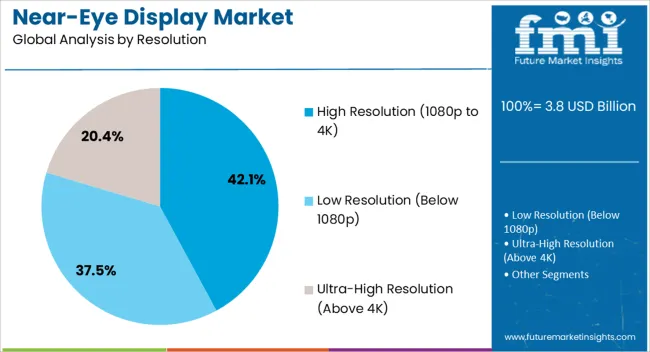
Insights into the High Resolution (1080p to 4K) Segment

Near Eye Display Market Analysis By Resolution

The high resolution category, defined as 1080p to 4K, is expected to capture 42.1% of the near-eye display market revenue share in 2025, positioning it as the dominant resolution segment. This preference is being fueled by increasing consumer and enterprise expectations for visual clarity, realism, and immersion in wearable displays. High-resolution near-eye systems are essential for reducing the screen-door effect and providing detailed visuals required in design, simulation, and entertainment environments.

The segment’s growth is being supported by technological advancements that allow high pixel density displays to be manufactured in smaller, lighter, and more power-efficient formats. Headset manufacturers are leveraging this resolution range to deliver enhanced experiences across AR and VR platforms, where fine detail and edge sharpness are critical.

The ability of 1080p to 4K displays to support wider fields of view and superior color depth is further reinforcing demand As content ecosystems evolve and next-generation applications demand more visual precision, this resolution category is expected to remain the preferred choice across both professional-grade and consumer-level near-eye display systems.

What are the Drivers, Restraints, and Key Trends of the Near-Eye Display Market?

The near-eye display market is witnessing rapid growth driven by the increasing adoption of augmented reality (AR), virtual reality (VR), and mixed reality (MR) technologies across a variety of industries, including gaming, healthcare, automotive, and industrial applications. These displays are crucial for providing immersive experiences by delivering high-resolution, compact, and lightweight visual output directly in the user's field of view. As AR and VR applications continue to expand, the demand for near-eye displays that offer superior image quality, lower latency, and enhanced user comfort is intensifying.

Challenges include high production costs, the need for miniaturization, and the development of technologies that address user comfort, such as reducing eye strain and improving field-of-view. Opportunities lie in the growing interest in wearable technology, such as smart glasses and head-mounted displays, and in the development of more affordable and energy-efficient near-eye display solutions. Trends indicate a move toward integration with 5G, AI, and IoT for more connected, interactive experiences, driving the evolution of the market.

Rising Demand for Immersive Experiences in AR, VR, and Wearables

The near-eye display market is experiencing significant growth due to the increasing demand for immersive AR, VR, and wearable experiences. As industries like gaming, healthcare, and education explore the potential of AR and VR for training, entertainment, and medical applications, near-eye displays are becoming a core component of these technologies. These displays, often integrated into wearable devices such as smart glasses or headsets, provide users with an enhanced visual experience by placing images directly in their line of sight. The rise in demand for wearables, especially in the context of fitness and navigation, is further accelerating the adoption of near-eye displays. Additionally, the expansion of AR in retail, automotive, and industrial sectors for real-time data visualization and enhanced user interfaces is driving market growth.

Costs, Supply, Regulatory, and Technical Constraints

The near-eye display market faces several challenges related to high production costs, complex manufacturing processes, and the need for miniaturization. The development of high-quality, compact, and lightweight near-eye displays often requires the use of advanced technologies such as microdisplays and optical lenses, which can drive up the price of the final product. Additionally, ensuring compatibility across a wide range of devices and applications adds complexity to the design and development process.

Regulatory constraints, particularly around consumer safety and data privacy in AR and VR applications, also play a significant role in shaping the market. Furthermore, challenges around eye strain, prolonged usage comfort, and field-of-view limitations remain critical concerns for both manufacturers and consumers. Overcoming these technical barriers will be crucial for the widespread adoption of near-eye display technologies.

Opportunities in Smart Glasses, Automotive, and Industrial Applications

Opportunities in the near-eye display market are expanding in the development of smart glasses, automotive, and industrial applications. Smart glasses, which integrate near-eye displays for tasks like navigation, communication, and information overlay, are gaining popularity in both consumer and professional settings. As automotive companies integrate AR and VR technologies into vehicles for enhanced driver assistance and infotainment systems, the demand for near-eye displays is expected to rise.

In industrial applications, near-eye displays are being used for real-time data visualization, training, and remote support, improving productivity and safety. The rise of 5G and edge computing will also enable faster, more efficient processing of AR and VR content, offering further opportunities for near-eye displays to be used in connected devices, smart environments, and immersive experiences.

Trends in Miniaturization, Energy Efficiency, and Connectivity

The near-eye display market is trending toward miniaturization, improved energy efficiency, and enhanced connectivity. As manufacturers strive to create more compact, lightweight, and comfortable wearable devices, there is a growing emphasis on miniaturizing the components of near-eye displays while maintaining high image quality. This trend is also driving innovation in battery technology, with companies developing energy-efficient solutions to extend the runtime of devices like smart glasses and AR headsets.

Additionally, the integration of 5G, AI, and IoT is transforming the near-eye display market by enabling more interactive, responsive, and connected experiences. These technologies allow for faster data processing, lower latency, and real-time communication, making near-eye displays more effective in applications like remote assistance, live training, and immersive entertainment. As connectivity and energy efficiency continue to improve, the adoption of near-eye displays is expected to expand across various industries and consumer segments.
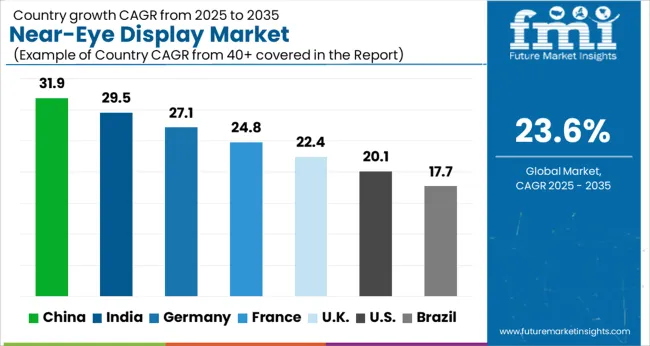
Analysis of Near-Eye Display Market By Key Countries

Near Eye Display Market Cagr Analysis By Country

Country CAGR
China 31.9%
India 29.5%
Germany 27.1%
France 24.8%
UK 22.4%
USA 20.1%
Brazil 17.7%

The global near-eye display market is projected to grow at a CAGR of 23.6% from 2025 to 2035. China leads with a CAGR of 31.9%, followed by India at 29.5% and Germany at 27.1%. The UK and USA show growth rates of 22.4% and 20.1%, respectively. The market is driven by the rising demand for AR, VR, and MR technologies in industries such as gaming, education, healthcare, and automotive. Technological advancements, including improved 5G connectivity, wearable devices, and immersive digital experiences, are further fueling the growth of the near-eye display market. The analysis includes over 40+ countries, with the leading markets detailed below.

Growth Analysis of Near-Eye Display Market in China

The near-eye display market in China is projected to grow at a CAGR of 31.9% from 2025 to 2035. Rapid expansion is fueled by the country’s leadership in technology innovation, especially in the fields of augmented reality (AR), virtual reality (VR), and mixed reality (MR). The growing adoption of AR and VR technologies in gaming, entertainment, healthcare, and education sectors is driving the demand for near-eye displays. Moreover, China’s increasing investments in smart wearable devices and consumer electronics, such as smart glasses and AR headsets, are propelling market growth.

The country’s strong manufacturing base and large consumer market further contribute to the widespread availability and affordability of near-eye display devices. China’s government push for innovation in the digital and technology sectors, coupled with the growing demand for advanced display technologies in industries such as e-commerce and digital marketing, is expected to significantly boost the market.

  • Increased adoption of AR, VR, and MR technologies across various industries
  • Rising consumer demand for wearable devices and smart glasses
  • Government push for technology innovation in digital and electronics sectors

Future Opportunities for Near-Eye Display Market in India

The near-eye display market in India is expected to grow at a CAGR of 29.5% from 2025 to 2035. As a growing tech hub, India is experiencing a rise in the demand for AR and VR technologies, particularly in sectors such as gaming, education, healthcare, and manufacturing. The increasing adoption of smart devices, including smart glasses and AR headsets, is driving market growth. Moreover, India’s burgeoning consumer electronics industry and strong focus on digitalization are expected to propel the market further.

The country’s young population, with a high affinity for new technology, is fueling the demand for immersive experiences offered by near-eye displays. The rise of e-commerce platforms and the increasing accessibility of AR/VR devices are contributing to the market’s expansion. As India continues to invest in digital technologies and smart city initiatives, the demand for advanced near-eye display solutions in various applications is anticipated to increase.
  • Growth of AR/VR technologies in gaming, education, and healthcare
  • Increasing adoption of smart glasses and other wearable devices
  • Rising consumer electronics industry and digitalization efforts

Growth Outlook on Near-Eye Display Market in Germany

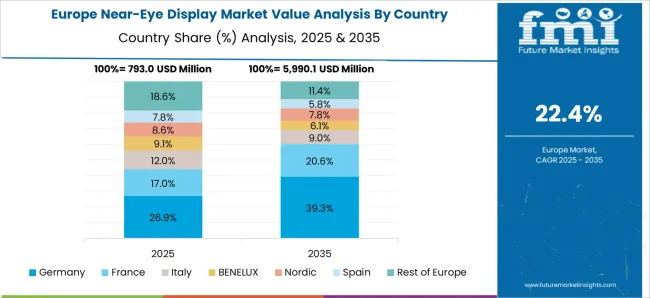
Near Eye Display Market Europe Country Market Share Analysis, 2025 & 2035

The near-eye display market in Germany is projected to expand at a CAGR of 27.1% from 2025 to 2035. As one of the leading countries in technology innovation, Germany’s demand for near-eye displays is driven by advancements in AR, VR, and MR applications, particularly in the automotive, manufacturing, and healthcare sectors. The country’s strong emphasis on Industry 4.0 and automation is fostering the use of immersive technologies in industrial settings, such as training simulations and remote maintenance.

The growing interest in gaming and entertainment applications is further boosting the demand for near-eye display devices. Germany’s thriving tech startup ecosystem and increasing investments in smart electronics and wearables are contributing to market growth. The country’s push towards digitalization, combined with the rise of smart cities and intelligent systems, is expected to fuel the adoption of near-eye displays.

  • Growing use of AR, VR, and MR technologies in industrial and gaming sectors
  • Strong emphasis on Industry 4.0 and automation
  • Increased investments in smart electronics and wearables

Demand Outlook on Near-Eye Display Market in the United Kingdom

The UK’s near-eye display market is expected to grow at a CAGR of 22.4% from 2025 to 2035. As the country increasingly embraces digital transformation, the demand for immersive technologies, including AR and VR, is rising in sectors such as education, healthcare, and entertainment. The UK is witnessing increased adoption of smart glasses, AR headsets, and other wearable devices for professional and consumer applications.

The market’s growth is also supported by the country’s thriving gaming industry and the rise of VR-based experiences. Additionally, the UK’s focus on technological innovation and the ongoing advancements in 5G connectivity are expected to drive the demand for high-performance near-eye display solutions. The use of AR and VR in industries like real estate and retail for virtual tours and product experiences is also propelling market growth.
  • Increasing demand from education, healthcare, and entertainment sectors
  • Growth of the gaming industry and VR-based experiences
  • Advancements in 5G and technological innovation driving near-eye display adoption

Trends Analysis of Near-Eye Display Market in the United States

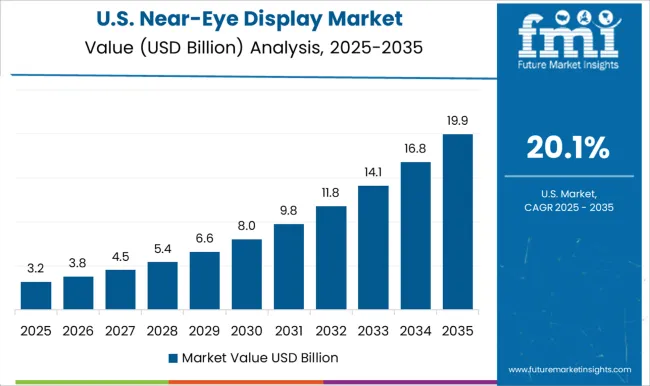
Near Eye Display Market Country Value Analysis

The USA near-eye display market is projected to grow at a CAGR of 20.1% from 2025 to 2035. As a global leader in technology and innovation, the USA is seeing significant growth in the adoption of AR and VR devices in sectors such as healthcare, education, and retail. The USA has a well-established gaming industry, which is a major contributor to the growing demand for immersive technologies, including near-eye displays. The increasing use of AR/VR in training, simulation, and medical applications is also driving market expansion.

Moreover, the USA is witnessing a rise in consumer interest in wearable devices such as smart glasses and AR headsets. With advancements in 5G and improvements in battery technology, the demand for lightweight, efficient, and high-performance near-eye display devices is expected to rise. The market is further supported by the country’s strong venture capital ecosystem, which is fueling innovation in the AR/VR space.
  • Rising adoption of AR/VR in healthcare, education, and retail
  • Growth in gaming and immersive entertainment experiences
  • Technological advancements in 5G, battery tech, and wearable devices

Competitive Landscape of Near-Eye Display Market

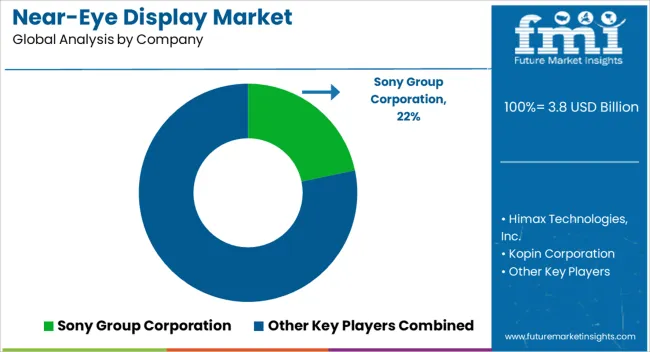
Near Eye Display Market Analysis By Company

The near-eye display market is highly competitive, driven by advancements in augmented reality (AR), virtual reality (VR), and wearable technologies. Sony Group Corporation is a major player, offering high-performance near-eye displays that cater to both consumer electronics and industrial applications. Sony’s near-eye displays are widely used in VR headsets and smart glasses, with a focus on delivering high-resolution visuals, compact designs, and superior color accuracy. Himax Technologies, Inc. competes by providing innovative microdisplay solutions, particularly for AR glasses and wearable devices. The company’s displays are known for their power efficiency, low heat generation, and high pixel density, which are crucial for providing clear visuals in compact, lightweight devices.

Kopin Corporation is a prominent competitor, offering advanced near-eye display solutions designed for AR and VR applications, particularly in the industrial and military sectors. Kopin’s displays feature high brightness, low power consumption, and a wide field of view, making them ideal for both consumer and professional-grade devices. eMagin Corporation focuses on providing OLED-based near-eye displays for VR and AR devices, offering superior contrast, color richness, and fast response times. Their displays are widely used in head-mounted displays (HMDs) and tactical systems, with a focus on immersive, high-quality visuals. MicroOLED Technologies specializes in OLED microdisplays, providing compact and high-resolution near-eye solutions for applications such as smart glasses, medical devices, and surveillance systems.

BOE Technology Group Co., Ltd. competes by offering high-resolution microdisplays for a wide range of AR and VR applications, with a focus on scalability and cost-effectiveness. Syndiant, Inc. is another strong competitor, providing LCoS-based microdisplays for AR and VR headsets, known for their excellent image quality and low power consumption. Product brochures from these companies highlight key features such as high-resolution visuals, low power consumption, lightweight designs, and superior color accuracy. Competitive strategies focus on integrating advanced technologies like OLED and microLED for enhanced user experiences, while meeting the growing demand for compact, wearable, and immersive near-eye displays across consumer and industrial markets.

Key Players in the Near-Eye Display Market

  • Sony Group Corporation
  • Himax Technologies, Inc.
  • Kopin Corporation
  • eMagin Corporation
  • MicroOLED Technologies
  • BOE Technology Group Co., Ltd.
  • Syndiant, Inc.

Scope of the Report

Item Value
Quantitative Units USD 3.8 billion
Technology Organic Light-emitting Diode on Silicon (OLEDOS), Thin-film Transistor (TFT) LCD, Active-matrix Organic Light-emitting Diode (AMOLED), Liquid Crystal on Silicon (LCoS), Microscopic Light-emitting Diode (MicroLED), Digital Light Processing (DLP), and Laser Beam Scanning
Components Image Generators, Optical Combiners, and Imaging Optics
Resolution High Resolution (1080p to 4K), Low Resolution (Below 1080p), and Ultra-High Resolution (Above 4K)
Application Head-Mounted Displays (HMDs), Heads-Up Displays (HUDs), and Smart Glasses
End Use Industry Consumer Electronics, Healthcare, Automotive, Aerospace & Defense, Education, Industrial & Manufacturing, Sports & Entertainment, and Others
Regions Covered North America, Europe, Asia-Pacific, Latin America, Middle East & Africa
Country Covered United States, Canada, Germany, France, United Kingdom, China, Japan, India, Brazil, South Africa
Key Companies Profiled Sony Group Corporation, Himax Technologies, Inc., Kopin Corporation, eMagin Corporation, MicroOLED Technologies, BOE Technology Group Co., Ltd., and Syndiant, Inc.
Additional Attributes Dollar sales by display technology type (OLED, LCD, microLED, DLP), application (AR, VR, wearable devices, automotive), and end-use industry (gaming, healthcare, industrial, military). Demand dynamics are driven by the increasing adoption of AR/VR devices in gaming, healthcare, training, and manufacturing sectors. Regional trends show strong growth in North America, Europe, and Asia-Pacific, with advancements in consumer electronics, industrial applications, and entertainment driving demand for high-quality, lightweight near-eye displays.

Near-Eye Display Market by Segments

Technology:

  • Organic Light-emitting Diode on Silicon (OLEDOS)
  • Thin-film Transistor (TFT) LCD
  • Active-matrix Organic Light-emitting Diode (AMOLED)
  • Liquid Crystal on Silicon (LCoS)
  • Microscopic Light-emitting Diode (MicroLED)
  • Digital Light Processing (DLP)
  • Laser Beam Scanning

Components:

  • Image Generators
  • Optical Combiners
  • Imaging Optics

Resolution:

  • High Resolution (1080p to 4K)
  • Low Resolution (Below 1080p)
  • Ultra-High Resolution (Above 4K)

Application:

  • Head-Mounted Displays (HMDs)
  • Heads-Up Displays (HUDs)
  • Smart Glasses

End Use Industry:

  • Consumer Electronics
  • Healthcare
  • Automotive
  • Aerospace & Defense
  • Education
  • Industrial & Manufacturing
  • Sports & Entertainment
  • Others

Region:

  • North America
    • USA
    • Canada
    • Mexico
  • Latin America
    • Brazil
    • Chile
    • Rest of Latin America
  • Western Europe
    • Germany
    • UK
    • Italy
    • Spain
    • France
    • Nordic
    • BENELUX
    • Rest of Western Europe
  • Eastern Europe
    • Russia
    • Poland
    • Hungary
    • Balkan & Baltic
    • Rest of Eastern Europe
  • East Asia
    • China
    • Japan
    • South Korea
  • South Asia and Pacific
    • India
    • ASEAN
    • Australia & New Zealand
    • Rest of South Asia and Pacific
  • Middle East & Africa
    • Kingdom of Saudi Arabia
    • Other GCC Countries
    • Turkiye
    • South Africa
    • Other African Union
    • Rest of Middle East & Africa

Table of Content

  1. Executive Summary
    • Global Market Outlook
    • Demand-side Trends
    • Supply-side Trends
    • Technology Roadmap Analysis
    • Analysis and Recommendations
  2. Market Overview
    • Market Coverage / Taxonomy
    • Market Definition / Scope / Limitations
  3. Market Background
    • Market Dynamics
      • Drivers
      • Restraints
      • Opportunity
      • Trends
    • Scenario Forecast
      • Demand in Optimistic Scenario
      • Demand in Likely Scenario
      • Demand in Conservative Scenario
    • Opportunity Map Analysis
    • Product Life Cycle Analysis
    • Supply Chain Analysis
    • Investment Feasibility Matrix
    • Value Chain Analysis
    • PESTLE and Porter’s Analysis
    • Regulatory Landscape
    • Regional Parent Market Outlook
    • Production and Consumption Statistics
    • Import and Export Statistics
  4. Global Near-Eye Display Market Analysis 2020-2024 and Forecast, 2025-2035
    • Historical Market Size Value (USD Mn) Analysis, 2020-2024
    • Current and Future Market Size Value (USD Mn) Projections, 2025-2035
      • Y-o-Y Growth Trend Analysis
      • Absolute $ Opportunity Analysis
  5. Global Near-Eye Display Market Pricing Analysis 2020-2024 and Forecast 2025-2035
  6. Global Near-Eye Display Market Analysis 2020-2024 and Forecast 2025-2035, By Technology
    • Introduction / Key Findings
    • Historical Market Size Value (USD Mn) Analysis By Technology , 2020-2024
    • Current and Future Market Size Value (USD Mn) Analysis and Forecast By Technology , 2025-2035
      • Organic Light-emitting Diode on Silicon (OLEDOS)
      • Thin-film Transistor (TFT) LCD
      • Active-matrix Organic Light-emitting Diode (AMOLED)
      • Liquid Crystal on Silicon (LCoS)
      • Microscopic Light-emitting Diode (MicroLED)
      • Digital Light Processing (DLP)
      • Laser Beam Scanning
    • Y-o-Y Growth Trend Analysis By Technology , 2020-2024
    • Absolute $ Opportunity Analysis By Technology , 2025-2035
  7. Global Near-Eye Display Market Analysis 2020-2024 and Forecast 2025-2035, By Components
    • Introduction / Key Findings
    • Historical Market Size Value (USD Mn) Analysis By Components, 2020-2024
    • Current and Future Market Size Value (USD Mn) Analysis and Forecast By Components, 2025-2035
      • Image Generators
      • Optical Combiners
      • Imaging Optics
    • Y-o-Y Growth Trend Analysis By Components, 2020-2024
    • Absolute $ Opportunity Analysis By Components, 2025-2035
  8. Global Near-Eye Display Market Analysis 2020-2024 and Forecast 2025-2035, By Resolution
    • Introduction / Key Findings
    • Historical Market Size Value (USD Mn) Analysis By Resolution, 2020-2024
    • Current and Future Market Size Value (USD Mn) Analysis and Forecast By Resolution, 2025-2035
      • High Resolution (1080p to 4K)
      • Low Resolution (Below 1080p)
      • Ultra-High Resolution (Above 4K)
    • Y-o-Y Growth Trend Analysis By Resolution, 2020-2024
    • Absolute $ Opportunity Analysis By Resolution, 2025-2035
  9. Global Near-Eye Display Market Analysis 2020-2024 and Forecast 2025-2035, By Application
    • Introduction / Key Findings
    • Historical Market Size Value (USD Mn) Analysis By Application, 2020-2024
    • Current and Future Market Size Value (USD Mn) Analysis and Forecast By Application, 2025-2035
      • Head-Mounted Displays (HMDs)
      • Heads-Up Displays (HUDs)
      • Smart Glasses
    • Y-o-Y Growth Trend Analysis By Application, 2020-2024
    • Absolute $ Opportunity Analysis By Application, 2025-2035
  10. Global Near-Eye Display Market Analysis 2020-2024 and Forecast 2025-2035, By End Use Industry
    • Introduction / Key Findings
    • Historical Market Size Value (USD Mn) Analysis By End Use Industry, 2020-2024
    • Current and Future Market Size Value (USD Mn) Analysis and Forecast By End Use Industry, 2025-2035
      • Consumer Electronics
      • Healthcare
      • Automotive
      • Aerospace & Defense
      • Education
      • Industrial & Manufacturing
      • Sports & Entertainment
      • Others
    • Y-o-Y Growth Trend Analysis By End Use Industry, 2020-2024
    • Absolute $ Opportunity Analysis By End Use Industry, 2025-2035
  11. Global Near-Eye Display Market Analysis 2020-2024 and Forecast 2025-2035, By Region
    • Introduction
    • Historical Market Size Value (USD Mn) Analysis By Region, 2020-2024
    • Current Market Size Value (USD Mn) Analysis and Forecast By Region, 2025-2035
      • North America
      • Latin America
      • Western Europe
      • Eastern Europe
      • East Asia
      • South Asia and Pacific
      • Middle East & Africa
    • Market Attractiveness Analysis By Region
  12. North America Near-Eye Display Market Analysis 2020-2024 and Forecast 2025-2035, By Country
    • Historical Market Size Value (USD Mn) Trend Analysis By Market Taxonomy, 2020-2024
    • Market Size Value (USD Mn) Forecast By Market Taxonomy, 2025-2035
      • By Country
        • USA
        • Canada
        • Mexico
      • By Technology
      • By Components
      • By Resolution
      • By Application
      • By End Use Industry
    • Market Attractiveness Analysis
      • By Country
      • By Technology
      • By Components
      • By Resolution
      • By Application
      • By End Use Industry
    • Key Takeaways
  13. Latin America Near-Eye Display Market Analysis 2020-2024 and Forecast 2025-2035, By Country
    • Historical Market Size Value (USD Mn) Trend Analysis By Market Taxonomy, 2020-2024
    • Market Size Value (USD Mn) Forecast By Market Taxonomy, 2025-2035
      • By Country
        • Brazil
        • Chile
        • Rest of Latin America
      • By Technology
      • By Components
      • By Resolution
      • By Application
      • By End Use Industry
    • Market Attractiveness Analysis
      • By Country
      • By Technology
      • By Components
      • By Resolution
      • By Application
      • By End Use Industry
    • Key Takeaways
  14. Western Europe Near-Eye Display Market Analysis 2020-2024 and Forecast 2025-2035, By Country
    • Historical Market Size Value (USD Mn) Trend Analysis By Market Taxonomy, 2020-2024
    • Market Size Value (USD Mn) Forecast By Market Taxonomy, 2025-2035
      • By Country
        • Germany
        • UK
        • Italy
        • Spain
        • France
        • Nordic
        • BENELUX
        • Rest of Western Europe
      • By Technology
      • By Components
      • By Resolution
      • By Application
      • By End Use Industry
    • Market Attractiveness Analysis
      • By Country
      • By Technology
      • By Components
      • By Resolution
      • By Application
      • By End Use Industry
    • Key Takeaways
  15. Eastern Europe Near-Eye Display Market Analysis 2020-2024 and Forecast 2025-2035, By Country
    • Historical Market Size Value (USD Mn) Trend Analysis By Market Taxonomy, 2020-2024
    • Market Size Value (USD Mn) Forecast By Market Taxonomy, 2025-2035
      • By Country
        • Russia
        • Poland
        • Hungary
        • Balkan & Baltic
        • Rest of Eastern Europe
      • By Technology
      • By Components
      • By Resolution
      • By Application
      • By End Use Industry
    • Market Attractiveness Analysis
      • By Country
      • By Technology
      • By Components
      • By Resolution
      • By Application
      • By End Use Industry
    • Key Takeaways
  16. East Asia Near-Eye Display Market Analysis 2020-2024 and Forecast 2025-2035, By Country
    • Historical Market Size Value (USD Mn) Trend Analysis By Market Taxonomy, 2020-2024
    • Market Size Value (USD Mn) Forecast By Market Taxonomy, 2025-2035
      • By Country
        • China
        • Japan
        • South Korea
      • By Technology
      • By Components
      • By Resolution
      • By Application
      • By End Use Industry
    • Market Attractiveness Analysis
      • By Country
      • By Technology
      • By Components
      • By Resolution
      • By Application
      • By End Use Industry
    • Key Takeaways
  17. South Asia and Pacific Near-Eye Display Market Analysis 2020-2024 and Forecast 2025-2035, By Country
    • Historical Market Size Value (USD Mn) Trend Analysis By Market Taxonomy, 2020-2024
    • Market Size Value (USD Mn) Forecast By Market Taxonomy, 2025-2035
      • By Country
        • India
        • ASEAN
        • Australia & New Zealand
        • Rest of South Asia and Pacific
      • By Technology
      • By Components
      • By Resolution
      • By Application
      • By End Use Industry
    • Market Attractiveness Analysis
      • By Country
      • By Technology
      • By Components
      • By Resolution
      • By Application
      • By End Use Industry
    • Key Takeaways
  18. Middle East & Africa Near-Eye Display Market Analysis 2020-2024 and Forecast 2025-2035, By Country
    • Historical Market Size Value (USD Mn) Trend Analysis By Market Taxonomy, 2020-2024
    • Market Size Value (USD Mn) Forecast By Market Taxonomy, 2025-2035
      • By Country
        • Kingdom of Saudi Arabia
        • Other GCC Countries
        • Turkiye
        • South Africa
        • Other African Union
        • Rest of Middle East & Africa
      • By Technology
      • By Components
      • By Resolution
      • By Application
      • By End Use Industry
    • Market Attractiveness Analysis
      • By Country
      • By Technology
      • By Components
      • By Resolution
      • By Application
      • By End Use Industry
    • Key Takeaways
  19. Key Countries Near-Eye Display Market Analysis
    • USA
      • Pricing Analysis
      • Market Share Analysis, 2024
        • By Technology
        • By Components
        • By Resolution
        • By Application
        • By End Use Industry
    • Canada
      • Pricing Analysis
      • Market Share Analysis, 2024
        • By Technology
        • By Components
        • By Resolution
        • By Application
        • By End Use Industry
    • Mexico
      • Pricing Analysis
      • Market Share Analysis, 2024
        • By Technology
        • By Components
        • By Resolution
        • By Application
        • By End Use Industry
    • Brazil
      • Pricing Analysis
      • Market Share Analysis, 2024
        • By Technology
        • By Components
        • By Resolution
        • By Application
        • By End Use Industry
    • Chile
      • Pricing Analysis
      • Market Share Analysis, 2024
        • By Technology
        • By Components
        • By Resolution
        • By Application
        • By End Use Industry
    • Germany
      • Pricing Analysis
      • Market Share Analysis, 2024
        • By Technology
        • By Components
        • By Resolution
        • By Application
        • By End Use Industry
    • UK
      • Pricing Analysis
      • Market Share Analysis, 2024
        • By Technology
        • By Components
        • By Resolution
        • By Application
        • By End Use Industry
    • Italy
      • Pricing Analysis
      • Market Share Analysis, 2024
        • By Technology
        • By Components
        • By Resolution
        • By Application
        • By End Use Industry
    • Spain
      • Pricing Analysis
      • Market Share Analysis, 2024
        • By Technology
        • By Components
        • By Resolution
        • By Application
        • By End Use Industry
    • France
      • Pricing Analysis
      • Market Share Analysis, 2024
        • By Technology
        • By Components
        • By Resolution
        • By Application
        • By End Use Industry
    • India
      • Pricing Analysis
      • Market Share Analysis, 2024
        • By Technology
        • By Components
        • By Resolution
        • By Application
        • By End Use Industry
    • ASEAN
      • Pricing Analysis
      • Market Share Analysis, 2024
        • By Technology
        • By Components
        • By Resolution
        • By Application
        • By End Use Industry
    • Australia & New Zealand
      • Pricing Analysis
      • Market Share Analysis, 2024
        • By Technology
        • By Components
        • By Resolution
        • By Application
        • By End Use Industry
    • China
      • Pricing Analysis
      • Market Share Analysis, 2024
        • By Technology
        • By Components
        • By Resolution
        • By Application
        • By End Use Industry
    • Japan
      • Pricing Analysis
      • Market Share Analysis, 2024
        • By Technology
        • By Components
        • By Resolution
        • By Application
        • By End Use Industry
    • South Korea
      • Pricing Analysis
      • Market Share Analysis, 2024
        • By Technology
        • By Components
        • By Resolution
        • By Application
        • By End Use Industry
    • Russia
      • Pricing Analysis
      • Market Share Analysis, 2024
        • By Technology
        • By Components
        • By Resolution
        • By Application
        • By End Use Industry
    • Poland
      • Pricing Analysis
      • Market Share Analysis, 2024
        • By Technology
        • By Components
        • By Resolution
        • By Application
        • By End Use Industry
    • Hungary
      • Pricing Analysis
      • Market Share Analysis, 2024
        • By Technology
        • By Components
        • By Resolution
        • By Application
        • By End Use Industry
    • Kingdom of Saudi Arabia
      • Pricing Analysis
      • Market Share Analysis, 2024
        • By Technology
        • By Components
        • By Resolution
        • By Application
        • By End Use Industry
    • Turkiye
      • Pricing Analysis
      • Market Share Analysis, 2024
        • By Technology
        • By Components
        • By Resolution
        • By Application
        • By End Use Industry
    • South Africa
      • Pricing Analysis
      • Market Share Analysis, 2024
        • By Technology
        • By Components
        • By Resolution
        • By Application
        • By End Use Industry
  20. Market Structure Analysis
    • Competition Dashboard
    • Competition Benchmarking
    • Market Share Analysis of Top Players
      • By Regional
      • By Technology
      • By Components
      • By Resolution
      • By Application
      • By End Use Industry
  21. Competition Analysis
    • Competition Deep Dive
      • Sony Group Corporation
        • Overview
        • Product Portfolio
        • Profitability by Market Segments (Product/Age /Sales Channel/Region)
        • Sales Footprint
        • Strategy Overview
          • Marketing Strategy
          • Product Strategy
          • Channel Strategy
      • Himax Technologies, Inc.
      • Kopin Corporation
      • eMagin Corporation
      • MicroOLED Technologies
      • BOE Technology Group Co., Ltd.
      • Syndiant, Inc.
  22. Assumptions & Acronyms Used
  23. Research Methodology

List of Tables

  • Table 1: Global Near-Eye Display Market Value (USD Mn) Forecast by Region, 2020-2035
  • Table 2: Global Near-Eye Display Market Value (USD Mn) Forecast by Technology , 2020-2035
  • Table 3: Global Near-Eye Display Market Value (USD Mn) Forecast by Components, 2020-2035
  • Table 4: Global Near-Eye Display Market Value (USD Mn) Forecast by Resolution, 2020-2035
  • Table 5: Global Near-Eye Display Market Value (USD Mn) Forecast by Application, 2020-2035
  • Table 6: Global Near-Eye Display Market Value (USD Mn) Forecast by End Use Industry, 2020-2035
  • Table 7: North America Near-Eye Display Market Value (USD Mn) Forecast by Country, 2020-2035
  • Table 8: North America Near-Eye Display Market Value (USD Mn) Forecast by Technology , 2020-2035
  • Table 9: North America Near-Eye Display Market Value (USD Mn) Forecast by Components, 2020-2035
  • Table 10: North America Near-Eye Display Market Value (USD Mn) Forecast by Resolution, 2020-2035
  • Table 11: North America Near-Eye Display Market Value (USD Mn) Forecast by Application, 2020-2035
  • Table 12: North America Near-Eye Display Market Value (USD Mn) Forecast by End Use Industry, 2020-2035
  • Table 13: Latin America Near-Eye Display Market Value (USD Mn) Forecast by Country, 2020-2035
  • Table 14: Latin America Near-Eye Display Market Value (USD Mn) Forecast by Technology , 2020-2035
  • Table 15: Latin America Near-Eye Display Market Value (USD Mn) Forecast by Components, 2020-2035
  • Table 16: Latin America Near-Eye Display Market Value (USD Mn) Forecast by Resolution, 2020-2035
  • Table 17: Latin America Near-Eye Display Market Value (USD Mn) Forecast by Application, 2020-2035
  • Table 18: Latin America Near-Eye Display Market Value (USD Mn) Forecast by End Use Industry, 2020-2035
  • Table 19: Western Europe Near-Eye Display Market Value (USD Mn) Forecast by Country, 2020-2035
  • Table 20: Western Europe Near-Eye Display Market Value (USD Mn) Forecast by Technology , 2020-2035
  • Table 21: Western Europe Near-Eye Display Market Value (USD Mn) Forecast by Components, 2020-2035
  • Table 22: Western Europe Near-Eye Display Market Value (USD Mn) Forecast by Resolution, 2020-2035
  • Table 23: Western Europe Near-Eye Display Market Value (USD Mn) Forecast by Application, 2020-2035
  • Table 24: Western Europe Near-Eye Display Market Value (USD Mn) Forecast by End Use Industry, 2020-2035
  • Table 25: Eastern Europe Near-Eye Display Market Value (USD Mn) Forecast by Country, 2020-2035
  • Table 26: Eastern Europe Near-Eye Display Market Value (USD Mn) Forecast by Technology , 2020-2035
  • Table 27: Eastern Europe Near-Eye Display Market Value (USD Mn) Forecast by Components, 2020-2035
  • Table 28: Eastern Europe Near-Eye Display Market Value (USD Mn) Forecast by Resolution, 2020-2035
  • Table 29: Eastern Europe Near-Eye Display Market Value (USD Mn) Forecast by Application, 2020-2035
  • Table 30: Eastern Europe Near-Eye Display Market Value (USD Mn) Forecast by End Use Industry, 2020-2035
  • Table 31: East Asia Near-Eye Display Market Value (USD Mn) Forecast by Country, 2020-2035
  • Table 32: East Asia Near-Eye Display Market Value (USD Mn) Forecast by Technology , 2020-2035
  • Table 33: East Asia Near-Eye Display Market Value (USD Mn) Forecast by Components, 2020-2035
  • Table 34: East Asia Near-Eye Display Market Value (USD Mn) Forecast by Resolution, 2020-2035
  • Table 35: East Asia Near-Eye Display Market Value (USD Mn) Forecast by Application, 2020-2035
  • Table 36: East Asia Near-Eye Display Market Value (USD Mn) Forecast by End Use Industry, 2020-2035
  • Table 37: South Asia and Pacific Near-Eye Display Market Value (USD Mn) Forecast by Country, 2020-2035
  • Table 38: South Asia and Pacific Near-Eye Display Market Value (USD Mn) Forecast by Technology , 2020-2035
  • Table 39: South Asia and Pacific Near-Eye Display Market Value (USD Mn) Forecast by Components, 2020-2035
  • Table 40: South Asia and Pacific Near-Eye Display Market Value (USD Mn) Forecast by Resolution, 2020-2035
  • Table 41: South Asia and Pacific Near-Eye Display Market Value (USD Mn) Forecast by Application, 2020-2035
  • Table 42: South Asia and Pacific Near-Eye Display Market Value (USD Mn) Forecast by End Use Industry, 2020-2035
  • Table 43: Middle East & Africa Near-Eye Display Market Value (USD Mn) Forecast by Country, 2020-2035
  • Table 44: Middle East & Africa Near-Eye Display Market Value (USD Mn) Forecast by Technology , 2020-2035
  • Table 45: Middle East & Africa Near-Eye Display Market Value (USD Mn) Forecast by Components, 2020-2035
  • Table 46: Middle East & Africa Near-Eye Display Market Value (USD Mn) Forecast by Resolution, 2020-2035
  • Table 47: Middle East & Africa Near-Eye Display Market Value (USD Mn) Forecast by Application, 2020-2035
  • Table 48: Middle East & Africa Near-Eye Display Market Value (USD Mn) Forecast by End Use Industry, 2020-2035

List of Figures

  • Figure 1: Global Near-Eye Display Market Pricing Analysis
  • Figure 2: Global Near-Eye Display Market Value (USD Mn) Forecast 2020–2035
  • Figure 3: Global Near-Eye Display Market Value Share and BPS Analysis by Technology , 2025 and 2035
  • Figure 4: Global Near-Eye Display Market Y-o-Y Growth Comparison by Technology , 2025–2035
  • Figure 5: Global Near-Eye Display Market Attractiveness Analysis by Technology
  • Figure 6: Global Near-Eye Display Market Value Share and BPS Analysis by Components, 2025 and 2035
  • Figure 7: Global Near-Eye Display Market Y-o-Y Growth Comparison by Components, 2025–2035
  • Figure 8: Global Near-Eye Display Market Attractiveness Analysis by Components
  • Figure 9: Global Near-Eye Display Market Value Share and BPS Analysis by Resolution, 2025 and 2035
  • Figure 10: Global Near-Eye Display Market Y-o-Y Growth Comparison by Resolution, 2025–2035
  • Figure 11: Global Near-Eye Display Market Attractiveness Analysis by Resolution
  • Figure 12: Global Near-Eye Display Market Value Share and BPS Analysis by Application, 2025 and 2035
  • Figure 13: Global Near-Eye Display Market Y-o-Y Growth Comparison by Application, 2025–2035
  • Figure 14: Global Near-Eye Display Market Attractiveness Analysis by Application
  • Figure 15: Global Near-Eye Display Market Value Share and BPS Analysis by End Use Industry, 2025 and 2035
  • Figure 16: Global Near-Eye Display Market Y-o-Y Growth Comparison by End Use Industry, 2025–2035
  • Figure 17: Global Near-Eye Display Market Attractiveness Analysis by End Use Industry
  • Figure 18: Global Near-Eye Display Market Value (USD Mn) Share and BPS Analysis by Region, 2025 and 2035
  • Figure 19: Global Near-Eye Display Market Y-o-Y Growth Comparison by Region, 2025–2035
  • Figure 20: Global Near-Eye Display Market Attractiveness Analysis by Region
  • Figure 21: North America Near-Eye Display Market Incremental Dollar Opportunity, 2025–2035
  • Figure 22: Latin America Near-Eye Display Market Incremental Dollar Opportunity, 2025–2035
  • Figure 23: Western Europe Near-Eye Display Market Incremental Dollar Opportunity, 2025–2035
  • Figure 24: Eastern Europe Near-Eye Display Market Incremental Dollar Opportunity, 2025–2035
  • Figure 25: East Asia Near-Eye Display Market Incremental Dollar Opportunity, 2025–2035
  • Figure 26: South Asia and Pacific Near-Eye Display Market Incremental Dollar Opportunity, 2025–2035
  • Figure 27: Middle East & Africa Near-Eye Display Market Incremental Dollar Opportunity, 2025–2035
  • Figure 28: North America Near-Eye Display Market Value Share and BPS Analysis by Country, 2025 and 2035
  • Figure 29: North America Near-Eye Display Market Value Share and BPS Analysis by Technology , 2025 and 2035
  • Figure 30: North America Near-Eye Display Market Y-o-Y Growth Comparison by Technology , 2025–2035
  • Figure 31: North America Near-Eye Display Market Attractiveness Analysis by Technology
  • Figure 32: North America Near-Eye Display Market Value Share and BPS Analysis by Components, 2025 and 2035
  • Figure 33: North America Near-Eye Display Market Y-o-Y Growth Comparison by Components, 2025–2035
  • Figure 34: North America Near-Eye Display Market Attractiveness Analysis by Components
  • Figure 35: North America Near-Eye Display Market Value Share and BPS Analysis by Resolution, 2025 and 2035
  • Figure 36: North America Near-Eye Display Market Y-o-Y Growth Comparison by Resolution, 2025–2035
  • Figure 37: North America Near-Eye Display Market Attractiveness Analysis by Resolution
  • Figure 38: North America Near-Eye Display Market Value Share and BPS Analysis by Application, 2025 and 2035
  • Figure 39: North America Near-Eye Display Market Y-o-Y Growth Comparison by Application, 2025–2035
  • Figure 40: North America Near-Eye Display Market Attractiveness Analysis by Application
  • Figure 41: North America Near-Eye Display Market Value Share and BPS Analysis by End Use Industry, 2025 and 2035
  • Figure 42: North America Near-Eye Display Market Y-o-Y Growth Comparison by End Use Industry, 2025–2035
  • Figure 43: North America Near-Eye Display Market Attractiveness Analysis by End Use Industry
  • Figure 44: Latin America Near-Eye Display Market Value Share and BPS Analysis by Country, 2025 and 2035
  • Figure 45: Latin America Near-Eye Display Market Value Share and BPS Analysis by Technology , 2025 and 2035
  • Figure 46: Latin America Near-Eye Display Market Y-o-Y Growth Comparison by Technology , 2025–2035
  • Figure 47: Latin America Near-Eye Display Market Attractiveness Analysis by Technology
  • Figure 48: Latin America Near-Eye Display Market Value Share and BPS Analysis by Components, 2025 and 2035
  • Figure 49: Latin America Near-Eye Display Market Y-o-Y Growth Comparison by Components, 2025–2035
  • Figure 50: Latin America Near-Eye Display Market Attractiveness Analysis by Components
  • Figure 51: Latin America Near-Eye Display Market Value Share and BPS Analysis by Resolution, 2025 and 2035
  • Figure 52: Latin America Near-Eye Display Market Y-o-Y Growth Comparison by Resolution, 2025–2035
  • Figure 53: Latin America Near-Eye Display Market Attractiveness Analysis by Resolution
  • Figure 54: Latin America Near-Eye Display Market Value Share and BPS Analysis by Application, 2025 and 2035
  • Figure 55: Latin America Near-Eye Display Market Y-o-Y Growth Comparison by Application, 2025–2035
  • Figure 56: Latin America Near-Eye Display Market Attractiveness Analysis by Application
  • Figure 57: Latin America Near-Eye Display Market Value Share and BPS Analysis by End Use Industry, 2025 and 2035
  • Figure 58: Latin America Near-Eye Display Market Y-o-Y Growth Comparison by End Use Industry, 2025–2035
  • Figure 59: Latin America Near-Eye Display Market Attractiveness Analysis by End Use Industry
  • Figure 60: Western Europe Near-Eye Display Market Value Share and BPS Analysis by Country, 2025 and 2035
  • Figure 61: Western Europe Near-Eye Display Market Value Share and BPS Analysis by Technology , 2025 and 2035
  • Figure 62: Western Europe Near-Eye Display Market Y-o-Y Growth Comparison by Technology , 2025–2035
  • Figure 63: Western Europe Near-Eye Display Market Attractiveness Analysis by Technology
  • Figure 64: Western Europe Near-Eye Display Market Value Share and BPS Analysis by Components, 2025 and 2035
  • Figure 65: Western Europe Near-Eye Display Market Y-o-Y Growth Comparison by Components, 2025–2035
  • Figure 66: Western Europe Near-Eye Display Market Attractiveness Analysis by Components
  • Figure 67: Western Europe Near-Eye Display Market Value Share and BPS Analysis by Resolution, 2025 and 2035
  • Figure 68: Western Europe Near-Eye Display Market Y-o-Y Growth Comparison by Resolution, 2025–2035
  • Figure 69: Western Europe Near-Eye Display Market Attractiveness Analysis by Resolution
  • Figure 70: Western Europe Near-Eye Display Market Value Share and BPS Analysis by Application, 2025 and 2035
  • Figure 71: Western Europe Near-Eye Display Market Y-o-Y Growth Comparison by Application, 2025–2035
  • Figure 72: Western Europe Near-Eye Display Market Attractiveness Analysis by Application
  • Figure 73: Western Europe Near-Eye Display Market Value Share and BPS Analysis by End Use Industry, 2025 and 2035
  • Figure 74: Western Europe Near-Eye Display Market Y-o-Y Growth Comparison by End Use Industry, 2025–2035
  • Figure 75: Western Europe Near-Eye Display Market Attractiveness Analysis by End Use Industry
  • Figure 76: Eastern Europe Near-Eye Display Market Value Share and BPS Analysis by Country, 2025 and 2035
  • Figure 77: Eastern Europe Near-Eye Display Market Value Share and BPS Analysis by Technology , 2025 and 2035
  • Figure 78: Eastern Europe Near-Eye Display Market Y-o-Y Growth Comparison by Technology , 2025–2035
  • Figure 79: Eastern Europe Near-Eye Display Market Attractiveness Analysis by Technology
  • Figure 80: Eastern Europe Near-Eye Display Market Value Share and BPS Analysis by Components, 2025 and 2035
  • Figure 81: Eastern Europe Near-Eye Display Market Y-o-Y Growth Comparison by Components, 2025–2035
  • Figure 82: Eastern Europe Near-Eye Display Market Attractiveness Analysis by Components
  • Figure 83: Eastern Europe Near-Eye Display Market Value Share and BPS Analysis by Resolution, 2025 and 2035
  • Figure 84: Eastern Europe Near-Eye Display Market Y-o-Y Growth Comparison by Resolution, 2025–2035
  • Figure 85: Eastern Europe Near-Eye Display Market Attractiveness Analysis by Resolution
  • Figure 86: Eastern Europe Near-Eye Display Market Value Share and BPS Analysis by Application, 2025 and 2035
  • Figure 87: Eastern Europe Near-Eye Display Market Y-o-Y Growth Comparison by Application, 2025–2035
  • Figure 88: Eastern Europe Near-Eye Display Market Attractiveness Analysis by Application
  • Figure 89: Eastern Europe Near-Eye Display Market Value Share and BPS Analysis by End Use Industry, 2025 and 2035
  • Figure 90: Eastern Europe Near-Eye Display Market Y-o-Y Growth Comparison by End Use Industry, 2025–2035
  • Figure 91: Eastern Europe Near-Eye Display Market Attractiveness Analysis by End Use Industry
  • Figure 92: East Asia Near-Eye Display Market Value Share and BPS Analysis by Country, 2025 and 2035
  • Figure 93: East Asia Near-Eye Display Market Value Share and BPS Analysis by Technology , 2025 and 2035
  • Figure 94: East Asia Near-Eye Display Market Y-o-Y Growth Comparison by Technology , 2025–2035
  • Figure 95: East Asia Near-Eye Display Market Attractiveness Analysis by Technology
  • Figure 96: East Asia Near-Eye Display Market Value Share and BPS Analysis by Components, 2025 and 2035
  • Figure 97: East Asia Near-Eye Display Market Y-o-Y Growth Comparison by Components, 2025–2035
  • Figure 98: East Asia Near-Eye Display Market Attractiveness Analysis by Components
  • Figure 99: East Asia Near-Eye Display Market Value Share and BPS Analysis by Resolution, 2025 and 2035
  • Figure 100: East Asia Near-Eye Display Market Y-o-Y Growth Comparison by Resolution, 2025–2035
  • Figure 101: East Asia Near-Eye Display Market Attractiveness Analysis by Resolution
  • Figure 102: East Asia Near-Eye Display Market Value Share and BPS Analysis by Application, 2025 and 2035
  • Figure 103: East Asia Near-Eye Display Market Y-o-Y Growth Comparison by Application, 2025–2035
  • Figure 104: East Asia Near-Eye Display Market Attractiveness Analysis by Application
  • Figure 105: East Asia Near-Eye Display Market Value Share and BPS Analysis by End Use Industry, 2025 and 2035
  • Figure 106: East Asia Near-Eye Display Market Y-o-Y Growth Comparison by End Use Industry, 2025–2035
  • Figure 107: East Asia Near-Eye Display Market Attractiveness Analysis by End Use Industry
  • Figure 108: South Asia and Pacific Near-Eye Display Market Value Share and BPS Analysis by Country, 2025 and 2035
  • Figure 109: South Asia and Pacific Near-Eye Display Market Value Share and BPS Analysis by Technology , 2025 and 2035
  • Figure 110: South Asia and Pacific Near-Eye Display Market Y-o-Y Growth Comparison by Technology , 2025–2035
  • Figure 111: South Asia and Pacific Near-Eye Display Market Attractiveness Analysis by Technology
  • Figure 112: South Asia and Pacific Near-Eye Display Market Value Share and BPS Analysis by Components, 2025 and 2035
  • Figure 113: South Asia and Pacific Near-Eye Display Market Y-o-Y Growth Comparison by Components, 2025–2035
  • Figure 114: South Asia and Pacific Near-Eye Display Market Attractiveness Analysis by Components
  • Figure 115: South Asia and Pacific Near-Eye Display Market Value Share and BPS Analysis by Resolution, 2025 and 2035
  • Figure 116: South Asia and Pacific Near-Eye Display Market Y-o-Y Growth Comparison by Resolution, 2025–2035
  • Figure 117: South Asia and Pacific Near-Eye Display Market Attractiveness Analysis by Resolution
  • Figure 118: South Asia and Pacific Near-Eye Display Market Value Share and BPS Analysis by Application, 2025 and 2035
  • Figure 119: South Asia and Pacific Near-Eye Display Market Y-o-Y Growth Comparison by Application, 2025–2035
  • Figure 120: South Asia and Pacific Near-Eye Display Market Attractiveness Analysis by Application
  • Figure 121: South Asia and Pacific Near-Eye Display Market Value Share and BPS Analysis by End Use Industry, 2025 and 2035
  • Figure 122: South Asia and Pacific Near-Eye Display Market Y-o-Y Growth Comparison by End Use Industry, 2025–2035
  • Figure 123: South Asia and Pacific Near-Eye Display Market Attractiveness Analysis by End Use Industry
  • Figure 124: Middle East & Africa Near-Eye Display Market Value Share and BPS Analysis by Country, 2025 and 2035
  • Figure 125: Middle East & Africa Near-Eye Display Market Value Share and BPS Analysis by Technology , 2025 and 2035
  • Figure 126: Middle East & Africa Near-Eye Display Market Y-o-Y Growth Comparison by Technology , 2025–2035
  • Figure 127: Middle East & Africa Near-Eye Display Market Attractiveness Analysis by Technology
  • Figure 128: Middle East & Africa Near-Eye Display Market Value Share and BPS Analysis by Components, 2025 and 2035
  • Figure 129: Middle East & Africa Near-Eye Display Market Y-o-Y Growth Comparison by Components, 2025–2035
  • Figure 130: Middle East & Africa Near-Eye Display Market Attractiveness Analysis by Components
  • Figure 131: Middle East & Africa Near-Eye Display Market Value Share and BPS Analysis by Resolution, 2025 and 2035
  • Figure 132: Middle East & Africa Near-Eye Display Market Y-o-Y Growth Comparison by Resolution, 2025–2035
  • Figure 133: Middle East & Africa Near-Eye Display Market Attractiveness Analysis by Resolution
  • Figure 134: Middle East & Africa Near-Eye Display Market Value Share and BPS Analysis by Application, 2025 and 2035
  • Figure 135: Middle East & Africa Near-Eye Display Market Y-o-Y Growth Comparison by Application, 2025–2035
  • Figure 136: Middle East & Africa Near-Eye Display Market Attractiveness Analysis by Application
  • Figure 137: Middle East & Africa Near-Eye Display Market Value Share and BPS Analysis by End Use Industry, 2025 and 2035
  • Figure 138: Middle East & Africa Near-Eye Display Market Y-o-Y Growth Comparison by End Use Industry, 2025–2035
  • Figure 139: Middle East & Africa Near-Eye Display Market Attractiveness Analysis by End Use Industry
  • Figure 140: Global Near-Eye Display Market – Tier Structure Analysis
  • Figure 141: Global Near-Eye Display Market – Company Share Analysis

Frequently Asked Questions

How big is the near-eye display market in 2025?

The global near-eye display market is estimated to be valued at USD 3.8 billion in 2025.

What will be the size of near-eye display market in 2035?

The market size for the near-eye display market is projected to reach USD 32.0 billion by 2035.

How much will be the near-eye display market growth between 2025 and 2035?

The near-eye display market is expected to grow at a 23.6% CAGR between 2025 and 2035.

What are the key product types in the near-eye display market?

The key product types in near-eye display market are organic light-emitting diode on silicon (oledos), thin-film transistor (tft) lcd, active-matrix organic light-emitting diode (amoled), liquid crystal on silicon (lcos), microscopic light-emitting diode (microled), digital light processing (dlp) and laser beam scanning.

Which components segment to contribute significant share in the near-eye display market in 2025?

In terms of components, image generators segment to command 36.4% share in the near-eye display market in 2025.

Explore Similar Insights

Future Market Insights

Near-Eye Display Market

Chat With

MaRIA

Hi There, I am MaRIA, Your Market Research Intelligence Assistant. How may I help you?