

- Market Size (2026)
- USD 125.4 Mn
- Forecast (2036)
- USD 299.5 Mn
- CAGR (2026 to 2036)
- 9.1%
How big is Nutrient Loss Reducers Market in 2026?
Sales in the nutrient loss reducers market are projected to grow at 9.1% CAGR through 2036. Market size rises from USD 114.9 million in 2025 to USD 125.4 million in 2026 and is expected to reach USD 299.5 million by 2036.
Applied fertilizer can move through volatilization, leaching and runoff before uptake. FMI estimates nutrient loss reducers market to rise from USD 114.9 million in 2025 to USD 125.4 million in 2026, and is anticipated to reach USD 299.5 million by 2036 at 9.1% CAGR. These products improve retention, spreading and nutrient availability within fertilizer schedules. FAO reported in January 2025 that agriculture and industry add about 150 teragrams of reactive nitrogen to land each year, over twice the pre-industrial rate.[1] This is expected to strengthen requirement for stabilizers, agricultural surfactants, polymers and deposition aids that control movement under field conditions.
Local fertilizer practices and advisory support will also decide regular use. The USA is forecast to expand at 8.7% CAGR during 2026 to 2036, while South Korea is estimated to grow at 8.4%. Broad-acre fertilizer use and retailer agronomy networks are likely to upkeep USA evaluation. South Korea, however, is moving through soil testing, fertilizer prescriptions, slow-release inputs and runoff-control practices under a staged nutrient-management route.[14] FMI anticipates prospects for products having use rate and field results and compatibility with specialty fertilizers programs. USA demand can be volume-led, whereas South Korean adoption is expected to depend more on prescribed use and digital crop monitoring.
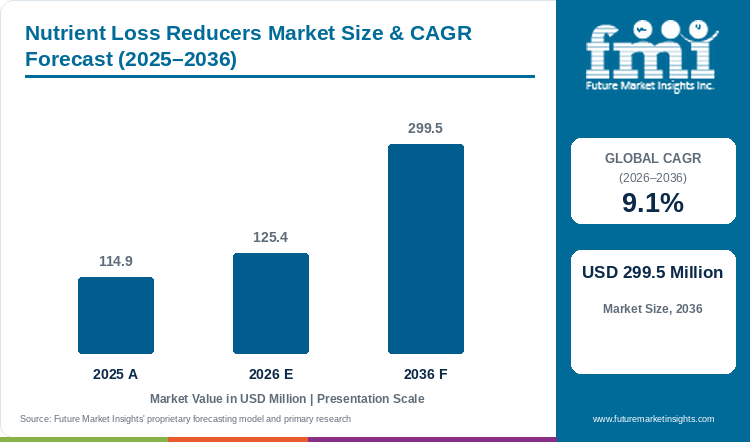
Nutrient Loss Reducers Market Size & CAGR Forecast (2025-2036)
| Year | Basis | Market value (USD million) |
|---|---|---|
| 2025 | Actual | 114.9 |
| 2026 | Estimate | 125.4 |
| 2036 | Forecast | 299.5 |
| CAGR, 2026 to 2036 | 9.1% | |
Source: Future Market Insights proprietary forecasting model and primary research.
Key Takeaways
- The 2026 market value is estimated at USD 125.4 million, reaching USD 299.5 million by 2036 at 9.1% CAGR.
- Based on product type, surfactant-based products are projected to account for 51.3% in 2026, supported by tank-mix compatibility and foliar delivery.
- By function, efficacy enhancement is estimated to hold 42.0% in 2026, owing to demand for stronger delivered nutrient performance.
- In 2026, cereals and grains are expected to lead crop type with 37.3% share as broad-acre programs create repeated nutrient decisions.
- USA demand is forecast to expand at 8.7% CAGR, while South Korea is projected at 8.4% through 2036, although the regulatory drivers remain distinct.
- Notable companies include Stepan Company, Evonik, Syensqo, Wilbur-Ellis, Helena Agri-Enterprises, Precision Laboratories, WinField United, and Brandt.
Analyst Perspective
“I see repeat adoption moving towards products that control one nutrient-loss pathway without changing the complete fertilizer program. Local field results will decide which products retain demand when water, crop and tank conditions keep changing.”
- Nikhil Kaitwade, Principal Consultant, Future Market Insights.
How is the nutrient loss reducers market segmented?
The nutrient loss reducers market is segmented by product type, function, crop type, application method, sales channel, and region. In 2026, dominant subsegments are surfactant-based products at 51.3%, efficacy enhancement at 42.0%, cereals and grains at 37.3%, foliar tank-mix at 45.9%, and agri-input distributors at 39.2%.
The nutrient loss reducers market is divided on the basis of product type, function, crop type, application method, sales channel and region. Product types explain the chemistry being used, while function identifies whether the product improves nutrient performance, reduces movement or supports handling. Crop type and application method show where the products are being applied. Sales channels further explain how growers receive product availability, technical advice and application support.
By product type: surfactant-based, oil-based, polymers, carrier-based, and others.
By function: efficacy enhancement, loss and drift reduction, handling and compatibility, and others.
By crop type: cereals and grains, fruits and vegetables, oilseeds and pulses, turf and ornamentals, and others.
By application method: foliar tank-mix, granule and dry-blend, fertigation, and others.
By sales channel: agri-input distributors, direct and online, retail ag-stores, and others.
By region: North America, Latin America, Western Europe, Eastern Europe, East Asia, South Asia and Pacific, and Middle East and Africa.
What makes Surfactant-Based central to the Product Type category?
Based on product type, surfactant-based products are projected to account for 51.3% in 2026, supported by compatibility across established spray programs.
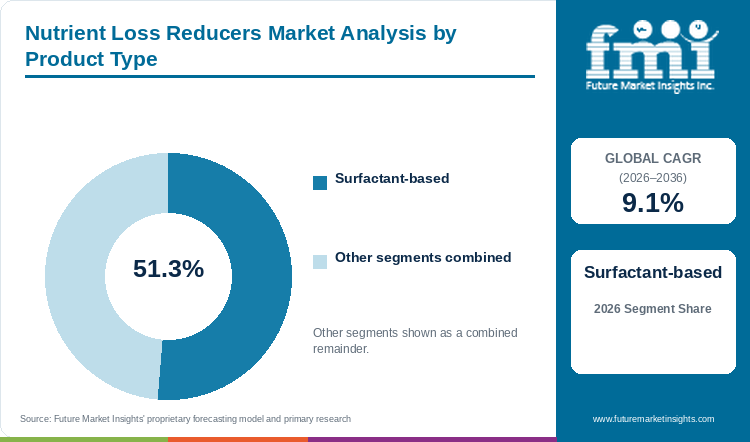
| Product type | Share (2026) |
|---|---|
| Surfactant-based products | 51.3% |
| Other segments combined | 48.7%* |
| Total | 100.0% |
| Metric | Value |
|---|---|
| Global CAGR (2026-2036) | 9.1% |
| Leading segment | Surfactant-based products |
Surfactant-based products are gaining wider adoption as they improve wetting, spreading, adhesion and retention when liquid nutrients are applied on crop surfaces. These products are included in tank mixtures and formulated products without requiring another field equipment. Due to this operating convenience, their use is expanding in foliar nutrition and combined spray programs alongside biofertilizers. Oil-based products are applied where penetration is required, while polymers and carrier-based products are used for selected delivery conditions. In March 2025, Evonik presented BREAK-THRU products for adhesion, rain retention, wettability and foliar use.[5] This development shows how suppliers are improving spray behavior according to crop surface and application need.
- Surfactant-based products account for 51.3% share in 2026, owing to wider chemistry options and compatibility with different nutrient sources.
- Availability of several surfactant chemistries helps selection according to crop surface, nutrient source and water condition.
Why does Efficacy Enhancement lead the Function category?
By function, efficacy enhancement is estimated to hold 42.0% in 2026, owing to demand for stronger delivered nutrient performance.
In the FMI report, efficacy enhancement is estimated to hold 42.0% share in 2026 as growers first want better performance from nutrients already present in the program. These products can improve contact with leaf or soil surface, reduce nutrient tie-up and support availability around root zone. Loss and drift reduction becomes important when material moves away from the target, while handling and compatibility is selected for complex mixtures and difficult water conditions. Efficacy enhancement therefore has wider use because its application can be connected with phosphate fertilizers or foliar nutrients already being purchased. Product adoption will improve where the supplier explains the exact pathway being improved and the field result expected from it.
- Efficacy enhancement holds 42.0% share in 2026, driven by demand for improved nutrient performance from existing application programs.
- Growers can compare these products with present nutrient programs without creating another separate application requirement.
What supports Cereals and Grains in the Crop Type category?
In 2026, cereals and grains are expected to lead crop type with 37.3% share, driven by repeated nutrient decisions across broad-acre systems.
Cereals and grains cover large cultivated area and require nutrient decisions at planting, sidedress and foliar stages. Corn, wheat, rice, barley, oats and sorghum can face nutrient movement through volatilization, leaching, runoff and uneven deposition. These repeated applications give nutrient loss reducers several points of use during one crop season. Fruits and vegetables support higher input value per acre; however, these crops need more crop-specific product validation before regular application. Broad-acre programs are comparatively easier to repeat once use rate, tank fit and field performance is established alongside organic fertilizers. Owing to this application spread, cereals and grains are expected to account for 37.3% share in 2026.
- Cereals and grains account for 37.3% share in 2026, attributable to broad acreage and repeated nutrient applications during the crop season.
- Planting, sidedress and foliar applications create several points for using nutrient-retention and delivery products.
How does Foliar Tank-Mix lead the Application Method category?
By application method, foliar tank-mix is forecast to represent 45.9% in 2026, reflecting convenient integration into scheduled spray passes.
According to FMI, foliar tank-mix is forecast to represent 45.9% share in 2026 as the product can be included in a spray pass which is already planned. At the time of application, it can change droplet size, wetting, spreading, deposition, water conditioning and compatibility. This reduces the need for carrying out another field operation only for the nutrient loss reducer. Granule and dry-blend products remain suitable for fertilizer handling, while fertigation delivers drip fertilizer blends directly into the active root zone. Foliar tank-mix therefore gains preference where growers want to protect nutrient delivery without changing the complete spray schedule.
- Foliar tank-mix represents 45.9% share in 2026, supported by its use within scheduled spray passes.
- Integration in existing spray operations reduces workflow change and permits adjustment according to water, weather and tank partners.
What drives Agri-Input Distributors in the Sales Channel category?
Agri-input distributors are set to lead sales channel with 39.2% share in 2026, underpinned by local agronomy support and inventory access.
Agri-input distributors hold preference because selection of nutrient loss reducers requires knowledge of crop, nutrient source and application condition. Water quality, use rate, nozzle choice, mixing order and tank partners can change how the product performs when blended with mineral solubilizer blends. Distributors combine local inventory with agronomy advice and help growers compare different options before the spray or fertilizer pass is made. Direct and online channels become useful after product fit is already known, but first adoption generally requires more technical explanation. The Fertilizer Institute notes that certified crop advisers and ag retailers guide 4R nutrient stewardship practices across commercial farms, aligning product placement with equipment and soil conditions.[6] This adviser involvement is supporting agri-input distributors, which are set to hold 39.2% share in 2026.
- Agri-input distributors account for 39.2% share in 2026, owing to local inventory, agronomy advice and product-selection support.
- Local guidance helps growers resolve compatibility and application questions before the product reaches the field.
What are the drivers, restraints, and opportunities in the nutrient loss reducers market?
In the nutrient loss reducers market, nutrient-efficiency pressure supports demand, application-specific validation constrains adoption, and multifunctional formulations create the clearest commercial expansion path through 2036.
- Driver: Food manufacturers and commercial growers will continue adopting nutrient-loss reducers to protect applied fertilizer value and enhance crop uptake through 2036.
- Restraint: Spray drift variability, water quality fluctuations, and tank-mix incompatibility will continue to complicate field qualification across commercial programs through 2036.
- Opportunity: Multifunctional formulation systems and decision-support tools are expected to expand nutrient-loss reduction practices across routine spray operations through 2036.
Fertilizer Protection Supports Nutrient Efficiency
FMI research indicates that protection of fertilizer value is becoming an important factor for nutrient loss reducers market. Volatilization, leaching, runoff and weak uptake can prevent a portion of applied nutrients from reaching the crop, prompting growers to integrate sulphur coated urea into fertilization schedules. FAO reported in 2025 that global cropland nutrient use efficiency averages 55 percent for nitrogen and 73 percent for phosphorus, with excess nutrients lost through volatilization, leaching, and runoff.[7] As a result, growers are looking for products that work on a defined loss pathway without changing the complete fertilizer program. Demand will remain stronger where field results show how much application performance is improved under similar crop, water and weather conditions.
Application and Water Conditions Change Performance
Performance of nutrient loss reducers can change with formulation, use rate, droplet profile, water quality, weather and tank partners. CPDA certification standards establish that water hardness, droplet velocity distribution, and tank-partner antagonism directly determine spray retention and deposition consistency.[8] This has made proper use instructions and application records more important during product selection. A formulation working in one crop program may not provide the same result when nutrient source, water or tank partner changes, particularly in complex mixtures containing lignosulfonate chelates. Lack of local data and clear mixing guidance can therefore slow adoption, especially where an adviser cannot compare the product with the grower’s present program.
Multifunctional Formulations Create Field Opportunities
Multifunctional products are creating new growth prospects as retention, application control and compatibility can be combined in one field operation. In August 2025, EPA released the mobile-friendly PALM tool for calculating runoff and spray-drift mitigations.[9] Such tools are making field decisions more structured and are increasing the need for products having clear application instructions. A nutrient loss reducer can enter these workflows more easily when it does not add another separate pass. Products that connect chemistry with nutrient planning and local field evidence are therefore expected to witness better adoption during the forecast period.
Which country CAGRs are profiled in the nutrient loss reducers market?
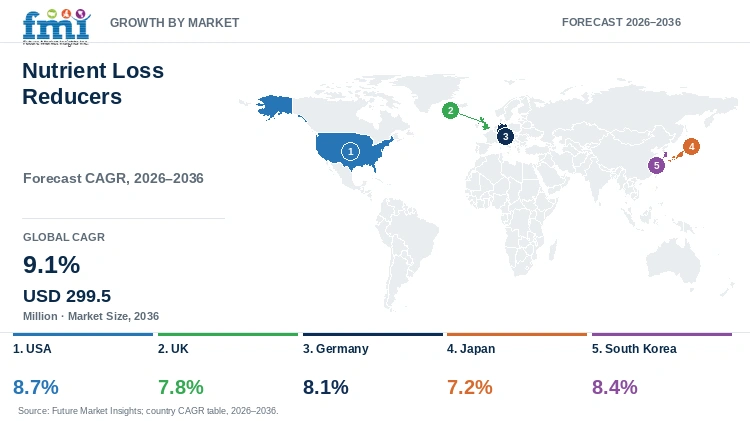
| Country | CAGR, 2026-2036 |
|---|---|
| USA | 8.7% |
| UK | 7.8% |
| Germany | 8.1% |
| Japan | 7.2% |
| South Korea | 8.4% |
How do country-level CAGRs compare in the nutrient loss reducers market?
As per the analysis from FMI, country growth rates differ through 2036 because fertilizer regulations, crop structures, and advisory frameworks vary across key markets. The USA and South Korea lead projected growth above 8.3 per cent, while European and Asian markets follow distinct environmental and application standards.
- USA demand is supported by established retailer agronomy networks, custom-application infrastructure, and detailed mitigation planning across broad-acre crops.
- The UK combines formal farm nutrient-management planning with agronomist-led product recommendations under national stewardship schemes.
- Germany emphasizes crop-specific fertilization limits, strict soil-surplus regulations, and traceable application documentation.
- Japan prioritizes national chemical-fertilizer reduction targets, precision dosing, and proven compatibility with regional cultivation practices.
- South Korea benefits from public nutrient-management initiatives, mandatory soil testing programs, and digital crop-monitoring frameworks.
Full report country CAGRs cover: North America; Latin America; Western Europe; Eastern Europe; East Asia; South Asia and Pacific; Middle East and Africa.
Country-wise Analysis
- USA nutrient loss reducers market is forecast to grow at 8.7% CAGR through 2036, supported by established retailer and custom-application channels. In April 2025, EPA updated its mitigation menu with application options connected to labels, bulletins, crops and field conditions.[10] Dealers can place suitable products beside seed treatment, fertilizer, or calcium ammonium nitrate programs where labels permit. This is increasing requirement for clear droplet, compatibility and use-rate information which advisers can use in nutrient and crop-protection programs.
- UK nutrient loss reducers market is anticipated to expand at 7.8% CAGR during the assessment period, owing to formal nutrient planning and adviser involvement. In February 2026, Defra introduced a dedicated digital nutrient management planning tool under the Sustainable Farming Incentive framework.[11] Among farms taking professional advice for self-produced plans, 70% used fertilizer advisers or agronomists. These factors are supporting products having clear nutrient-efficiency benefits and practical use within existing schedules.
- Germany is expected to witness 8.1% CAGR over the forecast period, attributable to fertilizer practices based on crop need and soil conditions. BVL and BMEL guidelines connect authorized nutrient loss reducers with permitted application conditions and soil protection zones.[12] This is supporting demand for products that improve nutrient handling within established fertilizer programs. Localized technical documents and crop-specific application evidence is also becoming important for suppliers operating in Germany.
- Adoption of nutrient loss reducers in Japan is estimated to grow at 7.2% CAGR through 2036, supported by focus on lower fertilizer use. MAFF detailed precision fertilizer benchmarks under the Green Food System Law to support 2050 input reduction goals.[13] This is creating demand for products which protect available nutrients without increasing risk in crop yield management. Local results and distributor support will remain important for wider adoption.
- South Korea nutrient loss reducers market is projected to record 8.4% CAGR during the assessment period. In 2026, MAFRA announced a staged nutrient-management route including soil testing, fertilizer prescriptions, slow-release fertilizer use and best-management practices.[14] These measures are increasing application prospects for products used in nutrient retention and delivery. Suppliers are expected to connect product performance with crop-level prescriptions and runoff-control practices.
Who are the notable companies in the nutrient loss reducers market?
Stepan Company, Evonik, Syensqo, Wilbur-Ellis, Helena Agri-Enterprises, Precision Laboratories, WinField United, and Brandt are notable companies profiled in this market.
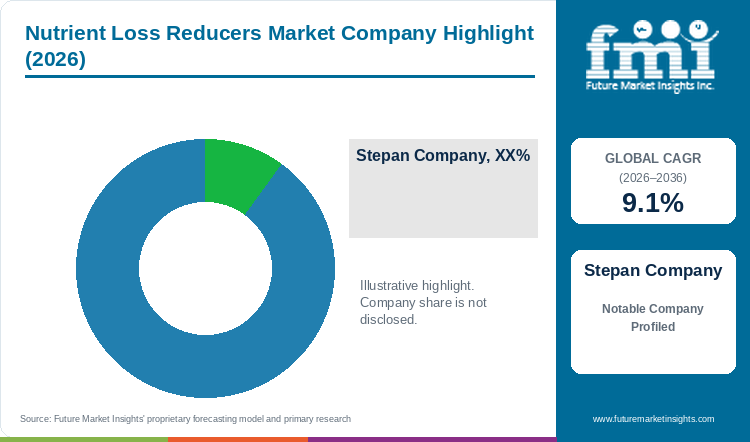
FMI data suggests that nutrient loss reducers market includes formulation-chemistry suppliers, agronomy platforms and application-performance companies. Stepan Company, Evonik and Syensqo provide surfactants, polymers, dispersants and formulation support. Wilbur-Ellis, Helena Agri-Enterprises and WinField United connect products with agronomy and regional input channels. Precision Laboratories and Brandt are focused on water conditioning, deposition, drift control, compatibility and nutrient application. Selection changes according to the loss pathway being managed, crop program, application route and local evidence available with the supplier.
- Formulation chemistry suppliers: Stepan Company, Evonik, and Syensqo provide surfactants, polymers, dispersants, and formulation support.
- Agronomy and distribution platforms: Wilbur-Ellis, Helena Agri-Enterprises, and WinField United connect products with regional agronomy and retail networks.
- Application-performance specialists: Precision Laboratories and Brandt develop tank-mix adjuvants, deposition aids, drift reducers, and water conditioners.
Competitive Benchmarking: Nutrient Loss Reducers Market
| Company | Primary position | Documented market relevance |
|---|---|---|
| Stepan Company | Formulation chemistry | Agricultural surfactants, dispersants, wetting agents and formulation services. |
| Evonik | Specialty chemistry | Foliar wetting, adhesion, retention and application-development technologies. |
| Syensqo | Agricultural specialties | Dispersants and formulation aids for suspension concentrates. |
| Wilbur-Ellis | Agronomy platform | Fertilizer and application products connected with regional agronomy channels. |
| Helena Agri-Enterprises | Input platform | Crop nutrition, micronutrients, adjuvants and US distribution. |
| Precision Laboratories | Application specialist | Tank-mix adjuvants, water and nutrient management and application support. |
| WinField United | Retailer-connected platform | Adjuvant technology distributed through an established agronomy network. |
| Brandt | Specialty agriculture | Adjuvants, foliar nutrition, water conditioners and retailer support. |
The benchmarking table records documented nutrient-loss reduction capability and application support. It does not rank companies by market share.
Key Developments in the Nutrient Loss Reducers Market
- In September 2025, WinField United introduced SuperLock adjuvant to improve droplet deposition, canopy penetration, and drift reduction in commercial field spraying.[15]
- In February 2025, Wilbur-Ellis launched BenVireo TerraLux 10-0-0, an OMRI-approved liquid nitrogen fertilizer described as 100% plant-available.[16]
- In November 2025, Precision Laboratories published guidance on oil-based adjuvants for fall burndown applications, covering penetration, translocation, and drift control.[17]
Key Players in the Nutrient Loss Reducers Market
Formulation chemistry suppliers
- Stepan Company
- Evonik
- Syensqo
Agronomy and distribution platforms
- Wilbur-Ellis
- Helena Agri-Enterprises
- WinField United
Application-performance specialists
- Precision Laboratories
- Brandt
Nutrient Loss Reducers Market - Report Scope
| Coverage field | Report scope |
|---|---|
| Market breakdown | Product Type; Function; Crop Type; Application Method; Sales Channel; Region. |
| Quantitative units | USD million. |
| Market definition | Revenue from products sold to improve nutrient delivery, availability, retention or application efficiency. Raw commodity fertilizers, untreated manure, and generic crop-protection active ingredients sold without loss-reduction claims are outside scope. |
| Regions covered | North America; Latin America; Western Europe; Eastern Europe; East Asia; South Asia and Pacific; Middle East and Africa. |
| Countries covered | USA, UK, Germany, Japan, South Korea, and additional countries in the full report. |
| Key companies profiled | Stepan Company, Evonik, Syensqo, Wilbur-Ellis, Helena Agri-Enterprises, Precision Laboratories, WinField United, Brandt. |
| Forecast period | 2026 to 2036. |
| Approach | The Future Market Insights report covers supplier activity, segment structure, application routes, and country adoption conditions within the stated market boundary. |
Nutrient Loss Reducers Market - Research Methodology
| Method | Approach |
|---|---|
| Primary Research | Analysts gathered input from manufacturers, service providers, technology developers, distributors, end users, procurement teams, and subject-matter experts. Interviews examined purchasing decisions, product evaluation, adoption barriers, approval requirements, pricing, and technical support. |
| Desk Research | Desk research covered government statistics, regulatory publications, trade data, industry associations, technical literature, standards, company filings, product information, and official corporate announcements. Sources were checked for date, geography, and direct market relevance. |
| Market Sizing and Forecasting | The model combined the baseline value with historical performance, segment structure, pricing and volume indicators, adoption levels, company participation, and country demand conditions. Forecast assumptions included regulation, technology use, purchasing cycles, and supply availability. |
| Data Validation | Estimates were checked against public data, company activity, trade patterns, and primary-research findings. Adjacent categories, unsupported claims, overlapping revenue, and activities outside the defined market were excluded. |
Nutrient Loss Reducers Market by Segments
Nutrient Loss Reducers Market segmented by Product Type:
- Surfactant-based
- Oil-based
- Polymers
- Carrier-based
- Others
Nutrient Loss Reducers Market segmented by Function:
- Efficacy enhancement
- Loss and drift reduction
- Handling and compatibility
- Others
Nutrient Loss Reducers Market segmented by Crop Type:
- Cereals and grains
- Fruits and vegetables
- Oilseeds and pulses
- Turf and ornamentals
- Others
Nutrient Loss Reducers Market segmented by Application Method:
- Foliar tank-mix
- Granule and dry-blend
- Fertigation
- Others
Nutrient Loss Reducers Market segmented by Sales Channel:
- Agri-input distributors
- Direct and online
- Retail ag-stores
- Others
Nutrient Loss Reducers Market by Region
- North America
- United States
- Canada
- Latin America
- Brazil
- Mexico
- Argentina
- Chile
- Western Europe
- Germany
- France
- United Kingdom
- Italy
- Spain
- Benelux
- Nordics
- Eastern Europe
- Poland
- Czech Republic
- Romania
- Hungary
- East Asia
- China
- Japan
- South Korea
- South Asia and Pacific
- India
- ASEAN
- Australia and New Zealand
- Middle East and Africa
- GCC Countries
- South Africa
- Türkiye
- Israel
Research Sources and Bibliography
- [1] Food and Agriculture Organization of the United Nations. (2025, January 20). Nitrogen use efficiency must be improved to reduce harm to human and environmental health.
- [2] Department for Environment, Food & Rural Affairs. (2026, June 11). Nutrient management: Farm Practices Survey February 2026.
- [3] Federal Ministry of Food and Agriculture, Germany. (2025). Fertiliser Application Ordinance and nutrient-surplus guidance.
- [4] Ministry of Agriculture, Forestry and Fisheries, Japan. (2025). MIDORI Strategy for Sustainable Food Systems.
- [5] Evonik Industries. (2025, March 19). ISAA 2025 agricultural solutions and innovations.
- [6] The Fertilizer Institute. (2026). 4R Nutrient Stewardship framework: Right Source, Right Rate, Right Time, Right Place.
- [7] Food and Agriculture Organization of the United Nations. (2025). Cropland nutrient balance: Global, regional and country trends.
- [8] Council of Producers and Distributors of Agrotechnology. (2025). CPDA Certified Adjuvant Program: Drift and volatility reduction standards.
- [9] U.S. Environmental Protection Agency. (2025, August). Mitigation Menu Measure Descriptions and PALM release.
- [10] U.S. Environmental Protection Agency. (2025, April 30). Mitigation Menu: Pesticide spray drift and runoff reduction.
- [11] Department for Environment, Food & Rural Affairs. (2026, February 4). Nutrient management planning tool on GOV.UK.
- [12] German Federal Office of Consumer Protection and Food Safety. (2026). Authorized agricultural input database and application controls.
- [13] Ministry of Agriculture, Forestry and Fisheries of Japan. (2026). Green Food System Law and fertilizer-reduction action plans.
- [14] Ministry of Agriculture, Food and Rural Affairs, Republic of Korea. (2026). Cropland nutrient-management and runoff-control measures.
- [15] WinField United. (2025, September). SuperLock adjuvant technology introduction.
- [16] Wilbur-Ellis Agribusiness. (2025, February 20). BenVireo TerraLux launch.
- [17] Precision Laboratories. (2025, November 5). Oil-based adjuvants in fall burndown applications.
- [18] Stepan Company. (2025). Agricultural surfactants, dispersants and formulation services.
- [19] Syensqo. (2026, March 10). Geropon D2566 launch.
- [20] Brandt. (2026). Adjuvant Product Guide.
This bibliography is provided for reader reference. The full report contains the complete reference list and detailed citations.
This Report Answers
- What is Nutrient Loss Reducers Market worth during 2026?
- What value is Nutrient Loss Reducers Market projected by 2036?
- Which product type holds notable Nutrient Loss Reducers Market share?
- Which function holds notable Nutrient Loss Reducers Market share?
- Which countries have notable Nutrient Loss Reducers Market growth?
- Which companies are notable in Nutrient Loss Reducers Market today?
Frequently Asked Questions
How large is the Nutrient Loss Reducers Market expected to be in 2026?
Future Market Insights estimates that the nutrient loss reducers market will reach USD 125.4 million in 2026. The market is projected to expand further and reach USD 299.5 million by 2036.
What CAGR is forecast for the Nutrient Loss Reducers Market through 2036?
The nutrient loss reducers market is projected to grow at a 9.1% CAGR from 2026 to 2036. Growth is supported by products that improve nutrient availability, application control and protection against avoidable loss.
Which product type holds a notable nutrient loss reducers demand share in 2026?
Future Market Insights projects surfactant-based products to hold 51.3% of product type demand in 2026. Their use in wetting, spreading, retention and tank compatibility is supporting adoption across established spray programs.
Which function segment holds a notable nutrient loss reducers share in 2026?
FMI finds that efficacy enhancement will hold 42.0% of function demand in 2026. Growers are selecting products that improve performance of nutrients already included in the crop program.
Which country has a notable nutrient loss reducers expansion outlook during the forecast period?
Future Market Insights predicts USA to expand at an 8.7% CAGR during the 2026 to 2036 assessment period. Established retailer channels and detailed application planning are supporting product selection across nutrient programs.
Which companies are active in the Nutrient Loss Reducers Market during 2026?
Notable companies include Stepan Company, Evonik, Syensqo, Wilbur-Ellis, Helena Agri-Enterprises, Precision Laboratories, WinField United, and Brandt. These companies provide formulation chemistry, nutrient programs, application products, distribution and technical support.
Preview the report firsthand - request a free sample
Get SampleGet the brochure for pricing and purchase details.
Get PDFTable of Content
- Key Takeaways
- Market Size and CAGR
- Top Growth Driver
- Fastest Growing Segment
- Leading Region
- Key Companies
- Emerging Opportunities
- Executive Summary
- Global Market Outlook
- Demand-side Trends
- Supply-side Trends
- Technology Roadmap Analysis
- Analysis and Recommendations
- Analyst Perspective (What is happening? Why now? What should investors know?)
- Key Questions Answered
- How large is the market?
- What is the CAGR?
- What are key trends?
- Which region dominates?
- Who are the leaders?
- Market Overview
- Market Coverage / Taxonomy
- Market Definition / Scope / Limitations
- Research Methodology
- Chapter Orientation
- Analytical Lens and Working Hypotheses
- Market Structure, Signals, and Trend Drivers
- Benchmarking and Cross-market Comparability
- Market Sizing, Forecasting, and Opportunity Mapping
- Research Design and Evidence Framework
- Desk Research Programme (Secondary Evidence)
- Expert Input and Fieldwork (Primary Evidence)
- Tooling, Models, and Reference Databases
- Data Engineering and Model Build
- Quality Assurance and Audit Trail
- Market Background
- Market Dynamics (Drivers, Restraints, Opportunity, Trends)
- Scenario Forecast (Optimistic, Likely, Conservative)
- Impact Analysis
- AI Impact
- Sustainability Impact
- Regulatory Impact
- Technology Impact
- Consumer / Buyer Analysis
- Purchase Drivers
- Adoption Barriers
- Buyer Journey
- Opportunity Map Analysis
- Product Life Cycle Analysis
- Supply Chain Analysis
- Investment Feasibility Matrix
- Value Chain Analysis
- PESTLE and Porter's Analysis
- Regulatory Landscape
- Regional Parent Market Outlook
- Production and Consumption Statistics
- Import and Export Statistics
- Global Market Analysis and Forecast, 2021 to 2036
- Historical Market Size Value (USD Million) Analysis, 2021 to 2025
- Current and Future Market Size Value (USD Million) Projections, 2026 to 2036
- Y-o-Y Growth Trend Analysis
- Absolute $ Opportunity Analysis
- Global Market Pricing Analysis, 2021 to 2036
- Global Market Analysis and Forecast, By Product Type, 2021 to 2036
- Introduction / Key Findings
- Historical Market Size Value (USD Million) Analysis By Product Type, 2021 to 2025
- Current and Future Market Size Value (USD Million) Analysis and Forecast By Product Type, 2026 to 2036
- Surfactant-based
- Oil-based
- Polymers
- Carrier-based
- Others
- Y-o-Y Growth Trend Analysis By Product Type, 2021 to 2025
- Absolute $ Opportunity Analysis By Product Type, 2026 to 2036
- Global Market Analysis and Forecast, By Function, 2021 to 2036
- Introduction / Key Findings
- Historical Market Size Value (USD Million) Analysis By Function, 2021 to 2025
- Current and Future Market Size Value (USD Million) Analysis and Forecast By Function, 2026 to 2036
- Efficacy enhancement
- Loss and drift reduction
- Handling and compatibility
- Others
- Y-o-Y Growth Trend Analysis By Function, 2021 to 2025
- Absolute $ Opportunity Analysis By Function, 2026 to 2036
- Global Market Analysis and Forecast, By Crop Type, 2021 to 2036
- Introduction / Key Findings
- Historical Market Size Value (USD Million) Analysis By Crop Type, 2021 to 2025
- Current and Future Market Size Value (USD Million) Analysis and Forecast By Crop Type, 2026 to 2036
- Cereals and grains
- Fruits and vegetables
- Oilseeds and pulses
- Turf and ornamentals
- Others
- Y-o-Y Growth Trend Analysis By Crop Type, 2021 to 2025
- Absolute $ Opportunity Analysis By Crop Type, 2026 to 2036
- Global Market Analysis and Forecast, By Application Method, 2021 to 2036
- Introduction / Key Findings
- Historical Market Size Value (USD Million) Analysis By Application Method, 2021 to 2025
- Current and Future Market Size Value (USD Million) Analysis and Forecast By Application Method, 2026 to 2036
- Foliar tank-mix
- Granule and dry-blend
- Fertigation
- Others
- Y-o-Y Growth Trend Analysis By Application Method, 2021 to 2025
- Absolute $ Opportunity Analysis By Application Method, 2026 to 2036
- Global Market Analysis and Forecast, By Sales Channel, 2021 to 2036
- Introduction / Key Findings
- Historical Market Size Value (USD Million) Analysis By Sales Channel, 2021 to 2025
- Current and Future Market Size Value (USD Million) Analysis and Forecast By Sales Channel, 2026 to 2036
- Agri-input distributors
- Direct and online
- Retail ag-stores
- Others
- Y-o-Y Growth Trend Analysis By Sales Channel, 2021 to 2025
- Absolute $ Opportunity Analysis By Sales Channel, 2026 to 2036
- Global Market Analysis and Forecast, By Region, 2021 to 2036
- Introduction
- Historical Market Size Value (USD Million) Analysis By Region, 2021 to 2025
- Current Market Size Value (USD Million) Analysis and Forecast By Region, 2026 to 2036
- North America
- Latin America
- Western Europe
- Eastern Europe
- East Asia
- South Asia and Pacific
- Middle East and Africa
- Market Attractiveness Analysis By Region
- North America Market Analysis and Forecast, By Country, 2021 to 2036
- Historical Market Size Value (USD Million) Trend Analysis By Market Taxonomy, 2021 to 2025
- Market Size Value (USD Million) Forecast By Market Taxonomy, 2026 to 2036
- By Country
- United States
- Canada
- By Product Type
- By Function
- By Crop Type
- By Application Method
- By Sales Channel
- By Country
- Market Attractiveness Analysis
- By Country
- By Product Type
- By Function
- By Crop Type
- By Application Method
- By Sales Channel
- Key Takeaways
- Latin America Market Analysis and Forecast, By Country
- Historical Market Size Value (USD Million) Trend Analysis By Market Taxonomy, 2021 to 2025
- Market Size Value (USD Million) Forecast By Market Taxonomy, 2026 to 2036
- By Country
- Brazil
- Mexico
- Argentina
- Chile
- By Product Type
- By Function
- By Crop Type
- By Application Method
- By Sales Channel
- By Country
- Market Attractiveness Analysis
- By Country
- By Product Type
- By Function
- By Crop Type
- By Application Method
- By Sales Channel
- Key Takeaways
- Western Europe Market Analysis and Forecast, By Country
- Historical Market Size Value (USD Million) Trend Analysis By Market Taxonomy, 2021 to 2025
- Market Size Value (USD Million) Forecast By Market Taxonomy, 2026 to 2036
- By Country
- Germany
- France
- United Kingdom
- Italy
- Spain
- Benelux
- Nordics
- By Product Type
- By Function
- By Crop Type
- By Application Method
- By Sales Channel
- By Country
- Market Attractiveness Analysis
- By Country
- By Product Type
- By Function
- By Crop Type
- By Application Method
- By Sales Channel
- Key Takeaways
- Eastern Europe Market Analysis and Forecast, By Country
- Historical Market Size Value (USD Million) Trend Analysis By Market Taxonomy, 2021 to 2025
- Market Size Value (USD Million) Forecast By Market Taxonomy, 2026 to 2036
- By Country
- Poland
- Czech Republic
- Romania
- Hungary
- By Product Type
- By Function
- By Crop Type
- By Application Method
- By Sales Channel
- By Country
- Market Attractiveness Analysis
- By Country
- By Product Type
- By Function
- By Crop Type
- By Application Method
- By Sales Channel
- Key Takeaways
- East Asia Market Analysis and Forecast, By Country
- Historical Market Size Value (USD Million) Trend Analysis By Market Taxonomy, 2021 to 2025
- Market Size Value (USD Million) Forecast By Market Taxonomy, 2026 to 2036
- By Country
- China
- Japan
- South Korea
- By Product Type
- By Function
- By Crop Type
- By Application Method
- By Sales Channel
- By Country
- Market Attractiveness Analysis
- By Country
- By Product Type
- By Function
- By Crop Type
- By Application Method
- By Sales Channel
- Key Takeaways
- South Asia and Pacific Market Analysis and Forecast, By Country
- Historical Market Size Value (USD Million) Trend Analysis By Market Taxonomy, 2021 to 2025
- Market Size Value (USD Million) Forecast By Market Taxonomy, 2026 to 2036
- By Country
- India
- ASEAN
- Australia and New Zealand
- By Product Type
- By Function
- By Crop Type
- By Application Method
- By Sales Channel
- By Country
- Market Attractiveness Analysis
- By Country
- By Product Type
- By Function
- By Crop Type
- By Application Method
- By Sales Channel
- Key Takeaways
- Middle East and Africa Market Analysis and Forecast, By Country
- Historical Market Size Value (USD Million) Trend Analysis By Market Taxonomy, 2021 to 2025
- Market Size Value (USD Million) Forecast By Market Taxonomy, 2026 to 2036
- By Country
- GCC Countries
- South Africa
- Türkiye
- Israel
- By Product Type
- By Function
- By Crop Type
- By Application Method
- By Sales Channel
- By Country
- Market Attractiveness Analysis
- By Country
- By Product Type
- By Function
- By Crop Type
- By Application Method
- By Sales Channel
- Key Takeaways
- Key Countries Market Analysis
- United States
- Pricing Analysis
- Market Share Analysis, 2025
- By Product Type
- By Function
- By Crop Type
- By Application Method
- By Sales Channel
- Canada
- Pricing Analysis
- Market Share Analysis, 2025
- By Product Type
- By Function
- By Crop Type
- By Application Method
- By Sales Channel
- Mexico
- Pricing Analysis
- Market Share Analysis, 2025
- By Product Type
- By Function
- By Crop Type
- By Application Method
- By Sales Channel
- Brazil
- Pricing Analysis
- Market Share Analysis, 2025
- By Product Type
- By Function
- By Crop Type
- By Application Method
- By Sales Channel
- Chile
- Pricing Analysis
- Market Share Analysis, 2025
- By Product Type
- By Function
- By Crop Type
- By Application Method
- By Sales Channel
- Germany
- Pricing Analysis
- Market Share Analysis, 2025
- By Product Type
- By Function
- By Crop Type
- By Application Method
- By Sales Channel
- United Kingdom
- Pricing Analysis
- Market Share Analysis, 2025
- By Product Type
- By Function
- By Crop Type
- By Application Method
- By Sales Channel
- Italy
- Pricing Analysis
- Market Share Analysis, 2025
- By Product Type
- By Function
- By Crop Type
- By Application Method
- By Sales Channel
- Spain
- Pricing Analysis
- Market Share Analysis, 2025
- By Product Type
- By Function
- By Crop Type
- By Application Method
- By Sales Channel
- France
- Pricing Analysis
- Market Share Analysis, 2025
- By Product Type
- By Function
- By Crop Type
- By Application Method
- By Sales Channel
- India
- Pricing Analysis
- Market Share Analysis, 2025
- By Product Type
- By Function
- By Crop Type
- By Application Method
- By Sales Channel
- ASEAN
- Pricing Analysis
- Market Share Analysis, 2025
- By Product Type
- By Function
- By Crop Type
- By Application Method
- By Sales Channel
- Australia and New Zealand
- Pricing Analysis
- Market Share Analysis, 2025
- By Product Type
- By Function
- By Crop Type
- By Application Method
- By Sales Channel
- China
- Pricing Analysis
- Market Share Analysis, 2025
- By Product Type
- By Function
- By Crop Type
- By Application Method
- By Sales Channel
- Japan
- Pricing Analysis
- Market Share Analysis, 2025
- By Product Type
- By Function
- By Crop Type
- By Application Method
- By Sales Channel
- South Korea
- Pricing Analysis
- Market Share Analysis, 2025
- By Product Type
- By Function
- By Crop Type
- By Application Method
- By Sales Channel
- Poland
- Pricing Analysis
- Market Share Analysis, 2025
- By Product Type
- By Function
- By Crop Type
- By Application Method
- By Sales Channel
- Hungary
- Pricing Analysis
- Market Share Analysis, 2025
- By Product Type
- By Function
- By Crop Type
- By Application Method
- By Sales Channel
- Türkiye
- Pricing Analysis
- Market Share Analysis, 2025
- By Product Type
- By Function
- By Crop Type
- By Application Method
- By Sales Channel
- South Africa
- Pricing Analysis
- Market Share Analysis, 2025
- By Product Type
- By Function
- By Crop Type
- By Application Method
- By Sales Channel
- United States
- Market Structure Analysis
- Competition Dashboard
- Competition Benchmarking
- Market Share Analysis of Top Players
- By Regional
- By Product Type
- By Function
- By Crop Type
- By Application Method
- By Sales Channel
- Emerging Startups
- Innovation Benchmarking
- Competition Analysis
- Competition Deep Dive
- Stepan Company
- Overview
- Product Portfolio
- Profitability by Market Segments
- Sales Footprint
- Strategy Overview
- Marketing Strategy
- Product Strategy
- Channel Strategy
- Evonik
- Syensqo
- Wilbur-Ellis
- Helena Agri-Enterprises
- Precision Laboratories
- WinField United
- Brandt
- Stepan Company
- Case Studies
- Success Stories
- Recent Developments
- Competition Deep Dive
- Assumptions & Acronyms Used


