The global oriented perforating system market is projected to reach USD 1,019.0 million by 2035, recording an absolute increase of USD 337.2 million over the forecast period. The market is valued at USD 681.8 million in 2025 and is projected to grow at a CAGR of 4.1% during the forecast period.
The market size is expected to grow by nearly 1.49 times during the same period, supported by increasing demand for enhanced oil recovery techniques, expanding horizontal drilling operations, and growing adoption of precision perforation technologies across global oil and gas production activities. Market expansion faces constraints from volatile energy prices and technical complexity requirements in deepwater and unconventional drilling environments.
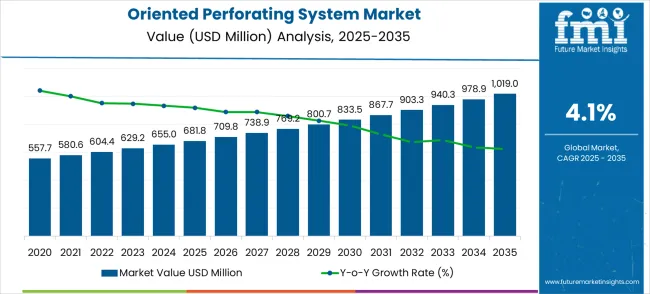
Between 2025 and 2030, the oriented perforating system market is projected to expand from USD 681.8 million to USD 833.5 million, resulting in a value increase of USD 151.7 million, which represents 45.0% of the total forecast growth for the decade.
This phase of growth will be shaped by rising demand for enhanced well completion technologies, product innovation in consumable and semi-consumable perforating systems, and expanding applications across horizontal drilling and unconventional resource development projects. Companies are establishing competitive positions through investment in precision perforating technology development, strategic partnerships with drilling contractors, and market expansion across offshore drilling operations, shale gas developments, and emerging oil and gas exploration regions.
From 2030 to 2035, the market is forecast to grow from USD 833.5 million to USD 1,019.0 million, adding another USD 185.5 million, which constitutes 55.0% of the ten-year expansion. This period is expected to be characterized by the expansion of specialized perforating solutions, including smart perforating systems and environmentally optimized technologies tailored for specific drilling environments, strategic collaborations between service providers and drilling technology developers, and enhanced integration with digital drilling platforms and automated well completion systems.
The growing focus on maximizing hydrocarbon recovery and optimizing well productivity will drive demand for advanced, oriented perforating capabilities across diverse oil and gas production applications.
| Metric | Value |
|---|---|
| Market Value (2025) | USD 681.8 million |
| Market Forecast Value (2035) | USD 1,019.0 million |
| Forecast CAGR (2025 to 2035) | 4.1% |
The oriented perforating system market grows by enabling oil and gas operators and drilling service companies to achieve enhanced well productivity through precise perforating placement that optimizes hydrocarbon flow and reduces formation damage.
Demand drivers include expanding horizontal well drilling requiring specialized perforation techniques, increasing vertical well optimization for mature field development, and growing adoption of enhanced oil recovery methods where precise perforating placement supports reservoir management objectives.
Priority segments include major oil companies and drilling service providers, with China and India representing key growth geographies due to expanding domestic energy production capabilities and increasing unconventional resource development activities. Market growth faces constraints from volatile oil prices affecting capital expenditure decisions and the need for specialized technical expertise to operate advanced perforating systems in challenging drilling environments.
The Oriented Perforating System market is entering a technology-driven growth phase, driven by demand for enhanced oil recovery, expanding unconventional resource development, and evolving drilling efficiency standards across global energy markets. By 2035, these pathways together can unlock USD 480-620 million in incremental revenue opportunities beyond baseline growth.
Pathway A - Horizontal Well Dominance (Unconventional Resource Development) The horizontal well segment already holds the largest share due to its critical role in shale gas extraction and tight oil production. Expanding precision perforating capabilities, automated deployment systems, and multi-stage completion integration can consolidate leadership. Opportunity pool: USD 140-180 million.
Pathway B - Consumable System Optimization (Cost-Effective Solutions). Consumable perforating systems account for significant market demand. Growing requirements for cost-effective perforating solutions, especially in volume drilling operations, will drive higher adoption of optimized consumable systems. Opportunity pool: USD 110-140 million.
Pathway C - China & India Market Expansion (Domestic Energy Development) China and India present the highest growth potential with CAGRs of 5.5% and 5.1% respectively. Targeting expanding domestic oil and gas production and government energy security initiatives will accelerate adoption. Opportunity pool: USD 85-110 million.
Pathway D - Semi-Consumable Technology Innovation With increasing demand for operational flexibility, there is an opportunity to promote advanced semi-consumable systems optimized for reusable deployment and enhanced cost efficiency. Opportunity pool: USD 70-90 million.
Pathway E - Smart Perforating Systems Advanced digital integration, automated deployment, and real-time monitoring capabilities can create opportunities for next-generation perforating solutions with enhanced precision and operational efficiency. Opportunity pool: USD 55-70 million.
Pathway F - Deepwater and Offshore Applications Systems optimized for challenging deepwater environments, high-pressure applications, and complex offshore drilling operations offer premium positioning for specialized market segments. Opportunity pool: USD 40-52 million.
Pathway G - Enhanced Oil Recovery Integration Specialized perforating systems designed for mature field development, enhanced oil recovery techniques, and reservoir optimization can capture growing demand for production maximization. Opportunity pool: USD 30-40 million.
Pathway H - Environmental and Safety Solutions Advanced perforating technologies focusing on environmental compliance, safety enhancement, and reduced environmental impact create opportunities for drilling operations. Opportunity pool: USD 20-28 million.
The market is segmented by product type, application, end-user, technology, and region. By product type, the market is divided into consumable, semi-consumable, and recyclable perforating systems. Based on application, the market is categorized into horizontal well and vertical well operations. Regionally, the market is divided into North America, Latin America, Europe, East Asia, South Asia & Pacific, and Middle East & Africa.
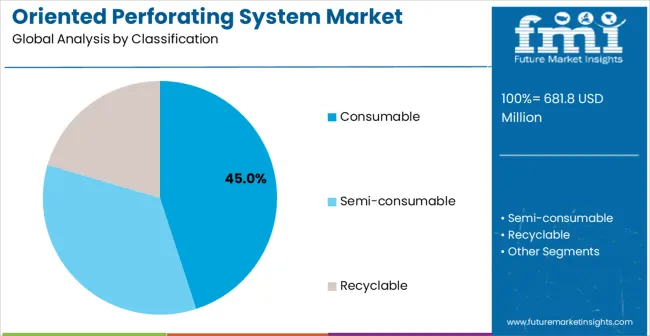
Consumable perforating systems are projected to account for a substantial portion of 45% of the oriented perforating system market in 2025. This share is supported by cost-effective deployment characteristics and proven reliability in standard drilling operations. Consumable systems provide reliable perforation performance with established manufacturing processes that enable competitive pricing for volume applications. The segment enables stakeholders to benefit from simplified logistics and reduced operational complexity for conventional well completion requirements.
The dominance of consumable systems stems from their straightforward operational model and established market acceptance across diverse drilling environments. Oil and gas operators prefer consumable systems for routine perforating operations due to their predictable performance characteristics and standardized deployment procedures.
These systems eliminate the need for complex retrieval operations, reducing operational time and associated costs while minimizing downhole risks. Manufacturing economies of scale in consumable system production have driven down unit costs, making them particularly attractive for high-volume drilling programs and cost-sensitive applications.
The established supply chain infrastructure supporting consumable systems ensures reliable availability and technical support across major drilling markets. The simplified training requirements for field personnel operating consumable systems contribute to their widespread adoption, particularly in regions with developing technical capabilities. As drilling activity continues to expand globally, consumable systems remain the preferred choice for operators seeking reliable, cost-effective perforating solutions that minimize operational complexity while delivering consistent performance results.
Key factors supporting consumable system adoption:
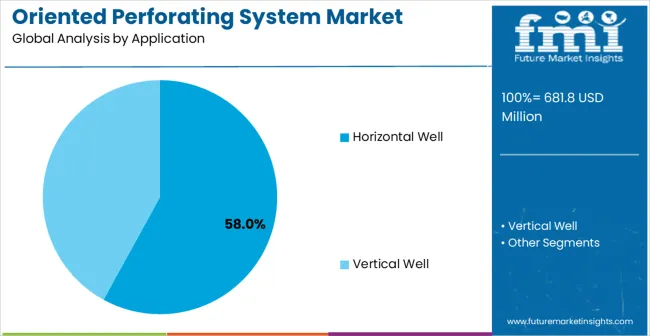
Horizontal well applications are expected to represent the largest share of 58% of the oriented perforating system applications in 2025. This dominant share reflects the critical need for precise perforation placement in horizontal drilling operations that appeals to oil and gas operators and drilling contractors.
The segment provides essential technical support for maximizing hydrocarbon recovery and optimizing well productivity in unconventional resource developments. Growing demand for shale gas extraction and tight oil production drives adoption in this application area.
The horizontal well segment's market leadership is fundamentally driven by the transformation of global oil and gas production toward unconventional resources, where horizontal drilling has become the primary extraction method. Unlike vertical wells, horizontal drilling requires sophisticated perforating systems capable of creating optimally oriented perforations along extended wellbore sections, often exceeding several kilometers in length.
The precision placement requirements in horizontal wells demand advanced oriented perforating technologies that can maintain accuracy across varying geological conditions and wellbore trajectories. Multi-stage hydraulic fracturing operations, predominantly used in horizontal wells, rely heavily on oriented perforating systems to create optimal fracture initiation points that maximize reservoir contact and hydrocarbon flow rates.
The economic viability of unconventional resource development directly depends on the effectiveness of perforating operations, making oriented systems indispensable for operators seeking to optimize production economics. The ongoing expansion of horizontal drilling into new geographical regions and geological formations continues to drive demand for specialized perforating solutions tailored to specific reservoir characteristics and completion strategies.
Horizontal Well segment advantages include:
Market drivers include expanding unconventional resource development requiring specialized perforation techniques, increasing horizontal drilling operations where oriented systems support enhanced hydrocarbon recovery, and growing adoption of enhanced oil recovery methods where precise perforating placement optimizes reservoir management and production efficiency. These drivers reflect direct operational outcomes including improved well productivity, reduced formation damage, and enhanced recovery rates across multiple drilling environments.
Market restraints encompass volatile oil and gas prices that limit capital expenditure on advanced drilling technologies, technical complexity requiring specialized operator training and expertise in challenging drilling conditions, and long technology qualification cycles for critical applications that slow market penetration. Additional constraints include integration challenges with existing drilling equipment and the need for continuous technical support that increases operational costs and complexity.
Key trends show adoption accelerating in China and India where expanding domestic energy production and unconventional resource development drive demand, while technology shifts toward smart perforating systems and environmentally optimized solutions enable broader market access. Technology advancement focuses on enhanced precision and automated deployment capabilities that expand application possibilities across demanding drilling environments. Market thesis faces risk from alternative well completion technologies that could provide similar productivity benefits at lower costs or with simplified operational requirements.
| Country | CAGR (2025 to 2035) |
|---|---|
| China | 5.5% |
| India | 5.1% |
| Germany | 4.7% |
| Brazil | 4.3% |
| USA | 3.9% |
| UK | 3.5% |
| Japan | 3.1% |
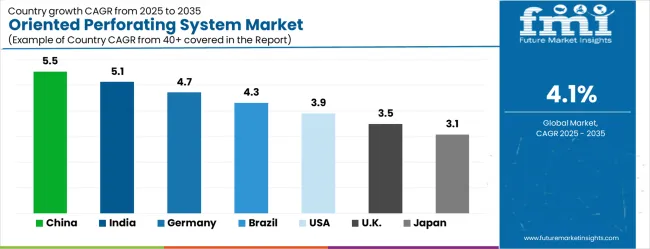
The oriented perforating system market shows moderate but consistent growth dynamics across key countries from 2025–2035. China leads globally with a CAGR of 5.5%, fueled by expanding domestic oil and gas production, government energy security initiatives, and growing unconventional resource development activities. India follows closely at 5.1%, driven by increasing energy demand, domestic drilling activities, and growing adoption of advanced well completion technologies.
Germany maintains Europe's leadership with 4.7%, leveraging its established energy technology sector and offshore drilling operations in the North Sea region. Brazil records 4.3%, reflecting opportunities in deepwater drilling and pre-salt reservoir development despite economic and regulatory challenges.
The United States maintains steady expansion at 3.9%, supported by mature shale gas operations and continued unconventional resource development. Growth in the United Kingdom (3.5%) and Japan (3.1%) remains stable, backed by established energy companies and offshore drilling activities, though comparatively slower than emerging energy markets.
The report covers an in-depth analysis of 40+ countries; 7 top-performing countries are highlighted below.
China demonstrates the strongest growth potential in the oriented perforating system market with its expanding domestic energy production capabilities and substantial government investment in oil and gas development technologies.
The market is projected to grow at a CAGR of 5.5% through 2035, driven by increasing unconventional resource development, expanding horizontal drilling operations, and growing adoption across state-owned oil companies in Beijing, Tianjin, and Xinjiang regions.
Chinese energy operators are adopting oriented perforating systems for shale gas development and enhanced oil recovery applications, with particular focus on cost-effective deployment and operational efficiency optimization. Government support for energy security initiatives and domestic technology development expand deployment across onshore drilling projects and unconventional resource exploration activities.
India's oriented perforating system market reflects strong potential based on expanding domestic energy demand and increasing oil and gas exploration activities. The market is projected to grow at a CAGR of 5.1% through 2035, with growth accelerating through cost-effective technology deployment under energy security and production optimization constraints, particularly in onshore drilling operations and enhanced oil recovery projects in Gujarat, Rajasthan, and Assam.
Indian energy companies and drilling contractors are adopting oriented perforating systems for well productivity enhancement and resource optimization applications, with a growing focus on operational efficiency and cost-effective deployment. Strategic partnerships with international service providers expand access to advanced perforating technologies and technical expertise.
Germany demonstrates established strength in the oriented perforating system market through its advanced energy technology sector and established offshore drilling operations. The market shows steady growth at a CAGR of 4.7% through 2035, with established energy service companies and technology providers driving demand in Hamburg, Bremen, and offshore North Sea operations.
German energy companies focus on offshore drilling applications and enhanced oil recovery systems, particularly in mature field development requiring sophisticated perforating placement capabilities. The country's strong engineering capabilities and established supplier relationships support consistent market development across multiple drilling applications.
Brazil's oriented perforating system market shows significant growth potential at a CAGR of 4.3% through 2035, driven by expanding deepwater drilling activities and pre-salt reservoir development projects. The market benefits from increasing offshore oil production and advanced drilling technologies, with particular strength in challenging deepwater environments.
Brazilian energy operators and international drilling contractors adopt oriented perforating systems for complex well completion applications and enhanced hydrocarbon recovery, addressing both technical and commercial requirements. Market development benefits from established offshore drilling infrastructure and expanding pre-salt production capabilities.
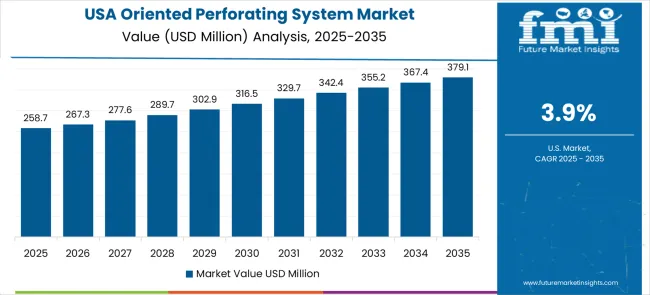
The United States maintains steady growth in the oriented perforating system market through its established shale gas operations and mature drilling service infrastructure. Market expansion at a CAGR of 3.9% through 2035 reflects consistent demand from energy operators, drilling contractors, and oilfield service companies requiring advanced perforating capabilities.
American energy organizations utilize oriented perforating systems across unconventional resource development, horizontal drilling, and enhanced oil recovery applications, with particular focus on operational efficiency and cost optimization. The country's strong energy sector investment and established service networks support stable market conditions and continued technology advancement.
The United Kingdom demonstrates consistent progress in the oriented perforating system market with a CAGR of 3.5% through 2035, supported by established offshore drilling operations and North Sea energy development activities.
British energy companies and drilling contractors adopt oriented perforating systems for offshore well completion and mature field development applications, with particular focus on operational efficiency and environmental compliance requirements. The market benefits from strong offshore drilling expertise and established relationships with international service providers. Development remains steady across multiple offshore applications despite energy transition uncertainties affecting long-term drilling investment decisions.
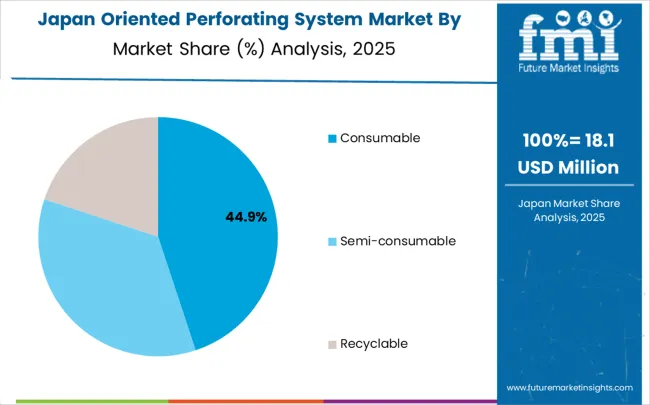
Japan's oriented perforating system market shows steady development with a CAGR of 3.1% through 2035, as established energy companies and technology manufacturers maintain consistent demand. Market growth reflects mature market conditions and established drilling capabilities across energy and industrial sectors.
Japanese energy companies and drilling contractors utilize oriented perforating systems for precision drilling applications and offshore energy development, particularly in challenging offshore environments. The market benefits from domestic technology manufacturing capabilities and strong technical support infrastructure, though growth remains moderate compared to emerging energy production markets.
The oriented perforating system market operates with a highly concentrated structure featuring approximately 10-12 meaningful players, with the top five companies holding roughly 75-80% market share. Competition centers on technological innovation, service reliability, and comprehensive field support capabilities rather than price competition alone.
Market leaders include SLB, Weatherford, and Baker Hughes, which maintain competitive positions through established global service networks, comprehensive product portfolios, and strong research and development capabilities. These companies benefit from scale advantages in manufacturing, extensive field service networks, and established relationships with key oil and gas operators and drilling contractors worldwide.
Challenger companies include Halliburton, NOV, and Expro Group, which compete through specialized perforating solutions and regional service focus, particularly in specific drilling applications or geographic markets. These companies differentiate through innovative perforating technologies, competitive service strategies, and targeted customer relationship approaches.
Core Laboratories, Hunting, DMC Global, FHE USA LLC, LandSea Technical Services, G&H Diversified Manufacturing, Promperforator, and SWM Technologies represent additional significant players with established presence in drilling services markets and strong technical capabilities in perforating and well completion technologies.
Competition intensifies around service innovation, with companies investing in smart perforating systems, enhanced precision capabilities, and integrated field service platforms that improve drilling efficiency and operational outcomes.
Market dynamics reflect the importance of field service support, technical expertise, and ongoing maintenance capabilities that influence operator purchasing decisions. Strategic partnerships with drilling contractors and energy operators shape competitive positioning across different regional markets and drilling environments.
| Item | Value |
|---|---|
| Quantitative Units | USD 681.8 million |
| Product Type | Consumable, Semi-consumable, Recyclable |
| Application | Horizontal Well, Vertical Well |
| Regions Covered | North America, Latin America, Europe, East Asia, South Asia & Pacific, Middle East & Africa |
| Country Covered | China, India, Germany, Brazil, United States, United Kingdom, Japan, and 40+ additional countries |
| Key Companies Profiled | SLB, Weatherford, Baker Hughes, Halliburton, NOV, Expro Group, Core Laboratories, Hunting, DMC Global, FHE USA LLC, LandSea Technical Services, G&H Diversified Manufacturing, Promperforator, SWM Technologies |
| Additional Attributes | Dollar sales by application categories, regional demand trends across North America, Europe, and Asia-Pacific, competitive landscape with established players and emerging companies, adoption patterns across oil and gas operators and drilling contractors, integration with horizontal drilling systems and enhanced oil recovery techniques, innovations in consumable and semi-consumable perforating technologies, and development of specialized oriented perforating solutions with enhanced precision and operational efficiency capabilities. |
The global oriented perforating system market is estimated to be valued at USD 681.8 million in 2025.
The market size for the oriented perforating system market is projected to reach USD 1,019.0 million by 2035.
The oriented perforating system market is expected to grow at a 4.1% CAGR between 2025 and 2035.
The key product types in oriented perforating system market are consumable, semi-consumable and recyclable.
In terms of application, horizontal well segment to command 58.0% share in the oriented perforating system market in 2025.


Our Research Products

The "Full Research Suite" delivers actionable market intel, deep dives on markets or technologies, so clients act faster, cut risk, and unlock growth.

The Leaderboard benchmarks and ranks top vendors, classifying them as Established Leaders, Leading Challengers, or Disruptors & Challengers.

Locates where complements amplify value and substitutes erode it, forecasting net impact by horizon

We deliver granular, decision-grade intel: market sizing, 5-year forecasts, pricing, adoption, usage, revenue, and operational KPIs—plus competitor tracking, regulation, and value chains—across 60 countries broadly.

Spot the shifts before they hit your P&L. We track inflection points, adoption curves, pricing moves, and ecosystem plays to show where demand is heading, why it is changing, and what to do next across high-growth markets and disruptive tech

Real-time reads of user behavior. We track shifting priorities, perceptions of today’s and next-gen services, and provider experience, then pace how fast tech moves from trial to adoption, blending buyer, consumer, and channel inputs with social signals (#WhySwitch, #UX).

Partner with our analyst team to build a custom report designed around your business priorities. From analysing market trends to assessing competitors or crafting bespoke datasets, we tailor insights to your needs.
Supplier Intelligence
Discovery & Profiling
Capacity & Footprint
Performance & Risk
Compliance & Governance
Commercial Readiness
Who Supplies Whom
Scorecards & Shortlists
Playbooks & Docs
Category Intelligence
Definition & Scope
Demand & Use Cases
Cost Drivers
Market Structure
Supply Chain Map
Trade & Policy
Operating Norms
Deliverables
Buyer Intelligence
Account Basics
Spend & Scope
Procurement Model
Vendor Requirements
Terms & Policies
Entry Strategy
Pain Points & Triggers
Outputs
Pricing Analysis
Benchmarks
Trends
Should-Cost
Indexation
Landed Cost
Commercial Terms
Deliverables
Brand Analysis
Positioning & Value Prop
Share & Presence
Customer Evidence
Go-to-Market
Digital & Reputation
Compliance & Trust
KPIs & Gaps
Outputs
Full Research Suite comprises of:
Market outlook & trends analysis
Interviews & case studies
Strategic recommendations
Vendor profiles & capabilities analysis
5-year forecasts
8 regions and 60+ country-level data splits
Market segment data splits
12 months of continuous data updates
DELIVERED AS:
PDF EXCEL ONLINE
Perforating Guns Market Size and Share Forecast Outlook 2025 to 2035
System-On-Package Market Size and Share Forecast Outlook 2025 to 2035
Systems Administration Management Tools Market Size and Share Forecast Outlook 2025 to 2035
Systemic Sclerosis Treatment Market - Trends & Forecast 2025 to 2035
Perforating Roller Market Analysis by End Use Industry, Material, and Region: Forecast for 2025 to 2035
System on Module Market Growth – Trends & Forecast 2025 to 2035
SLE Drugs Market Insights - Growth & Forecast 2025 to 2035
Systemic Mastocytosis Treatment Market
Systemic Infection Treatment Market
5G System Integration Market Insights - Demand & Growth Forecast 2025 to 2035
VRF Systems Market Growth - Trends & Forecast 2025 to 2035
Rail System Dryer Market Size and Share Forecast Outlook 2025 to 2035
HVAC System Analyzer Market Size and Share Forecast Outlook 2025 to 2035
DWDM System Market Analysis by Services, Product, Vertical, and Region – Growth, Trends, and Forecast from 2025 to 2035
Brake System Market Size and Share Forecast Outlook 2025 to 2035
Cloud Systems Management Software Market Size and Share Forecast Outlook 2025 to 2035
Hi-Fi Systems Market Size and Share Forecast Outlook 2025 to 2035
X-ray System Market Analysis - Size, Share, and Forecast 2025 to 2035
Power System Simulator Market Growth - Trends & Forecast 2025 to 2035
Cough systems Market

Thank you!
You will receive an email from our Business Development Manager. Please be sure to check your SPAM/JUNK folder too.
Chat With
MaRIA