The Orthopedic Prosthetics market is experiencing steady growth driven by the rising prevalence of musculoskeletal disorders, trauma cases, and orthopedic injuries across both developed and emerging regions. The future outlook for this market is shaped by continuous advancements in prosthetic design, materials, and software-enabled customization, which enhance patient comfort, functionality, and mobility. Increasing investments in healthcare infrastructure, rehabilitation centers, and specialized orthopedic clinics support the adoption of advanced prosthetic solutions.
Growing awareness about quality of life improvements and rehabilitation benefits among patients and healthcare providers is further propelling market expansion. The market is also influenced by an aging global population, higher incidence of diabetes and osteoarthritis, and the resulting limb amputations or joint impairments, creating sustained demand for orthopedic prosthetics.
Furthermore, technological innovations in lightweight materials, bio-compatible components, and 3D printing applications are driving more personalized and efficient prosthetic solutions As healthcare systems continue to prioritize patient outcomes and functional mobility, the Orthopedic Prosthetics market is expected to witness continued growth over the forecast period.
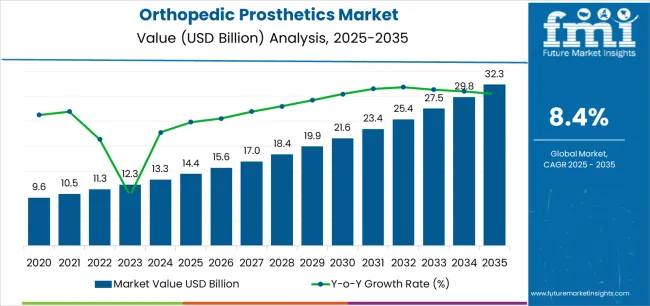
| Metric | Value |
|---|---|
| Orthopedic Prosthetics Market Estimated Value in (2025 E) | USD 14.4 billion |
| Orthopedic Prosthetics Market Forecast Value in (2035 F) | USD 32.3 billion |
| Forecast CAGR (2025 to 2035) | 8.4% |
The market is segmented by Product Type, Application, Sales Channel, Form, Functionality, and Product Claim and region. By Product Type, the market is divided into Probiotics, Prebiotics, Postbiotics, Synbiotics, and Enzyme Blends. In terms of Application, the market is classified into Digestive Health, Immune Support, Metabolic Health, Mental Wellbeing, Antibiotic Recovery, and Inflammatory Conditions (IBD, IBS). Based on Sales Channel, the market is segmented into Prescription Supplements (Rx) / Institutional Sales (Hospital and Clinics), Over the Counter Supplements (OTC), and Online. By Form, the market is divided into Capsules, Gummies, Powders, Beverages, Softgels, and Sachets. By Functionality, the market is segmented into Targeted Release, Multi-Strain, Allergen-Free, Vegan/Plant-Based, and DNA-Based Personalization. By Product Claim, the market is segmented into Clinically Studied, Clean Label, Non-GMO, Shelf-Stable, and Doctor Recommended. Regionally, the market is classified into North America, Latin America, Western Europe, Eastern Europe, Balkan & Baltic Countries, Russia & Belarus, Central Asia, East Asia, South Asia & Pacific, and the Middle East & Africa.
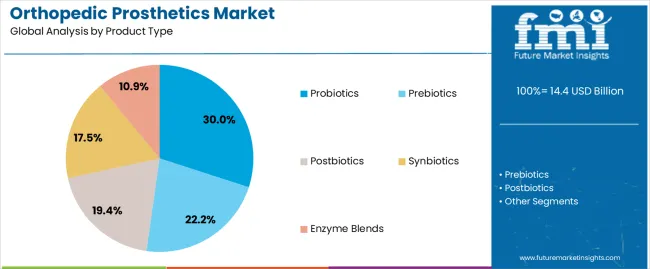
The probiotics product type segment is projected to hold 30.0% of the Orthopedic Prosthetics market revenue share in 2025, establishing it as a leading product category. This growth is driven by the increasing recognition of probiotics’ role in improving overall digestive health, immunity, and nutrient absorption, which supports bone and joint health indirectly.
The segment has benefited from the integration of advanced formulations and targeted probiotic strains that enhance efficacy for patients undergoing orthopedic rehabilitation. Rising awareness among healthcare providers and patients about the benefits of probiotics in supporting recovery and reducing gastrointestinal complications from medications has further reinforced adoption.
Additionally, the segment’s growth is supported by the convenience of oral supplementation, cost-effectiveness, and wide availability through institutional and prescription channels, which ensures consistent patient compliance Continuous innovation in delivery mechanisms and formulations tailored to orthopedic patients is expected to sustain the dominance of this segment.
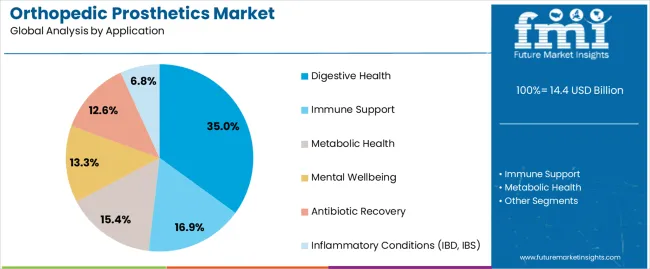
The digestive health application segment is expected to account for 35.0% of the Orthopedic Prosthetics market revenue share in 2025, making it the leading application area. The growth of this segment is influenced by the increasing awareness of the gut-bone axis and the role of digestive health in overall musculoskeletal wellness.
Probiotics and other digestive health-focused interventions are recognized for their ability to enhance nutrient absorption, reduce inflammation, and support recovery in orthopedic patients. Institutional adoption in hospitals and clinics has facilitated the integration of digestive health solutions into rehabilitation programs, ensuring improved patient outcomes.
Furthermore, the rising emphasis on preventative care and holistic patient management has elevated the relevance of digestive health applications, reinforcing their market prominence Technological advances in formulation, encapsulation, and sustained-release delivery systems have improved product effectiveness, further driving growth in this application segment.
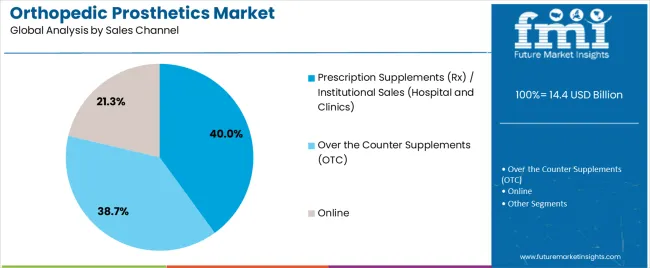
The prescription supplements and institutional sales end-use segment is anticipated to account for 40.0% of the Orthopedic Prosthetics market revenue in 2025, positioning it as the leading distribution channel. The segment has grown due to strong adoption in hospitals, clinics, and rehabilitation centers, where standardized treatment protocols and professional oversight are critical.
Integration of supplements into patient care plans ensures optimal recovery, better compliance, and improved functional outcomes, which has reinforced their market presence. The segment benefits from trust in healthcare providers’ recommendations, regulatory approvals for prescription use, and institutional procurement processes that facilitate consistent supply.
Additionally, growing awareness among patients and clinicians about evidence-based supplementation for musculoskeletal support has contributed to adoption The rising focus on personalized and outcome-driven healthcare, coupled with increasing hospital capacities and rehabilitation programs, continues to drive demand for prescription and institutional sales channels, solidifying their dominance in the Orthopedic Prosthetics market.
The section contains information about the leading segments in the industry. Based on product, the lower extremity prosthetics segment accounted for 63.1% of the global market share in 2025. Additionally, the segment is projected to expand at a lucrative CAGR till 2035.
| By Product | Lower Extremity Prosthetics |
|---|---|
| Value Share (2025) | 63.1% |
The lower extremity prosthetics products segment will dominate the market in terms of revenue, accounting for almost 63.1% of the market share in 2025.
There are several factors where lower extremity prosthetics account for the largest share of the orthopedic prosthetics. The major factor for the rise in this demand is the increased prevalence of diabetes and vascular diseases that very often result in lower limb amputation. The other major inclusion is injuries from accidents and increased participation in sports activities, thereby contributing to the demand for lower extremity prosthetics.
Furthermore, the rise in injuries and popularity of sporting activities are also fueling demand for lower extremity prosthetics. The vast majority of accidents and high-impact sports wind up causing limb injury or amputation, further raising demand for the prosthetic solution.
The recent technical advances in prosthetic limbs have greatly improved the functionality, comfort, and safety of artificial extremities, increasing the quality of life for amputees. It is in this respect that innovations like microprocessor-controlled knees or energy-storing feet provide more mobility and stability and are obviously very attractive options among users looking for advanced and reliable solutions in prosthetics.
| By Technology | Electric Powered |
|---|---|
| Value Share (2025) | 47.5% |
Electric-powered prosthetic devices are the segment leader due to their very sophisticated functionality and experience that each device has to offer an individual wearing them. These prosthetics, many of which include microprocessors and sensors, make more movement and control possible than the traditional mechanical or body-powered devices.
Advanced materials are used in electric-powered prosthetics, including lightweight composites and long-life polymers. In its composition, these materials provide the appropriate balance between limb strength, flexibility, and light weight properties necessary for user comfort and ease of operation.
One major advantage electrically powered prosthetics have over other kinds is that they are more lifelike in movement. The grip is more secure, they move smoothly, and the control element is done with great precision, which offers a better quality of life to amputees. Smart technologies allow getting them adjusted to unique settings, thus ensuring adaptability to the desired activity.
The table below provides a detailed comparison of the compound annual growth rate (CAGR) variations for the global orthopedic prosthetics market, spanning from the base year (2025) to the current year (2025) over the first half of the year.
This analysis highlights significant shifts in market dynamics and idenstifies key trends in revenue generation, offering stakeholders crucial insights into the market's progression over the examined period. The first half (H1) includes January to June, while the second half (H2) comprises July to December.
In the first half (H1) of the decade from 2025 to 2035, the business is predicted to surge at a CAGR of 5.7% followed by a slightly lower growth rate of 5.4% in the second half (H2) of the same decade.
| Particular | Value CAGR |
|---|---|
| H1 | 5.7% (2025 to 2035) |
| H2 | 5.4% (2025 to 2035) |
| H1 | 5.0% (2025 to 2035) |
| H2 | 4.7% (2025 to 2035) |
Moving into the subsequent period, from H1 2025 to H2 2035, the CAGR is projected to decrease slightly to 5.0% in the first half and remain relatively moderate at 4.7% in the second half. In the first half (H1) the market witnessed a decrease of -70 BPS while in the second half (H2), the market witnessed a decrease of -70 BPS.
The use of advanced materials has LED to significant improvements in the functionality and comfort of prosthetic devices.
Advanced materials have significantly played a role in the overall improvement of functionality, durability, and comfort of the prosthetic put around the orthopedic. Some of such materials may include carbon, advanced polymers, and titanium alloys. Such advancements in materials technology are key drivers of market growth and result in multiple benefits with positive patient satisfaction and good outcomes.
The prosthesis endures high levels of stress and strain due to the strength of carbon fiber; thus, it is a befitting material for an active user in sports or other physically intensive activities. It also has a longer life of durability, so the time of replacement and repair of carbon fiber prosthesis is rarer, thus saving on the cost to patients.
Combining the flexibility, strength, and biocompatibility in carbon fiber is the real purpose of advanced polymers like thermoplastic elastomer and polyurethane. These can be very easily molded and customized into patient-specific prosthetics in order to make the contours unique and comfortable with an intimate fit.
The advancement of materials has made prosthetic devices more functional and user-friendly. Lighter materials require less energy in the movement of the body, which is a way of helping the person in carrying out activities of his or her daily life with as little energy as possible.
Rising Incidence of Metabolic and Vascular Diseases: A Key Driver for the Orthopedic Prosthetics Market
A rise in the incidence of metabolic and vascular diseases is a prime driver for the orthopedic prosthetics market. Growing instances of diabetic patients and patients with peripheral vascular diseases (PVD) across the world are expected to drive demand for prosthetic limbs that allow disabled patients to move more freely and enjoy a better quality of life.
Diabetes, characterized by higher blood glucose levels for one of the two reasons-either cells produce lower amounts of insulin or there develops resistance toward insulin-often leads to fatal complications. Among them, there are prominent issues comprising neuropathy and bad blood circulation in the extremities.
Long-standing bad circulation may cause serious foot ulcers and infections that, in turn, at the advanced level, will require limb amputation to prevent systemic infection. Prosthetic solutions that can be found in the market will meet the growing need for a quality product effective against the backdrop of increasing diabetic rates.
Similarly, PVD refers to the constriction or complete obstruction of the peripheral arteries outside the heart but off the brain. These disease conditions are most rampant among the arteries supplying the legs. PVD obstructs the flow with blood, which results in pain, ulcers, and infections.
The disease may lead to tissue death in the case of severe disease where amputation becomes inevitable to prevent the life-threatening disease. The higher prevalence of PVD corresponds directly to higher demand for prosthetic limbs.
Based upon the increasing prevalence of metabolic and vascular diseases, an increasing need for innovative prosthetic solutions will lend itself in functionality, comfort, and integration. This drive urges new developments in prosthetic technology and related growths of the market, as care providers and sufferers seek to find superior remedies to cope with and conquer the challenges imposed by these ailments.
High Cost of Prosthetics is the Significant Challenge for the Orthopedic Prosthetics Sales.
The market for orthopedic prosthetics has gone through enormous development, mainly with the inclusion of advanced technologies like microprocessors and advanced materials. These two reasons have greatly improved prosthetic devices to be more comfortable, easy to adapt, and functional. Advanced prosthetics, however, come with great costs, hindering further growth in the market.
Modern prosthetics frequently incorporate high-tech features like microprocessor controlled knees and ankles, sensor systems, and robotics. These technologies enhance the functionality of the prosthesis, allowing near-natural movement, and adapting much better to different surfaces and levels of activity.
For example, Bionic Limbs- Such a prosthetic arm will be endowed with a high order of sensors and actuators that will mimic the natural movement of hands and arms. It will even accommodate dexterous control of the fingers, variable gripping powers, and changes in wrist rotation, just as a biological one would. The operation of such a robotic arm is controlled by the detection of muscle signals in the skin through electrodes.
All these necessitate that the anatomy of each patient be matched with a prosthesis through sophisticated imaging methods and exact measurements, with the aid of 3D printing. Expectedly, this personalized configuration of the device is more expensive, although not unnecessarily so because it gives a better fit and, of course, greater comfort.
Shift Towards Personalized Prosthetic Solutions is the Trend Followed by Manufacturers.
A current trend in orthopedic prosthetics is based on increasing their customization, satisfying individual needs. Currently, prosthetic devices that are designed for specific needs of a patient actually become a possibility due to the development of technology, materials, and manufacturing processes.
Custom prosthetics offer important benefits of precise fitting, improved functions, and increased comfort which fuel growth and development of the market.
Each patient with a need for a prosthesis has unique anatomical and functional needs, which are seldom met by standard off-the-shelf prosthetics. In some cases, such generic solutions contribute to discomfort, poor fit, and low functionality. The case is different with custom prosthetics since they are pinpoint made to perfectly match a patient's remaining leg shape, activity level, and style of life.
The customized prosthetic devices help in following which sores risks are minimized, caused by non-prescribed devices. With increased awareness of the benefits associated with having a customized prosthetic enables patient to be more demanding regarding these devices.
This upward demand enables an expanding market, which increases more reasons for constant and dynamic improvements in this orthopedic prosthetics area.
The global orthopedic prosthetics industry recorded a CAGR of 3.4% during the historical period between 2020 and 2025. The growth of orthopedic prosthetics industry was positive as it reached a value of USD 3,908.2 million in 2035 from USD 2,399.3 million in 2025.
Advancements such as 3D printing and microprocessor-controlled prostheses allow improved functional performance and provide customization. This, in turn, boosts the demand for prosthetics. Disorders which leads to amputation, such as diabetes and peripheral vascular disease, are gaining high prevalence and thereby resulting in increased demand for prosthetics.
With growing concerns of an increase in the aging population worldwide, there will be consequently increased rates of limb loss as a result of complications such as diabetes and vascular diseases. Consequently, prosthetics will gain wider use. The availability of health care services, more so in emerging markets, is expected to fuel the growth of prosthetics.
Additionally, it is anticipated that rising amputation cases will increase the demand for prosthetics adoption. Increasing incidence of road accidents that leads to limp amputation contribute significantly towards demand generation.
Further, the expansion of healthcare services within emerging markets is also likely to drive prosthetic demand. With increased access to healthcare, more patients in these regions would have the capability to begin using prosthetic limbs, further fueling market growth. In aggregate, these drivers point to a strong, growing prosthetics market underpinned by higher technological capability and rising patient numbers.
Tier 1 companies have over USD 100 million in revenue and account for 58.9% of the global market share. These market leaders continuously invest in research and development to enhance product offerings, including advanced materials and technologies like 3D printing and microprocessor-controlled prosthetics.
These companies also have strong brand equity and reputation for quality, reliability, and innovation in the orthopedic prosthetics sector. Exatech Inc., Howard Orthopaedics Inc., Hanger Inc., Wishbone Medical, Pega Medical and other notable businesses are among the tier 1 companies.
Mid-size businesses with annual revenue between USD 50 and USD 100 million that are based in particular areas and have a significant impact on the local market are considered Tier 2 companies. These companies hold around 12.6% of the global market. They are distinguished by having a significant international presence and in-depth industry expertise.
These market participants may not have cutting-edge technology or a broad global reach, but they do ensure regulatory compliance and have good technology. Prominent companies in tier 2 include OrthoPediatrics, Arthrex, Touch Bionics Inc. and others
Although the Tier 3 companies, such as Advanced Arm Dynamics and Medtronic Spinal are smaller and generate less revenue, but are still essential for the market. They specialize in specific products and cater to niche markets, adding diversity to the industry.
The Orthopedic Prosthetics Market analysis for various countries is covered in the section below. An analysis of market demand is given for important nations in North America, Asia Pacific, Europe, and other regions of the world. It is projected that through 2035, the United States will maintain its leading position in North America, with a lucrative CAGR of 5.7%. By 2035, China is expected to see a CAGR of 7.7% in the Asia Pacific region.
| Countries | Value CAGR (2025 to 2035) |
|---|---|
| USA | 5.7% |
| Germany | 5.9% |
| France | 4.2% |
| UK | 5.4% |
| China | 7.7% |
| India | 6.7% |
| South Korea | 3.1% |
USA orthopedic prosthetics market is expected to show a CAGR of 5.7% between 2025 and 2035.
United States hosts some of the biggest manufacturers of prosthetics and associated companies in the USA; these leaders not only drive innovation, diffusing it into the global economy, but also exert huge influence over market trends with very high standards for prosthetic devices.
In the USA, most of these expenses for the prosthetic limbs are borne by insurance policies, and advanced prosthetics have become accessible to a much larger sector of society. Besides, health professionals ensure high quality of treatment, which means that patients get prosthetic solutions that will suit and work well for them.
It simply means that the USA offers a competitive environment wherein companies not only strive for innovation but always work toward betterment. With different companies striving to give out the best products, prosthetics improvement is definite to be on the rise.
Germany’s market is anticipated to grow at a CAGR of 5.9% throughout the forecast period.
The country is developed, with a strong system of healthcare easily allowing the adoption of prosthetic technologies at improved levels. Germany plays host to major manufacturers and research institutions for prosthetics, hence allowing innovation and high quality in production.
German manufacturers lead in innovation in prosthetics, having developed sophisticated limbs that include advanced materials, microprocessor-controlled components, and adaptive technologies. This kind of innovation improves the functionality and comfort of prosthetics worn by people to realize better mobility and a higher quality of life.
It is due to Germany's focus on research and development that the country dominates the orthopaedic prosthetic market. The huge investment in R&D brings continuous improvement and next-generation development in prosthetic solutions. Only then will the German products always stay updated with the changing technology, meeting the requirements of patients and health providers alike.
China is expected to show a CAGR of 7.7% over the forecast period and the country dominated the East Asia market in 2025
The Chinese manufacturers of prosthetics have been increasing their domestic and international market. They are developing strong distribution and strategic partnership networks so as to make the products more accessible across the world; this has kept China at the top of the global market.
With the ability to be cheaply made in China, given its efficient manufacturing processes and lower labor costs, such devices would prove quite competitive on the world stage. As such, this price affordability will increase its distribution and adoption scope of orthopedic prosthetics across parts of the world, especially where prices are sensitive issues.
The country's vigorous manufacturing capabilities, with cheaper production, assures that even prosthetic appliances are available at a lower rate, and therefore are availed to a lot of the country's population. With such a pricing approach, the increasing domestic demand for the product, especially prosthetic devices, and the export of these products only find one more base that consolidates their market position in China.
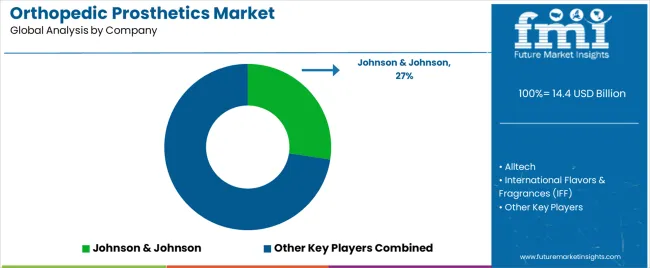
The market for orthopedic prosthetics is extremely dispersed. Companies are constantly focusing on means to increase their revenue. They do this by focusing on innovation and development of new products.
Key manufacturers in the orthopedic prosthetics market employ several key strategies to stay competitive and drive growth. They focus on continuous innovation, investing heavily in research and development to create advanced, high-functioning prosthetic devices. Partnerships and collaborations with healthcare providers and research institutions are common to enhance product offerings and expand market reach
Recent Industry Developments in Orthopedic Prosthetics Market
| Report Attributes | Details |
|---|---|
| Current Total Market Size (2025) | USD 14.4 billion |
| Projected Market Size (2035) | USD 32.3 billion |
| CAGR (2025 to 2035) | 8.4% |
| Base Year for Estimation | 2025 |
| Historical Period | 2020 to 2025 |
| Projections Period | 2025 to 2035 |
| Quantitative Units | USD million for value and thousand units for volume |
| Products Analyzed (Segment 1) | Upper Extremity Prosthetics (Hand, Elbow, Shoulder), Lower Extremity Prosthetics (Foot & Ankle, Knee, Hip), Liners, Sockets, Modular Components |
| Technologies Analyzed (Segment 2) | Conventional, Electric Powered, Hybrid |
| Regions Covered | North America; Latin America; Western Europe; Eastern Europe; South Asia and Pacific; East Asia; Middle East & Africa |
| Countries Covered | United States, Canada, Mexico, Brazil, Argentina, Germany, France, United Kingdom, Italy, Spain, Netherlands, China, India, Japan, South Korea, ANZ, GCC Countries, South Africa |
| Key Players influencing the Orthopedic Prosthetics Market | Exatech Inc., Howard Orthopaedics Inc., Hanger Inc., Wishbone Medical, Pega Medical, OrthoPediatrics, Arthrex, Touch Bionics Inc., Advanced Arm Dynamics, Medtronic Spinal, Integra Lifesciences |
| Additional Attributes | Market share by product (lower vs upper extremity), Demand for modular prosthetic components, Growth in electric-powered mobility systems, Technological innovation in smart bionic limbs, Regional prosthetic rehabilitation programs, Impact of aging population and accident recovery services |
| Customization and Pricing | Customization and Pricing Available on Request |
In terms of product, the industry is divided into - upper extremity prosthetics (hand prosthetics, elbow prosthetics, shoulder prosthetics). lower extremity prosthetics (foot & ankle prosthetics, knee prosthetics, hip prosthetics). liners, sockets and modular components.
In terms of technology, the industry is segregated into conventional, electric powered and hybrid orthopaedic prosthetics.
Key countries of North America, Latin America, Europe, East Asia, South Asia & Pacific, Middle East and Africa (MEA) have been covered in the report.
The global orthopedic prosthetics market is estimated to be valued at USD 14.4 billion in 2025.
The market size for the orthopedic prosthetics market is projected to reach USD 32.3 billion by 2035.
The orthopedic prosthetics market is expected to grow at a 8.4% CAGR between 2025 and 2035.
The key product types in orthopedic prosthetics market are probiotics, prebiotics, postbiotics, synbiotics and enzyme blends.
In terms of application, digestive health segment to command 35.0% share in the orthopedic prosthetics market in 2025.


Full Research Suite comprises of:
Market outlook & trends analysis
Interviews & case studies
Strategic recommendations
Vendor profiles & capabilities analysis
5-year forecasts
8 regions and 60+ country-level data splits
Market segment data splits
12 months of continuous data updates
DELIVERED AS:
PDF EXCEL ONLINE
Orthopedic Braces and Support Market Forecast and Outlook 2025 to 2035
Orthopedic Power Tools Market Size and Share Forecast Outlook 2025 to 2035
Orthopedic Contract Manufacturing Market Size and Share Forecast Outlook 2025 to 2035
Orthopedic Digit Implants Market Size and Share Forecast Outlook 2025 to 2035
Orthopedic Prosthetic Device Market Analysis - Size, Share, and Forecast Outlook 2025 to 2035
Orthopedic Splints Market Size and Share Forecast Outlook 2025 to 2035
Orthopedic Software Market Size and Share Forecast Outlook 2025 to 2035
Orthopedic Navigation Systems Market Analysis – Trends, Growth & Forecast 2025 to 2035
Orthopedic Trauma Device Market Trends - Size, Share & Forecast 2025 to 2035
Orthopedic Insole Market Analysis – Size & Industry Trends 2025–2035
Orthopedic Shoes Market Growth – Trends & Forecast 2025 to 2035
Orthopedic Oncology Market Growth - Trends & Forecast 2025 to 2035
A Global Brand Share Analysis for Orthopedic Insole Market
Orthopedic Consumables Market Trends – Industry Growth & Forecast 2024 to 2034
3D Orthopedic Scanning Systems Market
Smart Orthopedic Implants Market
Canine Orthopedic Implants Market Size and Share Forecast Outlook 2025 to 2035
Veterinary Orthopedic Drills Market Size and Share Forecast Outlook 2025 to 2035
Veterinary Orthopedic Market Overview – Trends, Applications & Forecast 2024-2034
Veterinary Orthopedic Injectable Drug Market

Thank you!
You will receive an email from our Business Development Manager. Please be sure to check your SPAM/JUNK folder too.
Chat With
MaRIA