Parcel Insulation Market Size and Share Forecast Outlook 2025 to 2035

The parcel insulation market will expand from USD 1.3 billion in 2025 to USD 2.5 billion by 2035, advancing at a CAGR of 6.6%. This growth is supported by rising e-commerce, food delivery services, and pharmaceutical logistics requiring reliable temperature-sensitive packaging. Sustainability concerns are also fueling adoption of paper-based and biodegradable insulation alternatives.
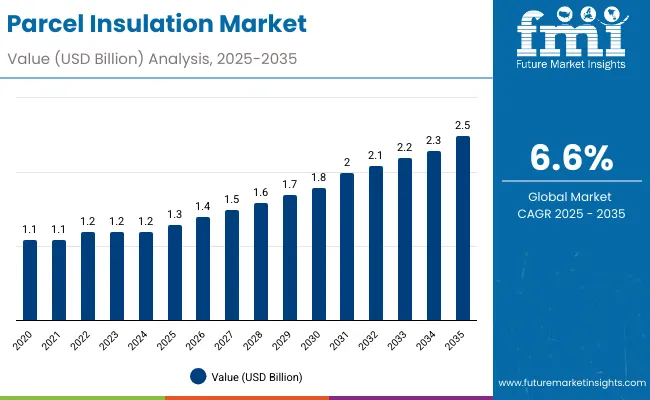
Quick Stats for Parcel Insulation Market

  • Market Value (2025): USD 1.3 billion
  • Market Forecast Value (2035): USD 2.5 billion
  • Market Forecast CAGR: 6.6%
  • Leading Segment in 2025: Box liners (41.2%)
  • Key Growth Regions: Asia-Pacific, led by South Korea at 7.3% CAGR
  • Top Companies: Cryopak, Cold Chain Technologies (CCT), Pelican Products Inc., Va-Q-Tec AG, Sofrigam, TempRite International, Nordic Cold Chain Solutions, Amcor, DS Smith, UFP Technologies

Parcel Insulation Market

Metric Value
Industry Size (2025E) USD 1.3 billion
Industry Value (2035F) USD 2.5 billion
CAGR (2025 to 2035) 6.6%

Between 2025 and 2030, the market will add USD 0.5 billion as cold chain logistics and food delivery expand. From 2030 to 2035, another USD 0.7 billion will be added, driven by healthcare packaging and industrial logistics. Box liners and e-commerce end use will anchor global demand, with Asia-Pacific expected to lead growth.

From 2020 to 2024, parcel insulation demand rose as e-commerce deliveries surged and cold chain integrity became critical for food and healthcare. Paper-based and recycled cotton liners gained traction as sustainable replacements for EPS. Pharmaceutical shipments expanded insulated pouch and thermal insert adoption, while regulatory pressure against non-recyclable plastics grew globally.

By 2035, the market will reach USD 2.5 billion at 6.6% CAGR. Paper-based insulation will dominate as governments enforce circular economy policies. Box liners will remain the primary product type, balancing affordability and protection. E-commerce and healthcare logistics will anchor demand, while Asia-Pacific leads with the highest growth. Europe and North America will emphasize sustainability and compliance, while emerging markets expand insulated solutions for food and pharma supply chains.

Why is the Parcel Insulation Market Growing?

The parcel insulation market is growing due to the expansion of cold chain logistics, rising food delivery platforms, and increased pharmaceutical shipping. Companies prioritize packaging that maintains temperature integrity during last-mile delivery. Food and beverages dominate usage, supported by consumer preference for fresh and ready-to-eat meals.

Sustainability is another driver, with retailers adopting paper-based and biodegradable materials to replace EPS and polyurethane foam. E-commerce and retail further accelerate adoption by integrating parcel insulation into scalable packaging systems. With stricter regulations and consumer awareness, demand for sustainable and efficient insulated packaging solutions continues to strengthen globally.

Segmental Overview

The parcel insulation market is segmented by material, product type, application, end-use industry, and region. Material categories include paper-based insulation, recycled cotton, wool, EPS, polyurethane foam, biodegradable foam, and aerogels. Product types cover box liners, envelopes, pouches, and thermal pads. Applications span food and beverages, pharmaceuticals, personal care, chemicals, and industrial goods. End-use industries include e-commerce, food delivery, pharmaceutical logistics, and industrial packaging across global regions.
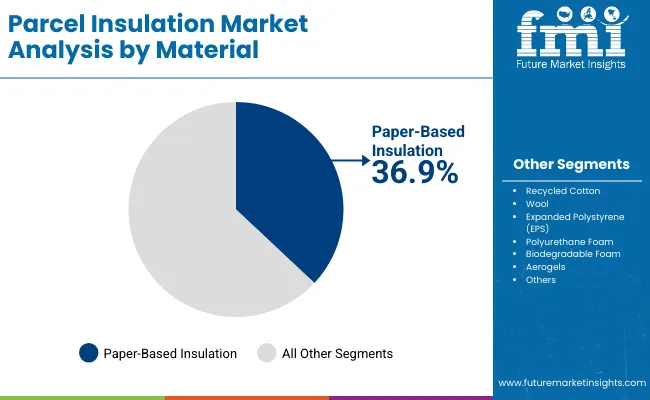
Paper-Based Insulation Leads Material Segment

Parcel Insulation Market By Material

Paper-based insulation will hold 36.9% share in 2025, supported by recyclability, affordability, and compliance with global plastic bans. Its strength and thermal performance make it suitable for food delivery and healthcare logistics. Retailers and logistics providers favor it as a scalable, sustainable solution.

Future demand will be reinforced by improved barrier coatings and certifications for food contact. Innovations in moisture resistance and lightweight formats will expand usage. Paper-based insulation will remain the leading material through 2035, aligning with regulatory mandates and consumer expectations.
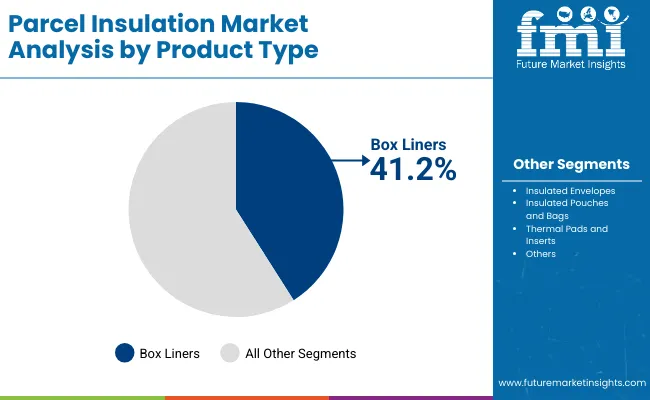
Box Liners Dominate Product Types

Parcel Insulation Market By Product

Box liners will account for 41.2% share in 2025 due to their widespread use in food, grocery, and pharmaceutical shipments. They provide flexibility, low cost, and strong protective performance. E-commerce and food delivery companies adopt liners to ensure thermal stability during transport.

Innovation in biodegradable and recyclable liners will drive further adoption. Custom sizing and automation-ready designs enhance efficiency. Box liners will continue to dominate, particularly in high-volume retail and food logistics channels.
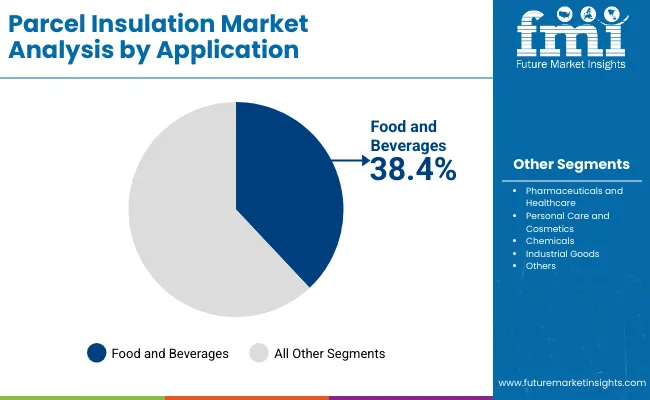
Food and Beverages Anchor Applications

Parcel Insulation Market By Application

Food and beverages will command 38.4% share in 2025, driven by demand for temperature-controlled delivery of fresh and frozen items. Foodservice operators rely on insulated packaging to maintain safety and quality. Online grocery platforms also accelerate adoption.

Future growth will be reinforced by ready-to-eat meals and subscription services. Paper and foam alternatives offering recyclability will support expansion. Food and beverage shipments will remain a cornerstone of market demand through 2035.
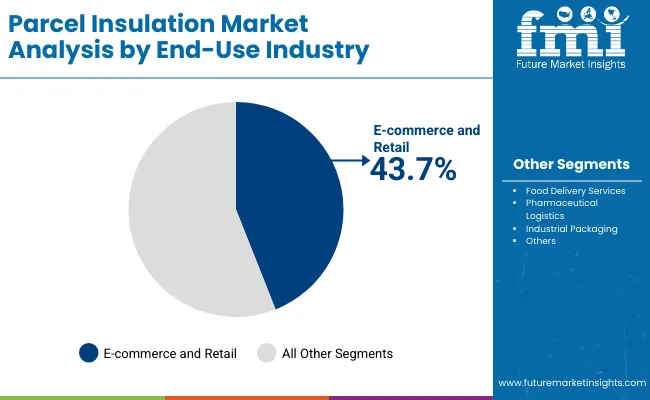
E-Commerce and Retail Dominate End-Use

Parcel Insulation Market By End Use

E-commerce and retail will represent 43.7% share in 2025, reflecting parcel insulation’s role in protecting perishable and sensitive goods. Retailers expand use of insulated packaging to improve delivery outcomes and reduce spoilage.

By 2035, e-commerce will remain dominant as online food and healthcare delivery scales. Automation-ready insulated solutions and recyclable designs will further anchor growth. This segment will continue leading adoption globally.

Drivers, Restraints, Opportunities, and Key Trends

Market growth is driven by rising cold chain logistics, expansion of food delivery, and global pharmaceutical trade. Insulated packaging ensures compliance with safety regulations, while sustainability mandates drive paper and biodegradable foam adoption. E-commerce and healthcare logistics expand rapidly, reinforcing long-term demand.

High costs of advanced materials like aerogels and biodegradable foams limit adoption in cost-sensitive markets. Recycling infrastructure gaps restrict uptake of certain insulation products. Price competition from traditional EPS continues to hinder transition toward sustainable solutions.

Opportunities lie in biodegradable insulation, automation-ready packaging, and healthcare logistics. Pharmaceutical cold chains require precise temperature control, boosting insulated envelopes and pouches. Emerging markets provide significant potential as e-commerce and food delivery scale.

Trends include recyclable paper-based liners, biodegradable foams, and lightweight aerogels. Integration with digital monitoring solutions enhances cold chain visibility. Partnerships between packaging suppliers and logistics providers drive innovation. Circular economy initiatives push eco-friendly materials to the forefront.
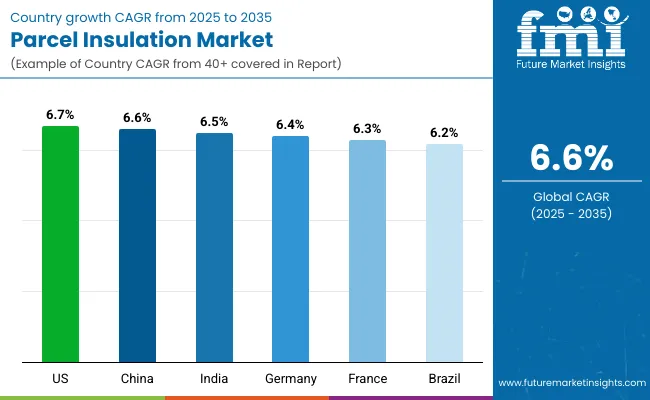
Analysis of Parcel Insulation Market by Key Countries

Parcel Insulation Market By Country

The market is expanding globally as sustainability and cold chain needs align. Asia-Pacific leads growth with Japan and South Korea adopting advanced solutions. North America emphasizes compliance and healthcare logistics, while Europe enforces strict recycling mandates. Emerging markets expand with e-commerce and food delivery.
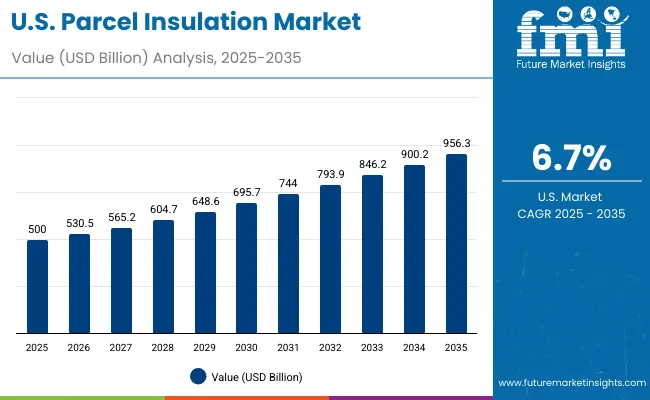
United States Sales Outlook

Parcel Insulation Market Usa

The USA insulated packaging market is projected to grow at 6.7% CAGR, supported by strong e-commerce expansion and healthcare logistics requirements. Rising emphasis on sustainability is driving significant adoption of paper-based insulation materials as replacements for conventional formats. In addition, the growing penetration of food delivery platforms further expands insulated packaging use, ensuring products reach consumers in optimal condition while simultaneously reinforcing eco-conscious practices and enhancing service reliability across industries.
  • E-commerce strengthens demand by creating consistent need for insulated packaging in logistics.
  • Healthcare expands logistics adoption with strict requirements for temperature-sensitive medicines.
  • Paper-based insulation gains share as eco-friendly alternatives replace conventional formats.

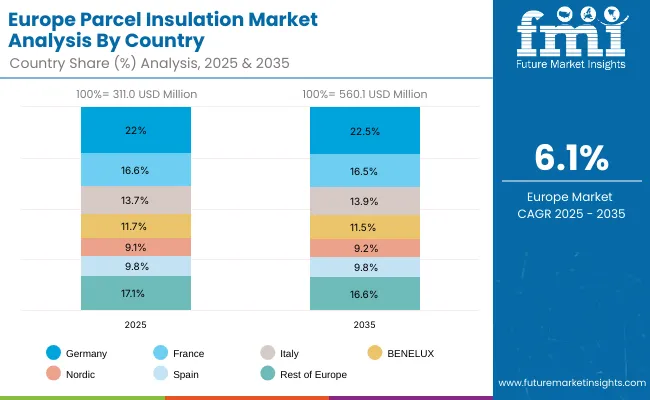
Germany Growth Outlook

Parcel Insulation Market Europe

Germany is forecast to expand at a 6.4% CAGR, primarily underpinned by the enforcement of strict EU recycling and packaging laws. Pharmaceutical logistics remain a cornerstone, with insulated packaging used extensively in maintaining drug quality. Simultaneously, demand is enhanced by biodegradable foam innovations that support sustainable cold chain operations, enabling Germany to balance regulatory compliance, consumer expectations, and packaging performance within healthcare and food-related logistics.

  • EU mandates drive adoption through stringent recycling and packaging sustainability laws.
  • Pharma shipments grow steadily, requiring reliable insulated logistics for sensitive medicines.
  • Foam innovations enhance demand with biodegradable formats that support eco-compliance.

United Kingdom Expansion Outlook

The UK insulated packaging market will grow at 6.5% CAGR, supported by extended producer responsibility (EPR) and new packaging regulations. Food delivery services are expanding quickly, driving the adoption of insulated packaging to maintain product integrity. Retailers are also prioritizing recyclable formats, ensuring compliance while capturing environmentally conscious consumers, which reinforces sustainability’s role in shaping demand across industries such as groceries, restaurants, and online retail platforms.

  • Regulations boost adoption with compliance requirements under EPR and packaging laws.
  • Food delivery drives demand by ensuring meals maintain quality during transit.
  • Recyclable solutions expand use with sustainable formats gaining consumer preference.

China Sales Outlook

China is anticipated to grow at 6.6% CAGR, driven by rapid e-commerce penetration and accelerated cold chain expansion supporting food and pharmaceuticals. Demand is increasingly shifting toward EPS alternatives, with sustainable insulation materials dominating new adoption. As large online retail platforms and logistics companies scale operations, insulated packaging use expands to accommodate perishable and sensitive products, highlighting the country’s strategic emphasis on logistics modernization and environmentally safe material solutions.

  • E-commerce accelerates usage with online platforms needing insulated logistics for perishables.
  • Cold chain boosts adoption as fresh food logistics and pharma distribution grow.
  • EPS replacements grow steadily with eco-friendly substitutes reducing plastic reliance.

India Growth Outlook

India’s insulated packaging market will record 6.5% CAGR, supported by rapid scaling of food and beverage delivery platforms. Retail sector expansion contributes strongly to usage, as both urban and semi-urban markets demand reliable thermal solutions. Sustainability initiatives further strengthen usage, with businesses investing in eco-friendly insulation materials to balance environmental responsibility with the rising consumer demand for convenience-driven, temperature-sensitive food, grocery, and medical shipments across India’s diverse and growing economy.

  • Food delivery expands adoption with growing demand for insulated meal packaging solutions.
  • Retail growth reinforces demand with more stores integrating sustainable packaging.
  • Sustainability initiatives strengthen usage as businesses adopt eco-friendly insulated materials.

Japan Outlook

Japan will expand at a 7.2% CAGR, with demand driven by stringent healthcare logistics and cold chain standards that require consistent thermal packaging. Paper-based insulation and advanced foams dominate adoption, offering lightweight, durable, and recyclable alternatives. The country’s focus on innovation ensures insulated packaging solutions meet sustainability mandates, enhance logistics efficiency, and align with consumer expectations for premium quality across food, pharmaceutical, and high-value delivery applications.

  • Healthcare logistics expand share with strict requirements for temperature-controlled medicine shipments.
  • Advanced foams lead innovation with high-performance lightweight and recyclable solutions.
  • Paper insulation aligns with mandates that support eco-friendly material adoption.

South Korea Expansion Outlook

South Korea is projected to lead growth globally with a 7.3% CAGR, supported by e-commerce expansion and food delivery platforms. Recyclable materials dominate adoption, reflecting strong consumer awareness and regulatory alignment. As logistics providers and food delivery companies scale, insulated packaging is increasingly integrated into distribution systems, positioning South Korea as a hub of innovation and sustainability in reusable and recyclable thermal packaging solutions.
  • E-commerce logistics boost demand through rapid parcel deliveries requiring insulation.
  • Food delivery anchors adoption by supporting meal quality in transport.
  • Recyclable insulation gains traction as sustainability shapes consumer and retailer choices.

Analysis of Japan by Material

Parcel Insulation Market Japan

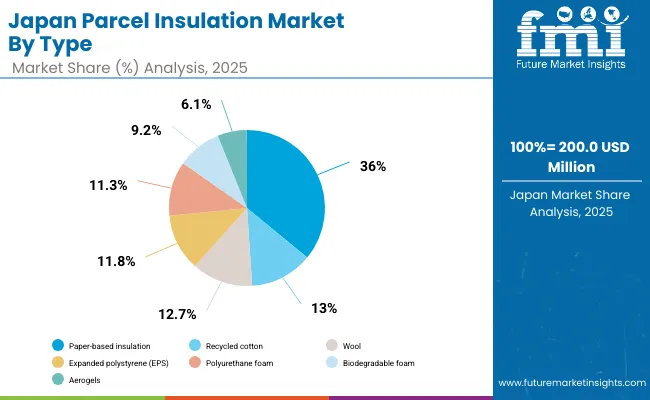
Japan’s parcel insulation market, valued at USD 200 million in 2025, is dominated by paper-based insulation with a 36.0% share, reflecting strong adoption of recyclable packaging. Recycled cotton (13.0%) and wool (12.7%) contribute significantly, offering thermal stability and eco-friendly alternatives to conventional plastics. Expanded polystyrene (EPS) at 11.8% and polyurethane foam at 11.3% continue to serve heavy-duty insulation requirements, though facing regulatory scrutiny. Biodegradable foam (9.2%) and aerogels (6.1%) show emerging growth potential in lightweight, high-performance packaging solutions. Overall, the material mix highlights Japan’s balancing of performance with sustainability goals as e-commerce and pharmaceutical cold chain logistics expand.
Analysis of South Korea by Product Type

Parcel Insulation Market South Korea

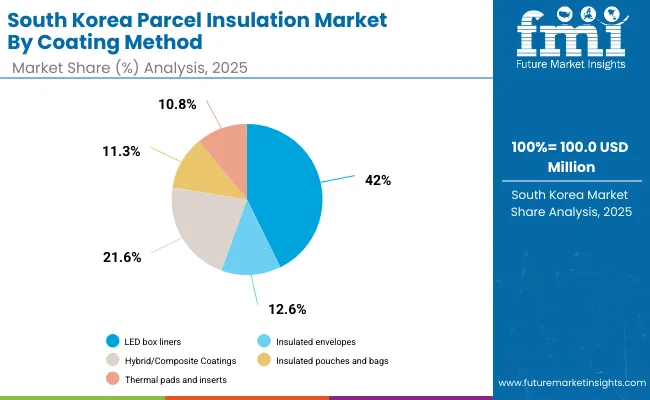
South Korea’s parcel insulation market, sized at USD 100 million in 2025, is led by box liners with a 42.0% share, driven by their versatility in perishable and pharmaceutical shipments. Insulated envelopes (12.6%) are preferred for smaller parcel logistics, particularly in e-commerce and food delivery. Insulated pouches and bags (11.3%) provide convenience for retail and household applications, ensuring thermal efficiency for short-haul distribution. Thermal pads and inserts (10.8%) round out the product base, supporting niche cold chain requirements. South Korea’s product distribution demonstrates a clear emphasis on practical, scalable packaging designs tailored to last-mile delivery and temperature-sensitive transportation needs.
Competitive Landscape of Parcel Insulation Market

Parcel Insulation Market By Company

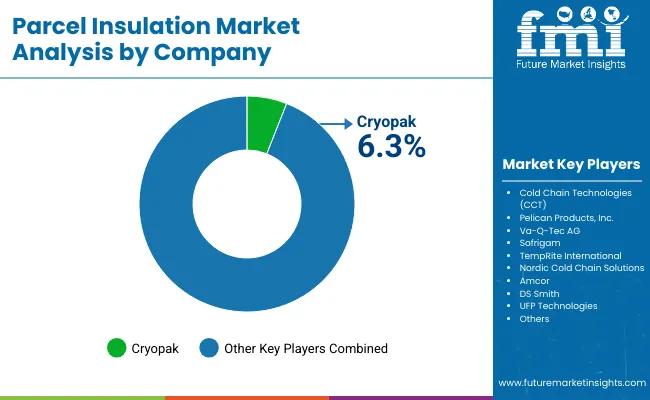
The market is moderately fragmented with global leaders such as Cryopak, Cold Chain Technologies (CCT), Pelican Products Inc., Va-Q-Tec AG, Sofrigam, TempRite International, Nordic Cold Chain Solutions, Amcor, DS Smith, and UFP Technologies. These companies invest in recyclable materials, advanced foam, and digital monitoring solutions.

Amcor and DS Smith dominate paper-based innovation, while Va-Q-Tec and Sofrigam lead high-performance cold chain packaging. Cryopak and Pelican Products specialize in protective thermal shipping. Regional players like TempRite and Nordic Cold Chain focus on customized supply. Competition centers on sustainability, cost-efficiency, and scalability, with strong emphasis on healthcare and food sectors.

Key Developments

  • In 2024, Amcor expanded its paper-based packaging portfolio with recyclable insulation products targeting e-commerce and food delivery sectors.
  • In 2023, DS Smith introduced a new circular insulation solution using recycled fibers, enhancing sustainability in cold chain logistics.

Key Companies

  • Cryopak
  • Cold Chain Technologies (CCT)
  • Pelican Products, Inc.
  • Va-Q-Tec AG
  • Sofrigam
  • TempRite International
  • Nordic Cold Chain Solutions
  • Amcor
  • DS Smith
  • UFP Technologies

Scope of the Report

Item Value
Quantitative Units USD 1.3 Billion
By Material Paper-Based, Recycled Cotton, Wool, EPS, Polyurethane Foam, Biodegradable Foam, Aerogels
By Product Type Box Liners, Envelopes, Pouches, Thermal Pads
By Application Food & Beverages, Pharmaceuticals & Healthcare, Personal Care & Cosmetics, Chemicals, Industrial Goods
By End-Use Industry E-commerce & Retail, Food Delivery, Pharma Logistics, Industrial Packaging
Key Companies Profiled Cryopak, Cold Chain Technologies (CCT), Pelican Products Inc., Va -Q-Tec AG, Sofrigam, TempRite International, Nordic Cold Chain Solutions, Amcor, DS Smith, UFP Technologies
Additional Attributes Growth driven by e-commerce, healthcare logistics, and sustainable materials.

Key Segmentation

By Material:

  • Paper-Based Insulation
  • Recycled Cotton
  • Wool
  • Expanded Polystyrene (EPS)
  • Polyurethane Foam
  • Biodegradable Foam
  • Aerogels

By Product Type:

  • Box Liners
  • Insulated Envelopes
  • Insulated Pouches and Bags
  • Thermal Pads and Inserts

By Application:

  • Food and Beverages
  • Pharmaceuticals and Healthcare
  • Personal Care and Cosmetics
  • Chemicals
  • Industrial Goods

By End-Use Industry:

  • E-commerce and Retail
  • Food Delivery Services
  • Pharmaceutical Logistics
  • Industrial Packaging

By Region:

  • North America
  • Europe
  • Asia-Pacific
  • Latin America
  • Middle East & Africa

Table of Content

  1. Executive Summary
    • Global Market Outlook
    • Demand-side Trends
    • Supply-side Trends
    • Technology Roadmap Analysis
    • Analysis and Recommendations
  2. Market Overview
    • Market Coverage / Taxonomy
    • Market Definition / Scope / Limitations
  3. Market Background
    • Market Dynamics
      • Drivers
      • Restraints
      • Opportunity
      • Trends
    • Scenario Forecast
      • Demand in Optimistic Scenario
      • Demand in Likely Scenario
      • Demand in Conservative Scenario
    • Opportunity Map Analysis
    • Product Life Cycle Analysis
    • Supply Chain Analysis
      • Supply Side Participants and their Roles
        • Producers
        • Mid-Level Participants (Traders/ Agents/ Brokers)
        • Wholesalers and Distributors
      • Value Added and Value Created at Node in the Supply Chain
      • List of Raw Material Suppliers
      • List of Existing and Potential Buyer’s
    • Investment Feasibility Matrix
    • Value Chain Analysis
      • Profit Margin Analysis
      • Wholesalers and Distributors
      • Retailers
    • PESTLE and Porter’s Analysis
    • Regulatory Landscape
      • By Key Regions
      • By Key Countries
    • Regional Parent Market Outlook
    • Production and Consumption Statistics
    • Import and Export Statistics
  4. Global Market Analysis 2020 to 2024 and Forecast, 2025 to 2035
    • Historical Market Size Value (USD Billion) & Volume (Units) Analysis, 2020 to 2024
    • Current and Future Market Size Value (USD Billion) & Volume (Units) Projections, 2025 to 2035
      • Y-o-Y Growth Trend Analysis
      • Absolute $ Opportunity Analysis
  5. Global Market Pricing Analysis 2020 to 2024 and Forecast 2025 to 2035
  6. Global Market Analysis 2020 to 2024 and Forecast 2025 to 2035, By Material
    • Introduction / Key Findings
    • Historical Market Size Value (USD Billion) & Volume (Units) Analysis By Material, 2020 to 2024
    • Current and Future Market Size Value (USD Billion) & Volume (Units) Analysis and Forecast By Material, 2025 to 2035
      • Paper-Based Insulation
      • Recycled Cotton
      • Wool
      • Expanded Polystyrene (EPS)
      • Polyurethane Foam
      • Biodegradable Foam
      • Aerogels
    • Y-o-Y Growth Trend Analysis By Material, 2020 to 2024
    • Absolute $ Opportunity Analysis By Material, 2025 to 2035
  7. Global Market Analysis 2020 to 2024 and Forecast 2025 to 2035, By Product Type
    • Introduction / Key Findings
    • Historical Market Size Value (USD Billion) & Volume (Units) Analysis By Product Type, 2020 to 2024
    • Current and Future Market Size Value (USD Billion) & Volume (Units) Analysis and Forecast By Product Type, 2025 to 2035
      • Box Liners
      • Insulated Envelopes
      • Insulated Pouches and Bags
      • Thermal Pads and Inserts
    • Y-o-Y Growth Trend Analysis By Product Type, 2020 to 2024
    • Absolute $ Opportunity Analysis By Product Type, 2025 to 2035
  8. Global Market Analysis 2020 to 2024 and Forecast 2025 to 2035, By Application
    • Introduction / Key Findings
    • Historical Market Size Value (USD Billion) & Volume (Units) Analysis By Application, 2020 to 2024
    • Current and Future Market Size Value (USD Billion) & Volume (Units) Analysis and Forecast By Application, 2025 to 2035
      • Food and Beverages
      • Pharmaceuticals and Healthcare
      • Personal Care and Cosmetics
      • Chemicals
      • Industrial Goods
    • Y-o-Y Growth Trend Analysis By Application, 2020 to 2024
    • Absolute $ Opportunity Analysis By Application, 2025 to 2035
  9. Global Market Analysis 2020 to 2024 and Forecast 2025 to 2035, By End-Use Industry
    • Introduction / Key Findings
    • Historical Market Size Value (USD Billion) & Volume (Units) Analysis By End-Use Industry, 2020 to 2024
    • Current and Future Market Size Value (USD Billion) & Volume (Units) Analysis and Forecast By End-Use Industry, 2025 to 2035
      • E-commerce and Retail
      • Food Delivery Services
      • Pharmaceutical Logistics
      • Industrial Packaging
    • Y-o-Y Growth Trend Analysis By End-Use Industry, 2020 to 2024
    • Absolute $ Opportunity Analysis By End-Use Industry, 2025 to 2035
  10. Global Market Analysis 2020 to 2024 and Forecast 2025 to 2035, By Region
    • Introduction
    • Historical Market Size Value (USD Billion) & Volume (Units) Analysis By Region, 2020 to 2024
    • Current Market Size Value (USD Billion) & Volume (Units) Analysis and Forecast By Region, 2025 to 2035
      • North America
      • Latin America
      • East Asia
      • South Asia & Pacific
      • Europe
      • Middle East & Africa
    • Market Attractiveness Analysis By Region
  11. North America Market Analysis 2020 to 2024 and Forecast 2025 to 2035, By Country
    • Historical Market Size Value (USD Billion) & Volume (Units) Trend Analysis By Market Taxonomy, 2020 to 2024
    • Market Size Value (USD Billion) & Volume (Units) Forecast By Market Taxonomy, 2025 to 2035
      • By Country
        • USA
        • Canada
        • Mexico
      • By Material
      • By Product Type
      • By Application
      • By End-Use Industry
    • Market Attractiveness Analysis
      • By Country
      • By Material
      • By Product Type
      • By Application
      • By End-Use Industry
    • Key Takeaways
  12. Latin America Market Analysis 2020 to 2024 and Forecast 2025 to 2035, By Country
    • Historical Market Size Value (USD Billion) & Volume (Units) Trend Analysis By Market Taxonomy, 2020 to 2024
    • Market Size Value (USD Billion) & Volume (Units) Forecast By Market Taxonomy, 2025 to 2035
      • By Country
        • Brazil
        • Argentina
        • Rest of Latin America
      • By Material
      • By Product Type
      • By Application
      • By End-Use Industry
    • Market Attractiveness Analysis
      • By Country
      • By Material
      • By Product Type
      • By Application
      • By End-Use Industry
    • Key Takeaways
  13. East Asia Market Analysis 2020 to 2024 and Forecast 2025 to 2035, By Country
    • Historical Market Size Value (USD Billion) & Volume (Units) Trend Analysis By Market Taxonomy, 2020 to 2024
    • Market Size Value (USD Billion) & Volume (Units) Forecast By Market Taxonomy, 2025 to 2035
      • By Country
        • China
        • Japan
        • South Korea
      • By Material
      • By Product Type
      • By Application
      • By End-Use Industry
    • Market Attractiveness Analysis
      • By Country
      • By Material
      • By Product Type
      • By Application
      • By End-Use Industry
    • Key Takeaways
  14. South Asia & Pacific Market Analysis 2020 to 2024 and Forecast 2025 to 2035, By Country
    • Historical Market Size Value (USD Billion) & Volume (Units) Trend Analysis By Market Taxonomy, 2020 to 2024
    • Market Size Value (USD Billion) & Volume (Units) Forecast By Market Taxonomy, 2025 to 2035
      • By Country
        • India
        • ASEAN Countries
        • Australia& New Zealand
        • Rest of South Asia
      • By Material
      • By Product Type
      • By Application
      • By End-Use Industry
    • Market Attractiveness Analysis
      • By Country
      • By Material
      • By Product Type
      • By Application
      • By End-Use Industry
    • Key Takeaways
  15. Europe Market Analysis 2020 to 2024 and Forecast 2025 to 2035, By Country
    • Historical Market Size Value (USD Billion) & Volume (Units) Trend Analysis By Market Taxonomy, 2020 to 2024
    • Market Size Value (USD Billion) & Volume (Units) Forecast By Market Taxonomy, 2025 to 2035
      • By Country
        • Germany
        • UK
        • France
        • Italy
        • Spain
        • BENELUX
        • Nordic Countries
        • Russia
        • Hungary
        • Poland
        • Rest of Europe
      • By Material
      • By Product Type
      • By Application
      • By End-Use Industry
    • Market Attractiveness Analysis
      • By Country
      • By Material
      • By Product Type
      • By Application
      • By End-Use Industry
    • Key Takeaways
  16. Middle East & Africa Market Analysis 2020 to 2024 and Forecast 2025 to 2035, By Country
    • Historical Market Size Value (USD Billion) & Volume (Units) Trend Analysis By Market Taxonomy, 2020 to 2024
    • Market Size Value (USD Billion) & Volume (Units) Forecast By Market Taxonomy, 2025 to 2035
      • By Country
        • Saudi Arabia
        • Türkiye
        • South Africa
        • Other African Union
        • Rest of Middle East & Africa
      • By Material
      • By Product Type
      • By Application
      • By End-Use Industry
    • Market Attractiveness Analysis
      • By Country
      • By Material
      • By Product Type
      • By Application
      • By End-Use Industry
    • Key Takeaways
  17. Key Countries Market Analysis
    • USA.
      • Pricing Analysis
      • Market Share Analysis, 2024
        • By Material
        • By Product Type
        • By Application
        • By End-Use Industry
    • Brazil
      • Pricing Analysis
      • Market Share Analysis, 2024
        • By Material
        • By Product Type
        • By Application
        • By End-Use Industry
    • China
      • Pricing Analysis
      • Market Share Analysis, 2024
        • By Material
        • By Product Type
        • By Application
        • By End-Use Industry
    • India
      • Pricing Analysis
      • Market Share Analysis, 2024
        • By Material
        • By Product Type
        • By Application
        • By End-Use Industry
    • Europe
      • Pricing Analysis
      • Market Share Analysis, 2024
        • By Material
        • By Product Type
        • By Application
        • By End-Use Industry
    • Germany
      • Pricing Analysis
      • Market Share Analysis, 2024
        • By Material
        • By Product Type
        • By Application
        • By End-Use Industry
    • France
      • Pricing Analysis
      • Market Share Analysis, 2024
        • By Material
        • By Product Type
        • By Application
        • By End-Use Industry
    • UK
      • Pricing Analysis
      • Market Share Analysis, 2024
        • By Material
        • By Product Type
        • By Application
        • By End-Use Industry
  18. Market Structure Analysis
    • Competition Dashboard
    • Competition Benchmarking
    • Market Share Analysis of Top Players
      • By Regional
      • By Material
      • By Product Type
      • By Application
      • By End-Use Industry
  19. Competition Analysis
    • Competition Deep Dive
      • Cryopak
        • Overview
        • Product Portfolio
        • Profitability by Market Segments (Product/Age /Sales Channel/Region)
        • Sales Footprint
        • Strategy Overview
          • Marketing Strategy
          • Product Strategy
          • Channel Strategy
      • Cold Chain Technologies (CCT)
        • Overview
        • Product Portfolio
        • Profitability by Market Segments (Product/Age /Sales Channel/Region)
        • Sales Footprint
        • Strategy Overview
          • Marketing Strategy
          • Product Strategy
          • Channel Strategy
      • Pelican Products, Inc.
        • Overview
        • Product Portfolio
        • Profitability by Market Segments (Product/Age /Sales Channel/Region)
        • Sales Footprint
        • Strategy Overview
          • Marketing Strategy
          • Product Strategy
          • Channel Strategy
      • Va-Q-Tec AG
        • Overview
        • Product Portfolio
        • Profitability by Market Segments (Product/Age /Sales Channel/Region)
        • Sales Footprint
        • Strategy Overview
          • Marketing Strategy
          • Product Strategy
          • Channel Strategy
      • Sofrigam
        • Overview
        • Product Portfolio
        • Profitability by Market Segments (Product/Age /Sales Channel/Region)
        • Sales Footprint
        • Strategy Overview
          • Marketing Strategy
          • Product Strategy
          • Channel Strategy
      • TempRite International
        • Overview
        • Product Portfolio
        • Profitability by Market Segments (Product/Age /Sales Channel/Region)
        • Sales Footprint
        • Strategy Overview
          • Marketing Strategy
          • Product Strategy
          • Channel Strategy
      • Nordic Cold Chain Solutions
        • Overview
        • Product Portfolio
        • Profitability by Market Segments (Product/Age /Sales Channel/Region)
        • Sales Footprint
        • Strategy Overview
          • Marketing Strategy
          • Product Strategy
          • Channel Strategy
      • Amcor
        • Overview
        • Product Portfolio
        • Profitability by Market Segments (Product/Age /Sales Channel/Region)
        • Sales Footprint
        • Strategy Overview
          • Marketing Strategy
          • Product Strategy
          • Channel Strategy
      • DS Smith
        • Overview
        • Product Portfolio
        • Profitability by Market Segments (Product/Age /Sales Channel/Region)
        • Sales Footprint
        • Strategy Overview
          • Marketing Strategy
          • Product Strategy
          • Channel Strategy
      • UFP Technologies
        • Overview
        • Product Portfolio
        • Profitability by Market Segments (Product/Age /Sales Channel/Region)
        • Sales Footprint
        • Strategy Overview
          • Marketing Strategy
          • Product Strategy
          • Channel Strategy
  20. Assumptions & Acronyms Used
  21. Research Methodology

List of Tables

  • Table 1: Global Market Value (USD Billion) Forecast by Region, 2020-2035
  • Table 2: Global Market Volume (Units) Forecast by Region, 2020-2035
  • Table 3: Global Market Value (USD Billion) Forecast by Material, 2020-2035
  • Table 4: Global Market Volume (Units) Forecast by Material, 2020-2035
  • Table 5: Global Market Value (USD Billion) Forecast by Product Type, 2020-2035
  • Table 6: Global Market Volume (Units) Forecast by Product Type, 2020-2035
  • Table 7: Global Market Value (USD Billion) Forecast by Application, 2020-2035
  • Table 8: Global Market Volume (Units) Forecast by Application, 2020-2035
  • Table 9: Global Market Value (USD Billion) Forecast by End-Use Industry, 2020-2035
  • Table 10: Global Market Volume (Units) Forecast by End-Use Industry, 2020-2035
  • Table 11: North America Market Value (USD Billion) Forecast by Country, 2020-2035
  • Table 12: North America Market Volume (Units) Forecast by Country, 2020-2035
  • Table 13: North America Market Value (USD Billion) Forecast by Material, 2020-2035
  • Table 14: North America Market Volume (Units) Forecast by Material, 2020-2035
  • Table 15: North America Market Value (USD Billion) Forecast by Product Type, 2020-2035
  • Table 16: North America Market Volume (Units) Forecast by Product Type, 2020-2035
  • Table 17: North America Market Value (USD Billion) Forecast by Application, 2020-2035
  • Table 18: North America Market Volume (Units) Forecast by Application, 2020-2035
  • Table 19: North America Market Value (USD Billion) Forecast by End-Use Industry, 2020-2035
  • Table 20: North America Market Volume (Units) Forecast by End-Use Industry, 2020-2035
  • Table 21: Latin America Market Value (USD Billion) Forecast by Country, 2020-2035
  • Table 22: Latin America Market Volume (Units) Forecast by Country, 2020-2035
  • Table 23: Latin America Market Value (USD Billion) Forecast by Material, 2020-2035
  • Table 24: Latin America Market Volume (Units) Forecast by Material, 2020-2035
  • Table 25: Latin America Market Value (USD Billion) Forecast by Product Type, 2020-2035
  • Table 26: Latin America Market Volume (Units) Forecast by Product Type, 2020-2035
  • Table 27: Latin America Market Value (USD Billion) Forecast by Application, 2020-2035
  • Table 28: Latin America Market Volume (Units) Forecast by Application, 2020-2035
  • Table 29: Latin America Market Value (USD Billion) Forecast by End-Use Industry, 2020-2035
  • Table 30: Latin America Market Volume (Units) Forecast by End-Use Industry, 2020-2035
  • Table 31: East Asia Market Value (USD Billion) Forecast by Country, 2020-2035
  • Table 32: East Asia Market Volume (Units) Forecast by Country, 2020-2035
  • Table 33: East Asia Market Value (USD Billion) Forecast by Material, 2020-2035
  • Table 34: East Asia Market Volume (Units) Forecast by Material, 2020-2035
  • Table 35: East Asia Market Value (USD Billion) Forecast by Product Type, 2020-2035
  • Table 36: East Asia Market Volume (Units) Forecast by Product Type, 2020-2035
  • Table 37: East Asia Market Value (USD Billion) Forecast by Application, 2020-2035
  • Table 38: East Asia Market Volume (Units) Forecast by Application, 2020-2035
  • Table 39: East Asia Market Value (USD Billion) Forecast by End-Use Industry, 2020-2035
  • Table 40: East Asia Market Volume (Units) Forecast by End-Use Industry, 2020-2035
  • Table 41: South Asia & Pacific Market Value (USD Billion) Forecast by Country, 2020-2035
  • Table 42: South Asia & Pacific Market Volume (Units) Forecast by Country, 2020-2035
  • Table 43: South Asia & Pacific Market Value (USD Billion) Forecast by Material, 2020-2035
  • Table 44: South Asia & Pacific Market Volume (Units) Forecast by Material, 2020-2035
  • Table 45: South Asia & Pacific Market Value (USD Billion) Forecast by Product Type, 2020-2035
  • Table 46: South Asia & Pacific Market Volume (Units) Forecast by Product Type, 2020-2035
  • Table 47: South Asia & Pacific Market Value (USD Billion) Forecast by Application, 2020-2035
  • Table 48: South Asia & Pacific Market Volume (Units) Forecast by Application, 2020-2035
  • Table 49: South Asia & Pacific Market Value (USD Billion) Forecast by End-Use Industry, 2020-2035
  • Table 50: South Asia & Pacific Market Volume (Units) Forecast by End-Use Industry, 2020-2035
  • Table 51: Europe Market Value (USD Billion) Forecast by Country, 2020-2035
  • Table 52: Europe Market Volume (Units) Forecast by Country, 2020-2035
  • Table 53: Europe Market Value (USD Billion) Forecast by Material, 2020-2035
  • Table 54: Europe Market Volume (Units) Forecast by Material, 2020-2035
  • Table 55: Europe Market Value (USD Billion) Forecast by Product Type, 2020-2035
  • Table 56: Europe Market Volume (Units) Forecast by Product Type, 2020-2035
  • Table 57: Europe Market Value (USD Billion) Forecast by Application, 2020-2035
  • Table 58: Europe Market Volume (Units) Forecast by Application, 2020-2035
  • Table 59: Europe Market Value (USD Billion) Forecast by End-Use Industry, 2020-2035
  • Table 60: Europe Market Volume (Units) Forecast by End-Use Industry, 2020-2035
  • Table 61: Middle East & Africa Market Value (USD Billion) Forecast by Country, 2020-2035
  • Table 62: Middle East & Africa Market Volume (Units) Forecast by Country, 2020-2035
  • Table 63: Middle East & Africa Market Value (USD Billion) Forecast by Material, 2020-2035
  • Table 64: Middle East & Africa Market Volume (Units) Forecast by Material, 2020-2035
  • Table 65: Middle East & Africa Market Value (USD Billion) Forecast by Product Type, 2020-2035
  • Table 66: Middle East & Africa Market Volume (Units) Forecast by Product Type, 2020-2035
  • Table 67: Middle East & Africa Market Value (USD Billion) Forecast by Application, 2020-2035
  • Table 68: Middle East & Africa Market Volume (Units) Forecast by Application, 2020-2035
  • Table 69: Middle East & Africa Market Value (USD Billion) Forecast by End-Use Industry, 2020-2035
  • Table 70: Middle East & Africa Market Volume (Units) Forecast by End-Use Industry, 2020-2035

List of Figures

  • Figure 1: Global Market Volume (Units) Forecast 2020-2035
  • Figure 2: Global Market Pricing Analysis
  • Figure 3: Global Market Value (USD Billion) Forecast 2020-2035
  • Figure 4: Global Market Value Share and BPS Analysis by Material, 2025 and 2035
  • Figure 5: Global Market Y-o-Y Growth Comparison by Material, 2025-2035
  • Figure 6: Global Market Attractiveness Analysis by Material
  • Figure 7: Global Market Value Share and BPS Analysis by Product Type, 2025 and 2035
  • Figure 8: Global Market Y-o-Y Growth Comparison by Product Type, 2025-2035
  • Figure 9: Global Market Attractiveness Analysis by Product Type
  • Figure 10: Global Market Value Share and BPS Analysis by Application, 2025 and 2035
  • Figure 11: Global Market Y-o-Y Growth Comparison by Application, 2025-2035
  • Figure 12: Global Market Attractiveness Analysis by Application
  • Figure 13: Global Market Value Share and BPS Analysis by End-Use Industry, 2025 and 2035
  • Figure 14: Global Market Y-o-Y Growth Comparison by End-Use Industry, 2025-2035
  • Figure 15: Global Market Attractiveness Analysis by End-Use Industry
  • Figure 16: Global Market Value (USD Billion) Share and BPS Analysis by Region, 2025 and 2035
  • Figure 17: Global Market Y-o-Y Growth Comparison by Region, 2025-2035
  • Figure 18: Global Market Attractiveness Analysis by Region
  • Figure 19: North America Market Incremental $ Opportunity, 2025-2035
  • Figure 20: Latin America Market Incremental $ Opportunity, 2025-2035
  • Figure 21: East Asia Market Incremental $ Opportunity, 2025-2035
  • Figure 22: South Asia & Pacific Market Incremental $ Opportunity, 2025-2035
  • Figure 23: Europe Market Incremental $ Opportunity, 2025-2035
  • Figure 24: Middle East & Africa Market Incremental $ Opportunity, 2025-2035
  • Figure 25: North America Market Value Share and BPS Analysis by Country, 2025 and 2035
  • Figure 26: North America Market Value Share and BPS Analysis by Material, 2025 and 2035
  • Figure 27: North America Market Y-o-Y Growth Comparison by Material, 2025-2035
  • Figure 28: North America Market Attractiveness Analysis by Material
  • Figure 29: North America Market Value Share and BPS Analysis by Product Type, 2025 and 2035
  • Figure 30: North America Market Y-o-Y Growth Comparison by Product Type, 2025-2035
  • Figure 31: North America Market Attractiveness Analysis by Product Type
  • Figure 32: North America Market Value Share and BPS Analysis by Application, 2025 and 2035
  • Figure 33: North America Market Y-o-Y Growth Comparison by Application, 2025-2035
  • Figure 34: North America Market Attractiveness Analysis by Application
  • Figure 35: North America Market Value Share and BPS Analysis by End-Use Industry, 2025 and 2035
  • Figure 36: North America Market Y-o-Y Growth Comparison by End-Use Industry, 2025-2035
  • Figure 37: North America Market Attractiveness Analysis by End-Use Industry
  • Figure 38: Latin America Market Value Share and BPS Analysis by Country, 2025 and 2035
  • Figure 39: Latin America Market Value Share and BPS Analysis by Material, 2025 and 2035
  • Figure 40: Latin America Market Y-o-Y Growth Comparison by Material, 2025-2035
  • Figure 41: Latin America Market Attractiveness Analysis by Material
  • Figure 42: Latin America Market Value Share and BPS Analysis by Product Type, 2025 and 2035
  • Figure 43: Latin America Market Y-o-Y Growth Comparison by Product Type, 2025-2035
  • Figure 44: Latin America Market Attractiveness Analysis by Product Type
  • Figure 45: Latin America Market Value Share and BPS Analysis by Application, 2025 and 2035
  • Figure 46: Latin America Market Y-o-Y Growth Comparison by Application, 2025-2035
  • Figure 47: Latin America Market Attractiveness Analysis by Application
  • Figure 48: Latin America Market Value Share and BPS Analysis by End-Use Industry, 2025 and 2035
  • Figure 49: Latin America Market Y-o-Y Growth Comparison by End-Use Industry, 2025-2035
  • Figure 50: Latin America Market Attractiveness Analysis by End-Use Industry
  • Figure 51: East Asia Market Value Share and BPS Analysis by Country, 2025 and 2035
  • Figure 52: East Asia Market Value Share and BPS Analysis by Material, 2025 and 2035
  • Figure 53: East Asia Market Y-o-Y Growth Comparison by Material, 2025-2035
  • Figure 54: East Asia Market Attractiveness Analysis by Material
  • Figure 55: East Asia Market Value Share and BPS Analysis by Product Type, 2025 and 2035
  • Figure 56: East Asia Market Y-o-Y Growth Comparison by Product Type, 2025-2035
  • Figure 57: East Asia Market Attractiveness Analysis by Product Type
  • Figure 58: East Asia Market Value Share and BPS Analysis by Application, 2025 and 2035
  • Figure 59: East Asia Market Y-o-Y Growth Comparison by Application, 2025-2035
  • Figure 60: East Asia Market Attractiveness Analysis by Application
  • Figure 61: East Asia Market Value Share and BPS Analysis by End-Use Industry, 2025 and 2035
  • Figure 62: East Asia Market Y-o-Y Growth Comparison by End-Use Industry, 2025-2035
  • Figure 63: East Asia Market Attractiveness Analysis by End-Use Industry
  • Figure 64: South Asia & Pacific Market Value Share and BPS Analysis by Country, 2025 and 2035
  • Figure 65: South Asia & Pacific Market Value Share and BPS Analysis by Material, 2025 and 2035
  • Figure 66: South Asia & Pacific Market Y-o-Y Growth Comparison by Material, 2025-2035
  • Figure 67: South Asia & Pacific Market Attractiveness Analysis by Material
  • Figure 68: South Asia & Pacific Market Value Share and BPS Analysis by Product Type, 2025 and 2035
  • Figure 69: South Asia & Pacific Market Y-o-Y Growth Comparison by Product Type, 2025-2035
  • Figure 70: South Asia & Pacific Market Attractiveness Analysis by Product Type
  • Figure 71: South Asia & Pacific Market Value Share and BPS Analysis by Application, 2025 and 2035
  • Figure 72: South Asia & Pacific Market Y-o-Y Growth Comparison by Application, 2025-2035
  • Figure 73: South Asia & Pacific Market Attractiveness Analysis by Application
  • Figure 74: South Asia & Pacific Market Value Share and BPS Analysis by End-Use Industry, 2025 and 2035
  • Figure 75: South Asia & Pacific Market Y-o-Y Growth Comparison by End-Use Industry, 2025-2035
  • Figure 76: South Asia & Pacific Market Attractiveness Analysis by End-Use Industry
  • Figure 77: Europe Market Value Share and BPS Analysis by Country, 2025 and 2035
  • Figure 78: Europe Market Value Share and BPS Analysis by Material, 2025 and 2035
  • Figure 79: Europe Market Y-o-Y Growth Comparison by Material, 2025-2035
  • Figure 80: Europe Market Attractiveness Analysis by Material
  • Figure 81: Europe Market Value Share and BPS Analysis by Product Type, 2025 and 2035
  • Figure 82: Europe Market Y-o-Y Growth Comparison by Product Type, 2025-2035
  • Figure 83: Europe Market Attractiveness Analysis by Product Type
  • Figure 84: Europe Market Value Share and BPS Analysis by Application, 2025 and 2035
  • Figure 85: Europe Market Y-o-Y Growth Comparison by Application, 2025-2035
  • Figure 86: Europe Market Attractiveness Analysis by Application
  • Figure 87: Europe Market Value Share and BPS Analysis by End-Use Industry, 2025 and 2035
  • Figure 88: Europe Market Y-o-Y Growth Comparison by End-Use Industry, 2025-2035
  • Figure 89: Europe Market Attractiveness Analysis by End-Use Industry
  • Figure 90: Middle East & Africa Market Value Share and BPS Analysis by Country, 2025 and 2035
  • Figure 91: Middle East & Africa Market Value Share and BPS Analysis by Material, 2025 and 2035
  • Figure 92: Middle East & Africa Market Y-o-Y Growth Comparison by Material, 2025-2035
  • Figure 93: Middle East & Africa Market Attractiveness Analysis by Material
  • Figure 94: Middle East & Africa Market Value Share and BPS Analysis by Product Type, 2025 and 2035
  • Figure 95: Middle East & Africa Market Y-o-Y Growth Comparison by Product Type, 2025-2035
  • Figure 96: Middle East & Africa Market Attractiveness Analysis by Product Type
  • Figure 97: Middle East & Africa Market Value Share and BPS Analysis by Application, 2025 and 2035
  • Figure 98: Middle East & Africa Market Y-o-Y Growth Comparison by Application, 2025-2035
  • Figure 99: Middle East & Africa Market Attractiveness Analysis by Application
  • Figure 100: Middle East & Africa Market Value Share and BPS Analysis by End-Use Industry, 2025 and 2035
  • Figure 101: Middle East & Africa Market Y-o-Y Growth Comparison by End-Use Industry, 2025-2035
  • Figure 102: Middle East & Africa Market Attractiveness Analysis by End-Use Industry
  • Figure 103: Global Market - Tier Structure Analysis
  • Figure 104: Global Market - Company Share Analysis

Frequently Asked Questions

How big will the Parcel Insulation Market be in 2025?

The market will be valued at USD 1.3 billion in 2025.

What is the projected size of the Parcel Insulation Market by 2035?

The market will reach USD 2.5 billion by 2035.

What growth rate is expected for the Parcel Insulation Market between 2025 and 2035?

The market will grow at a CAGR of 6.6% during 2025-2035.

Which material type will lead the Parcel Insulation Market in 2025?

Paper-based insulation will lead with a 36.9% share in 2025.

Which application will anchor demand in 2025?

Food and beverages will anchor demand with a 38.4% share in 2025.

Explore Similar Insights

Future Market Insights

Parcel Insulation Market

Chat With

MaRIA

Hi There, I am MaRIA, Your Market Research Intelligence Assistant. How may I help you?