Passion Fruit Extract Market Size and Share Forecast Outlook 2025 to 2035

The passion fruit extract market is estimated to be valued at USD 745.4 million in 2025 and is projected to reach USD 1669.9 million by 2035, registering a CAGR of 8.4% over the forecast period. The market is projected to add an absolute dollar opportunity of USD 924.5 million over the forecast period. This reflects a 2.24 times growth at a compound annual growth rate of 8.4%. The market’s evolution is expected to be shaped by rising demand for natural flavoring agents, growing awareness of passion fruit health benefits, and broader applications across beverages, confectionery, cosmetics, and nutraceuticals in developed and emerging economies.

By 2030, the market is likely to reach approximately USD 1,115.7 million, accounting for USD 370.3 million in incremental value over the first half of the period. The remaining USD 554.2 million is expected during the second half, suggesting a moderately back-loaded growth pattern, with an absolute dollar opportunity of USD 924.5 million over the forecast period. Product diversification across organic, concentrated, and powdered variants is gaining traction due to evolving consumer preferences and wider adoption in functional food and beverage formulations.

Companies such as Nutrativa Global, Givaudan, and Firmenich are advancing their competitive positions through investments in sustainable sourcing, advanced extraction technologies, and innovative product development. Premium positioning strategies and certifications such as organic and non-GMO are supporting expansion into health-conscious consumer segments and specialty retail channels. Market performance will remain anchored in nutritional awareness campaigns, robust supply chain networks, and adherence to stringent quality standards.
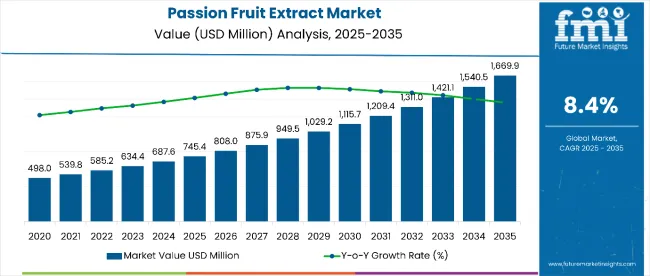
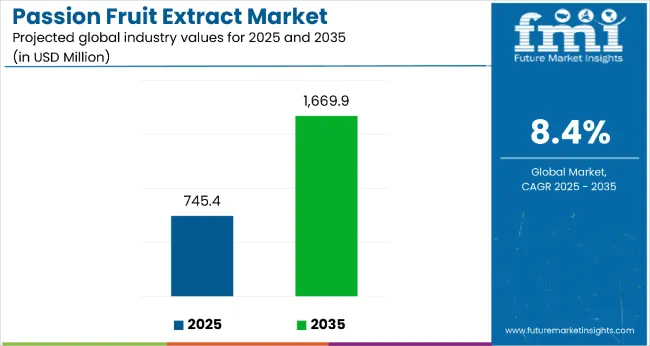
Passion Fruit Extract Market Value Analysis

Quick Stats for Passion Fruit Extract Market

  • Passion Fruit Extract Market Value (2025): USD 745.4 million
  • Passion Fruit Extract Market Forecast Value (2035): USD 1,669.9 million
  • Passion Fruit Extract Market Forecast CAGR: 8.4%
  • Leading Segment in Passion Fruit Extract Market in 2025: Powder (59%)
  • Key Growth Regions in Passion Fruit Extract Market: Asia Pacific and Latin America
  • Top Key Players in Passion Fruit Extract Market: Passi AG (Concentra Holding AG), Making Cosmetics Inc., Caribbean Natural Products, Inc., DENNICK FRUITSOURCE, LLC., NOF Corporation

Passion Fruit Extract Market

Metric Value
Passion Fruit Extract Market Estimated Value in (2025E) USD 745.4 million
Passion Fruit Extract Market Forecast Value in (2035F) USD 1,669.9 million
Forecast CAGR (2025 to 2035) 8.4%

The market holds approximately 42% of the healthy snacking market, driven by its nutritional density, convenience, and versatility in consumption patterns. It accounts for around 35% of the plant-based protein sources market, supported by growing awareness of passion fruit extract as a complete protein alternative. The market contributes nearly 28% to the premium food ingredients segment, particularly for incorporation into bakery, confectionery, and processed food applications. It holds close to 22% of the organic food market, where certified passion fruit extract commands premium pricing among health-conscious consumers. The share in the functional foods market reaches about 31%, reflecting preference among consumers seeking natural sources of healthy fats, vitamins, and minerals.

The market is undergoing structural change driven by rising health consciousness and expanding applications across food and beverage industries. Advanced processing methods including concentration, powdering, flavoring, and packaging innovations have enhanced shelf life, taste profiles, and consumer convenience. Manufacturers are introducing value-added products including fortified beverages, dessert mixes, and functional supplements tailored for specific dietary preferences. Strategic collaborations between growers and food manufacturers have accelerated adoption in processed food applications.

Passion Fruit Extract Market Analysis by Top Investment Segments

The market is segmented by form, source, nature, species type, application, extraction method, and region. By form, the market is divided into powder, oil, and concentrate. Based on source, the market is classified into peel, pulp, and seed. In terms of nature, the market is bifurcated into organic and conventional. By species type, the market is categorized into Passi floraedulis, Passi flora flavicarpa, Passi floraligularis, Passiflora caerulea, and other species types.

By application, the market is segmented into skincare (sunscreen, moisturizer/cream & lotion, eye revitalizers, face cleanser & body wash), haircare (shampoo, conditioner, oil & serum), cosmetics (lip care, nail care), and others (functional foods, beverages, nutraceuticals, and aromatherapy). Based on extraction method, the market is divided into cold process/cold pressed, spray drying, distillation, ultrasound-assisted leaching extraction (UE), supercritical fluid extraction, and others (solvent extraction, microwave-assisted extraction, and fermentation-based methods). Regionally, the market is classified into North America, Latin America, Western Europe, Eastern Europe, South Asia & Pacific, East Asia, and the Middle East & Africa.
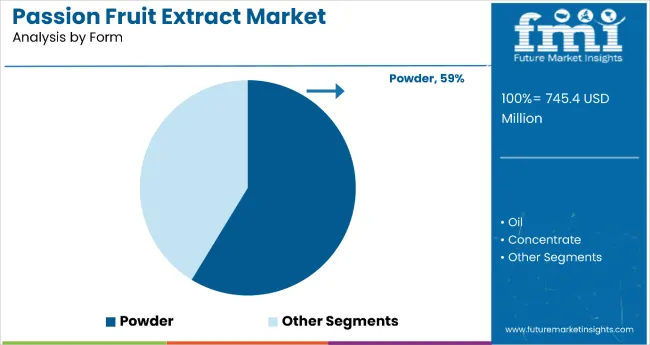
By Form, Powder Accounts for 59% of the Market Share in 2025

Passion Fruit Extract Market By Form

Powder form dominates the market, accounting for 59% of total revenue, making it the most lucrative segment. Its leadership stems from high demand in cosmetics, nutraceuticals, and functional foods, where powdered extracts offer superior stability, ease of formulation, and longer shelf life compared to oil or concentrate. Powder is widely preferred in skincare formulations for its high antioxidant retention and in dietary supplements for its concentrated nutrient profile.

Additionally, powder form is easier to transport, requires less storage space, and maintains bioactive compounds during extended shelf periods, making it ideal for global distribution. Rising consumer interest in natural, plant-based ingredients has also boosted adoption across clean-label food products, protein blends, and beverages. The segment benefits from advancements in spray-drying and microencapsulation technologies, which enhance solubility and bioavailability. With expanding applications in premium beauty and wellness products, powder form is projected to sustain its market leadership over the forecast period.
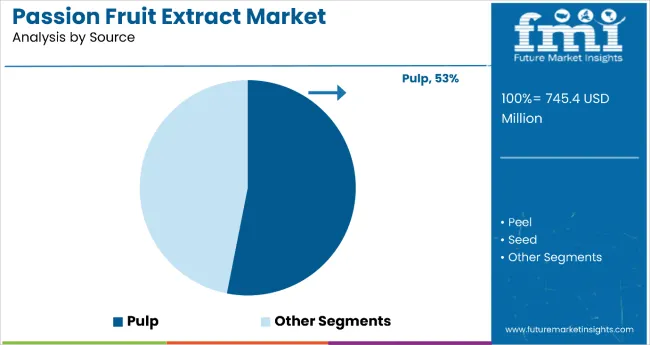
By Source, Pulp Accounts for 53% of the Market Share in 2025

Passion Fruit Extract Market By Source

Pulp stands out as the most lucrative source segment, holding a commanding 53% share of the global passion fruit extract market. This leadership is underpinned by the pulp’s superior nutrient profile, intense natural flavor, and exceptional versatility across multiple industries. In the food and beverage sector, pulp-based extracts are prized for their authentic tropical taste, appealing aroma, and vibrant color, making them a staple in premium juices, smoothies, bakery fillings, and confectionery products.

Within the cosmetics and personal care industry, pulp extract is rich in antioxidants, vitamins A and C, and essential minerals, which contribute to its popularity in anti-aging, brightening, and hydrating skincare formulations. From a production perspective, pulp offers higher extraction efficiency than peel or seed, reducing costs while ensuring consistent quality. Rising global demand for clean-label, plant-based ingredients and exotic flavor profiles further amplifies its market potential. With expanding applications in both functional foods and wellness-focused products, pulp is expected to remain the key growth driver of the passion fruit extract market through 2035.

What are the Drivers, Restraints, and Key Trends of the Passion Fruit Extract Market?

From 2025 to 2035, the market is set to benefit from rising consumer demand for natural, exotic flavoring agents coupled with scientific studies highlighting the fruit’s rich antioxidant profile, vitamin content, and skin-health benefits. This positions manufacturers that emphasize functional wellness claims and clean-label credentials as key beneficiaries in food, beverage, nutraceutical, and personal care sectors.

Rising Demand for Natural and Functional Ingredients Drives Market Growth

Increasing awareness of plant-based nutrition and preventive wellness has emerged as the primary catalyst for passion fruit extract consumption. In 2024, antioxidants and vitamin C content were widely promoted in skincare formulations, while in 2025, pulp-derived extracts gained traction in immunity-boosting beverages and functional foods. Consumer preference for tropical, authentic flavors and products free from synthetic additives is expanding usage across premium juices, flavored teas, and herbal supplements. Manufacturers with verifiable sourcing transparency and scientifically backed benefits are positioned to capture sustained growth from health-driven and clean-label product demand.

Premium Applications and Sustainable Sourcing Create Market Opportunities

In 2024, value-added formats such as organic-certified extracts, freeze-dried powders, and blended functional beverages were gaining market share via premium positioning. By 2025, ethical sourcing practices, fair-trade certifications, and eco-friendly packaging became key differentiators for accessing high-value export markets and eco-conscious consumer segments. These trends show that innovation beyond standard extracts through diversified formats, enhanced sensory profiles, and sustainability credential scan command premium pricing, strengthen brand loyalty, and expand presence in competitive global markets.
Analysis of Passion Fruit Extract Market by Key Countries

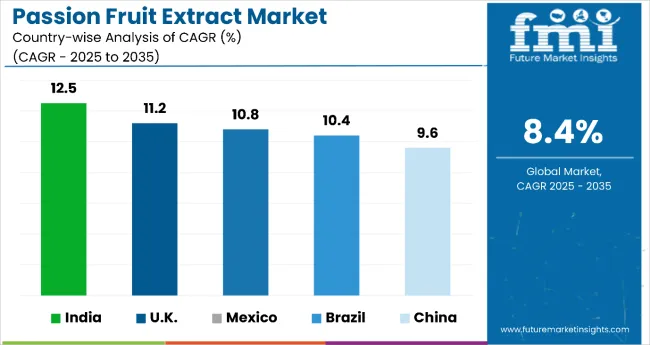
Country Wise Analysis Of Passion Fruit Extract Market

Country CAGR
India 12.5%
UK 11.2%
Mexico 10.8%
Brazil 10.4%
China 9.6%

Among the top five markets for passion fruit extract, India leads with the highest CAGR of 12.5%, reflecting rapid production expansion, government-backed export incentives, and strong domestic wellness product demand. The UK follows at 11.2%, driven by a mature functional food and beverage sector, along with high-value cosmetic applications. Mexico posts a robust 10.8%, leveraging abundant local production and proximity to USA markets for export-led growth. Brazil records a 10.4% CAGR, supported by its dominant global production capacity and diversified application base in food, beverage, and cosmetics. China, while the lowest among the five at 9.6%, still shows healthy growth from rising health-conscious consumption, technological integration, and expanding e-commerce channels.

The report covers an in-depth analysis of 40+ countries; five top-performing OECD countries are highlighted below.

Production Capacity Trends in Passion Fruit Extract Market in India

Sales of passion fruit extract in India are projected to grow at a CAGR of 12.5%, supported by expanding cultivation areas in states like Kerala and Mizoram. Increasing domestic consumption of natural health products, coupled with demand from nutraceutical and cosmetic sectors, is fueling capacity expansion. Farmers are adopting improved cultivation techniques and processing technologies, reducing post-harvest losses. Strong government support for agri-based exports and rural entrepreneurship is attracting private investments. The growing wellness industry is a major consumer of passion fruit extract, while India’s strategic position enables strong export potential. Rising urban incomes and e-commerce penetration are further accelerating distribution growth.

  • Growing adoption of precision farming for passion fruit.
  • Increased export orders from Middle East and European markets.
  • Expansion of cold-chain infrastructure for fresh fruit supply.

Output Expansion in Passion Fruit Extract Market in UK

The UK passion fruit extract revenue is set to expand at a CAGR of 11.2%, driven by rising demand for exotic fruit-based beverages and functional food products. Importers are securing direct sourcing agreements with Latin American and African producers to maintain year-round supply. Health-conscious consumers are embracing passion fruit extract for its antioxidant and vitamin-rich profile, fueling product launches in smoothies, sports drinks, and supplements. The cosmetic sector is increasingly incorporating passion fruit oil in skincare products due to its hydrating and anti-aging benefits. The UK’s strong retail distribution network and advanced R&D capabilities support innovative product formulations.

  • Surge in new functional beverage launches using passion fruit extract.
  • Growing popularity of plant-based wellness products.
  • Increase in retail shelf space for exotic fruit ingredients.

Structural Adoption in Passion Fruit Extract Market in Mexico

Demand passion fruit extract in Mexico is projected to grow at a CAGR of 10.8%, supported by abundant local production of passion fruit and strong processing capacity. The country’s tropical climate allows for consistent year-round harvesting, ensuring supply stability for both domestic and export markets. Manufacturers are investing in modern extraction facilities to improve yield and maintain high purity standards. Passion fruit extract is being incorporated into juices, alcoholic cocktails, and traditional desserts, enhancing its market presence. Mexico’s proximity to the USA gives it a competitive advantage in fulfilling North American demand, while growing domestic wellness trends further support market expansion.

  • High availability of locally grown passion fruit.
  • Expansion of food processing units in rural regions.
  • Export growth to the USA and Canada.

Supply Chain Diversification in Passion Fruit Extract Market in Brazil

Revenue from passion fruit extract in Brazil is anticipated to grow at a CAGR of 10.4%, driven by its position as one of the world’s largest passion fruit producers. The country’s processing industry benefits from abundant raw material supply and established export channels to Europe, Asia, and North America. Government incentives for agri-processing, coupled with sustainable farming initiatives, are boosting production efficiency. Brazilian manufacturers are diversifying supply chains to mitigate climate and logistics risks. Passion fruit extract’s growing role in health drinks, confectionery, and personal care products is reinforcing domestic demand alongside expanding global interest.

  • Leadership position in global passion fruit production.
  • Diverse applications in food, beverage, and cosmetics.
  • Implementation of sustainable cultivation practices.

Technological Integration in Passion Fruit Extract Market in China

Sales of passion fruit extract in China are expected to expand at a CAGR of 9.6%, fueled by rapid adoption of modern agricultural practices in southern provinces. Domestic production is being supported by government-led initiatives to promote fruit-based health products. Manufacturers are integrating advanced extraction technologies to ensure consistent quality for use in nutraceuticals and beverages. The rising middle-class population is driving demand for functional foods and supplements. Strategic import partnerships ensure a steady supply of passion fruit during off-season months, while e-commerce platforms are making the product more accessible to urban consumers nationwide.
  • Integration of automation in fruit processing plants.
  • Expansion of domestic passion fruit cultivation zones.
  • Rising consumer demand for antioxidant-rich products.

Competitive Landscape of Passion Fruit Extract Market

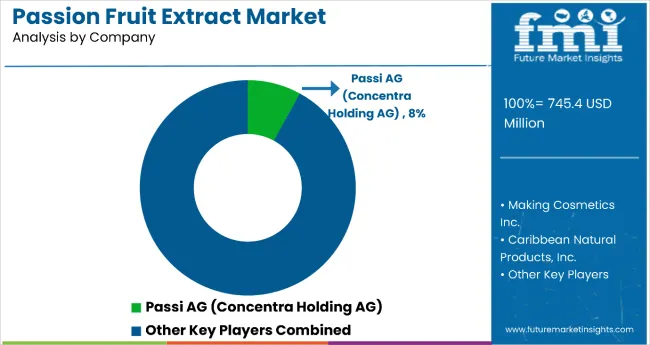
Passion Fruit Extract Market By Company

The market is moderately consolidated, with leading companies Passi AG (Concreat Holding AG) holding 8% strong foothold through vertically integrated operations, advanced extraction technologies, and diversified product portfolios catering to food, beverage, nutraceutical, and cosmetic industries. Market leaders leverage global sourcing networks, R&D capabilities, and strategic partnerships to maintain quality consistency, scale production, and meet evolving consumer demands for natural and functional ingredients.

Key players include Döhler GmbH, Nactarome S.p.A., Symrise AG, Kerry Group plc, Flavorcan International Inc., Flavour tech Pty Ltd, Blue Pacific Flavors, Givaudan SA, Kalsec Inc., Archer Daniels Midland Company, Citromax Group, and Ingredion Incorporated. These companies specialize in producing passion fruit extracts in various formsliquid, powder, and concentrate stailored for applications in juices, flavored water, functional foods, dietary supplements, personal care products, and fragrances.

Market growth is driven by rising consumer demand for natural and exotic flavor profiles, increasing use of passion fruit extract in clean-label formulations, expanding applications in health and wellness products, growing awareness of antioxidant and vitamin-rich properties, and premiumization trends in both developed and emerging markets.

Report Scope - Passion Fruit Extract Market

Item Value
Quantitative Units USD 745.4 Million
Form Powder, Oil, and Concentrate
Source Peel, Pup, and Seed
Nature Organic and Conventional
Species Type Passiflora Edulis, Passiflora Flavicarpa, Passiflora Ligularis, Passiflora Caerulea, Others (including lesser-known passion fruit species and hybrids)
Application Skincare (Sunscreen; Moisturizer, Cream & Lotion; Eye Revitalizers; Face Cleanser & Body Wash), Haircare (Shampoo; Conditioner; Oil & Serum), Cosmetics (Lip Care; Nail Care), Others (including aromatherapy, spa products, and specialty formulations)
Extraction Method Cold Process/Cold Pressed, Spray Drying, Distillation, Ultrasound Assisted Leaching Extraction (UE), Supercritical Fluid Extraction, Others (including solvent extraction, microwave-assisted extraction, and fermentation-based methods)
Regions Covered North America, Europe, Asia-Pacific, Latin America, Middle East & Africa
Country Covered United States, Canada, Germany, France, United Kingdom, China, Japan, India, Brazil, South Africa , Australia add 40+ countries
Key Companies Profiled MakingCosmetics Inc., Passi AG (Concentra Holding AG), Caribbean Natural Products, Inc., DENNICK FRUITSOURCE, LLC., NOF Corporation, Jedwards International, Inc., Natural Sourcing, LLC., Symrise
Additional Attributes Increasing demand for natural flavoring agents, rising application in functional foods & beverages, growing clean-label product trends

Key Segmentation

By Form:

  • Powder
  • Oil
  • Concentrate

By Source:

  • Peel
  • Pulp
  • Seed

By Nature:

  • Organic
  • Conventional

By Species Type:

  • Passiflora edulis
  • Passiflora flavicarpa
  • Passiflora ligularis
  • Passiflora caerulea
  • Other Species Types

By Application:

  • Skincare
    • Sunscreen
    • Moisturizer, Cream & Lotion
    • Eye Revilitizers
    • Face Cleanser & Body Wash
  • Haircare
    • Shampoo
    • Conditioner
    • Oil & Serum
  • Cosmetics
    • Lip Care
    • Nail Care
  • Other Applications

By Extraction Method:

  • Cold Process or Cold Pressed
  • Spray Drying
  • Distillation
  • Ultrasound Assisted Leaching Extraction (UE)
  • Supercritical Fluid Extraction
  • Other Extraction Methods

By Region:

  • North America
  • Latin America
  • Europe
  • East Asia
  • South Asia
  • Oceania
  • Middle East and Africa (MEA)

Table of Content

  1. Executive Summary
    • Global Market Outlook
    • Demand-side Trends
    • Supply-side Trends
    • Technology Roadmap Analysis
    • Analysis and Recommendations
  2. Market Overview
    • Market Coverage / Taxonomy
    • Market Definition / Scope / Limitations
  3. Market Background
    • Market Dynamics
      • Drivers
      • Restraints
      • Opportunity
      • Trends
    • Scenario Forecast
      • Demand in Optimistic Scenario
      • Demand in Likely Scenario
      • Demand in Conservative Scenario
    • Opportunity Map Analysis
    • Product Life Cycle Analysis
    • Supply Chain Analysis
      • Supply Side Participants and their Roles
        • Producers
        • Mid-Level Participants (Traders/ Agents/ Brokers)
        • Wholesalers and Distributors
      • Value Added and Value Created at Node in the Supply Chain
      • List of Raw Material Suppliers
      • List of Existing and Potential Buyer’s
    • Investment Feasibility Matrix
    • Value Chain Analysis
      • Profit Margin Analysis
      • Wholesalers and Distributors
      • Retailers
    • PESTLE and Porter’s Analysis
    • Regulatory Landscape
      • By Key Regions
      • By Key Countries
    • Regional Parent Market Outlook
    • Production and Consumption Statistics
    • Import and Export Statistics
  4. Global Market Analysis 2020 to 2024 and Forecast, 2025 to 2035
    • Historical Market Size Value (USD Million) & Volume (Metric Tons) Analysis, 2020 to 2024
    • Current and Future Market Size Value (USD Million) & Volume (Metric Tons) Projections, 2025 to 2035
      • Y-o-Y Growth Trend Analysis
      • Absolute $ Opportunity Analysis
  5. Global Market Pricing Analysis 2020 to 2024 and Forecast 2025 to 2035
  6. Global Market Analysis 2020 to 2024 and Forecast 2025 to 2035, By Form
    • Introduction / Key Findings
    • Historical Market Size Value (USD Million) & Volume (Metric Tons) Analysis By Form, 2020 to 2024
    • Current and Future Market Size Value (USD Million) & Volume (Metric Tons) Analysis and Forecast By Form, 2025 to 2035
      • Powder
      • Oil
      • Concentrate
    • Y-o-Y Growth Trend Analysis By Form, 2020 to 2024
    • Absolute $ Opportunity Analysis By Form, 2025 to 2035
  7. Global Market Analysis 2020 to 2024 and Forecast 2025 to 2035, By Source
    • Introduction / Key Findings
    • Historical Market Size Value (USD Million) & Volume (Metric Tons) Analysis By Source, 2020 to 2024
    • Current and Future Market Size Value (USD Million) & Volume (Metric Tons) Analysis and Forecast By Source, 2025 to 2035
      • Peel
      • Pulp
      • Seed
    • Y-o-Y Growth Trend Analysis By Source, 2020 to 2024
    • Absolute $ Opportunity Analysis By Source, 2025 to 2035
  8. Global Market Analysis 2020 to 2024 and Forecast 2025 to 2035, By Nature
    • Introduction / Key Findings
    • Historical Market Size Value (USD Million) & Volume (Metric Tons) Analysis By Nature, 2020 to 2024
    • Current and Future Market Size Value (USD Million) & Volume (Metric Tons) Analysis and Forecast By Nature, 2025 to 2035
      • Organic
      • Conventional
    • Y-o-Y Growth Trend Analysis By Nature, 2020 to 2024
    • Absolute $ Opportunity Analysis By Nature, 2025 to 2035
  9. Global Market Analysis 2020 to 2024 and Forecast 2025 to 2035, By Species Type
    • Introduction / Key Findings
    • Historical Market Size Value (USD Million) & Volume (Metric Tons) Analysis By Species Type, 2020 to 2024
    • Current and Future Market Size Value (USD Million) & Volume (Metric Tons) Analysis and Forecast By Species Type, 2025 to 2035
      • Passiflora Edulis
      • Passiflora Flavicarpa
      • Passiflora Ligularis
      • Passiflora Caerulea
      • Others Species Types
    • Y-o-Y Growth Trend Analysis By Species Type, 2020 to 2024
    • Absolute $ Opportunity Analysis By Species Type, 2025 to 2035
  10. Global Market Analysis 2020 to 2024 and Forecast 2025 to 2035, By Application
    • Introduction / Key Findings
    • Historical Market Size Value (USD Million) & Volume (Metric Tons) Analysis By Application, 2020 to 2024
    • Current and Future Market Size Value (USD Million) & Volume (Metric Tons) Analysis and Forecast By Application, 2025 to 2035
      • Skincare
        • Sunscreen
        • Moisturizer, Cream & Lotion
        • Eye Revitalizers
        • Face Cleanser & Body Wash
      • Haircare
        • Shampoo
        • Conditioner
        • Oil & Serum
      • Cosmetics
        • Lip Care
        • Nail Care
      • Others (Functional Foods, Beverages, Nutraceuticals, and Aromatherapy)
    • Y-o-Y Growth Trend Analysis By Application, 2020 to 2024
    • Absolute $ Opportunity Analysis By Application, 2025 to 2035
  11. Global Market Analysis 2020 to 2024 and Forecast 2025 to 2035, By Extraction Method
    • Introduction / Key Findings
    • Historical Market Size Value (USD Million) & Volume (Metric Tons) Analysis By Extraction Method, 2020 to 2024
    • Current and Future Market Size Value (USD Million) & Volume (Metric Tons) Analysis and Forecast By Extraction Method, 2025 to 2035
      • Cold Process/Cold Pressed
      • Spray Drying
      • Distillation
      • Ultrasound Assisted Leaching Extraction (UE)
      • Supercritical Fluid Extraction
      • Others (Solvent Extraction, Microwave-Assisted Extraction, and Fermentation-Based Methods)
    • Y-o-Y Growth Trend Analysis By Extraction Method, 2020 to 2024
    • Absolute $ Opportunity Analysis By Extraction Method, 2025 to 2035
  12. Global Market Analysis 2020 to 2024 and Forecast 2025 to 2035, By Region
    • Introduction
    • Historical Market Size Value (USD Million) & Volume (Metric Tons) Analysis By Region, 2020 to 2024
    • Current Market Size Value (USD Million) & Volume (Metric Tons) Analysis and Forecast By Region, 2025 to 2035
      • North America
      • Latin America
      • Western Europe
      • Eastern Europe
      • East Asia
      • South Asia & Pacific
      • Middle East and Africa
    • Market Attractiveness Analysis By Region
  13. North America Market Analysis 2020 to 2024 and Forecast 2025 to 2035, By Country
    • Historical Market Size Value (USD Million) & Volume (Metric Tons) Trend Analysis By Market Taxonomy, 2020 to 2024
    • Market Size Value (USD Million) & Volume (Metric Tons) Forecast By Market Taxonomy, 2025 to 2035
      • By Country
        • USA
        • Canada
        • Mexico
      • By Form
      • By Source
      • By Nature
      • By Species Type
      • By Application
      • By Extraction Method
    • Market Attractiveness Analysis
      • By Country
      • By Form
      • By Source
      • By Nature
      • By Species Type
      • By Application
      • By Extraction Method
    • Key Takeaways
  14. Latin America Market Analysis 2020 to 2024 and Forecast 2025 to 2035, By Country
    • Historical Market Size Value (USD Million) & Volume (Metric Tons) Trend Analysis By Market Taxonomy, 2020 to 2024
    • Market Size Value (USD Million) & Volume (Metric Tons) Forecast By Market Taxonomy, 2025 to 2035
      • By Country
        • Brazil
        • Argentina
        • Rest of LATAM
      • By Form
      • By Source
      • By Nature
      • By Species Type
      • By Application
      • By Extraction Method
    • Market Attractiveness Analysis
      • By Country
      • By Form
      • By Source
      • By Nature
      • By Species Type
      • By Application
      • By Extraction Method
    • Key Takeaways
  15. Western Europe Market Analysis 2020 to 2024 and Forecast 2025 to 2035, By Country
    • Historical Market Size Value (USD Million) & Volume (Metric Tons) Trend Analysis By Market Taxonomy, 2020 to 2024
    • Market Size Value (USD Million) & Volume (Metric Tons) Forecast By Market Taxonomy, 2025 to 2035
      • By Country
        • Germany
        • Italy
        • France
        • UK
        • Spain
        • BENELUX
        • Nordic
        • Rest of W.Europe
      • By Form
      • By Source
      • By Nature
      • By Species Type
      • By Application
      • By Extraction Method
    • Market Attractiveness Analysis
      • By Country
      • By Form
      • By Source
      • By Nature
      • By Species Type
      • By Application
      • By Extraction Method
    • Key Takeaways
  16. Eastern Europe Market Analysis 2020 to 2024 and Forecast 2025 to 2035, By Country
    • Historical Market Size Value (USD Million) & Volume (Metric Tons) Trend Analysis By Market Taxonomy, 2020 to 2024
    • Market Size Value (USD Million) & Volume (Metric Tons) Forecast By Market Taxonomy, 2025 to 2035
      • By Country
        • Russia
        • Hungary
        • Poland
        • Balkan & Baltics
        • Rest of E. Europe
      • By Form
      • By Source
      • By Nature
      • By Species Type
      • By Application
      • By Extraction Method
    • Market Attractiveness Analysis
      • By Country
      • By Form
      • By Source
      • By Nature
      • By Species Type
      • By Application
      • By Extraction Method
    • Key Takeaways
  17. East Asia Market Analysis 2020 to 2024 and Forecast 2025 to 2035, By Country
    • Historical Market Size Value (USD Million) & Volume (Metric Tons) Trend Analysis By Market Taxonomy, 2020 to 2024
    • Market Size Value (USD Million) & Volume (Metric Tons) Forecast By Market Taxonomy, 2025 to 2035
      • By Country
        • China
        • Japan
        • South Korea
      • By Form
      • By Source
      • By Nature
      • By Species Type
      • By Application
      • By Extraction Method
    • Market Attractiveness Analysis
      • By Country
      • By Form
      • By Source
      • By Nature
      • By Species Type
      • By Application
      • By Extraction Method
    • Key Takeaways
  18. South Asia & Pacific Market Analysis 2020 to 2024 and Forecast 2025 to 2035, By Country
    • Historical Market Size Value (USD Million) & Volume (Metric Tons) Trend Analysis By Market Taxonomy, 2020 to 2024
    • Market Size Value (USD Million) & Volume (Metric Tons) Forecast By Market Taxonomy, 2025 to 2035
      • By Country
        • India
        • Australia & New Zealand
        • ASEAN
        • Rest of SAP
      • By Form
      • By Source
      • By Nature
      • By Species Type
      • By Application
      • By Extraction Method
    • Market Attractiveness Analysis
      • By Country
      • By Form
      • By Source
      • By Nature
      • By Species Type
      • By Application
      • By Extraction Method
    • Key Takeaways
  19. Middle East and Africa Market Analysis 2020 to 2024 and Forecast 2025 to 2035, By Country
    • Historical Market Size Value (USD Million) & Volume (Metric Tons) Trend Analysis By Market Taxonomy, 2020 to 2024
    • Market Size Value (USD Million) & Volume (Metric Tons) Forecast By Market Taxonomy, 2025 to 2035
      • By Country
        • GCC Countries
        • Northern Africa
        • South Africa
        • Turkiye
        • Rest of MEA
      • By Form
      • By Source
      • By Nature
      • By Species Type
      • By Application
      • By Extraction Method
    • Market Attractiveness Analysis
      • By Country
      • By Form
      • By Source
      • By Nature
      • By Species Type
      • By Application
      • By Extraction Method
    • Key Takeaways
  20. Key Countries Market Analysis
    • USA
      • Pricing Analysis
      • Market Share Analysis, 2024
        • By Form
        • By Source
        • By Nature
        • By Species Type
        • By Application
        • By Extraction Method
    • Canada
      • Pricing Analysis
      • Market Share Analysis, 2024
        • By Form
        • By Source
        • By Nature
        • By Species Type
        • By Application
        • By Extraction Method
    • Brazil
      • Pricing Analysis
      • Market Share Analysis, 2024
        • By Form
        • By Source
        • By Nature
        • By Species Type
        • By Application
        • By Extraction Method
    • Mexico
      • Pricing Analysis
      • Market Share Analysis, 2024
        • By Form
        • By Source
        • By Nature
        • By Species Type
        • By Application
        • By Extraction Method
    • Argentina
      • Pricing Analysis
      • Market Share Analysis, 2024
        • By Form
        • By Source
        • By Nature
        • By Species Type
        • By Application
        • By Extraction Method
  21. Market Structure Analysis
    • Competition Dashboard
    • Competition Benchmarking
    • Market Share Analysis of Top Players
      • By Regional
      • By Form
      • By Source
      • By Nature
      • By Species Type
      • By Application
      • By Extraction Method
  22. Competition Analysis
    • Competition Deep Dive
      • MakingCosmetics Inc.
        • Overview
        • Product Portfolio
        • Profitability by Market Segments (Product/Age /Sales Channel/Region)
        • Sales Footprint
        • Strategy Overview
          • Marketing Strategy
          • Product Strategy
          • Channel Strategy
      • Passi AG (Concentra Holding AG)
        • Overview
        • Product Portfolio
        • Profitability by Market Segments (Product/Age /Sales Channel/Region)
        • Sales Footprint
        • Strategy Overview
          • Marketing Strategy
          • Product Strategy
          • Channel Strategy
      • Caribbean Natural Products, Inc.
        • Overview
        • Product Portfolio
        • Profitability by Market Segments (Product/Age /Sales Channel/Region)
        • Sales Footprint
        • Strategy Overview
          • Marketing Strategy
          • Product Strategy
          • Channel Strategy
      • DENNICK FRUITSOURCE, LLC.
        • Overview
        • Product Portfolio
        • Profitability by Market Segments (Product/Age /Sales Channel/Region)
        • Sales Footprint
        • Strategy Overview
          • Marketing Strategy
          • Product Strategy
          • Channel Strategy
      • NOF Corporation
        • Overview
        • Product Portfolio
        • Profitability by Market Segments (Product/Age /Sales Channel/Region)
        • Sales Footprint
        • Strategy Overview
          • Marketing Strategy
          • Product Strategy
          • Channel Strategy
      • Jedwards International, Inc.
        • Overview
        • Product Portfolio
        • Profitability by Market Segments (Product/Age /Sales Channel/Region)
        • Sales Footprint
        • Strategy Overview
          • Marketing Strategy
          • Product Strategy
          • Channel Strategy
      • Natural Sourcing, LLC.
        • Overview
        • Product Portfolio
        • Profitability by Market Segments (Product/Age /Sales Channel/Region)
        • Sales Footprint
        • Strategy Overview
          • Marketing Strategy
          • Product Strategy
          • Channel Strategy
      • Symrise
        • Overview
        • Product Portfolio
        • Profitability by Market Segments (Product/Age /Sales Channel/Region)
        • Sales Footprint
        • Strategy Overview
          • Marketing Strategy
          • Product Strategy
          • Channel Strategy
  23. Assumptions & Acronyms Used
  24. Research Methodology

List of Tables

  • Table 1: Global Market Value (USD Million) Forecast by Region, 2020-2035
  • Table 2: Global Market Volume (Metric Tons) Forecast by Region, 2020-2035
  • Table 3: Global Market Value (USD Million) Forecast by Form, 2020-2035
  • Table 4: Global Market Volume (Metric Tons) Forecast by Form, 2020-2035
  • Table 5: Global Market Value (USD Million) Forecast by Source, 2020-2035
  • Table 6: Global Market Volume (Metric Tons) Forecast by Source, 2020-2035
  • Table 7: Global Market Value (USD Million) Forecast by Nature, 2020-2035
  • Table 8: Global Market Volume (Metric Tons) Forecast by Nature, 2020-2035
  • Table 9: Global Market Value (USD Million) Forecast by Species Type, 2020-2035
  • Table 10: Global Market Volume (Metric Tons) Forecast by Species Type, 2020-2035
  • Table 11: Global Market Value (USD Million) Forecast by Application, 2020-2035
  • Table 12: Global Market Volume (Metric Tons) Forecast by Application, 2020-2035
  • Table 13: Global Market Value (USD Million) Forecast by Extraction Method, 2020-2035
  • Table 14: Global Market Volume (Metric Tons) Forecast by Extraction Method, 2020-2035
  • Table 15: North America Market Value (USD Million) Forecast by Country, 2020-2035
  • Table 16: North America Market Volume (Metric Tons) Forecast by Country, 2020-2035
  • Table 17: North America Market Value (USD Million) Forecast by Form, 2020-2035
  • Table 18: North America Market Volume (Metric Tons) Forecast by Form, 2020-2035
  • Table 19: North America Market Value (USD Million) Forecast by Source, 2020-2035
  • Table 20: North America Market Volume (Metric Tons) Forecast by Source, 2020-2035
  • Table 21: North America Market Value (USD Million) Forecast by Nature, 2020-2035
  • Table 22: North America Market Volume (Metric Tons) Forecast by Nature, 2020-2035
  • Table 23: North America Market Value (USD Million) Forecast by Species Type, 2020-2035
  • Table 24: North America Market Volume (Metric Tons) Forecast by Species Type, 2020-2035
  • Table 25: North America Market Value (USD Million) Forecast by Application, 2020-2035
  • Table 26: North America Market Volume (Metric Tons) Forecast by Application, 2020-2035
  • Table 27: North America Market Value (USD Million) Forecast by Extraction Method, 2020-2035
  • Table 28: North America Market Volume (Metric Tons) Forecast by Extraction Method, 2020-2035
  • Table 29: Latin America Market Value (USD Million) Forecast by Country, 2020-2035
  • Table 30: Latin America Market Volume (Metric Tons) Forecast by Country, 2020-2035
  • Table 31: Latin America Market Value (USD Million) Forecast by Form, 2020-2035
  • Table 32: Latin America Market Volume (Metric Tons) Forecast by Form, 2020-2035
  • Table 33: Latin America Market Value (USD Million) Forecast by Source, 2020-2035
  • Table 34: Latin America Market Volume (Metric Tons) Forecast by Source, 2020-2035
  • Table 35: Latin America Market Value (USD Million) Forecast by Nature, 2020-2035
  • Table 36: Latin America Market Volume (Metric Tons) Forecast by Nature, 2020-2035
  • Table 37: Latin America Market Value (USD Million) Forecast by Species Type, 2020-2035
  • Table 38: Latin America Market Volume (Metric Tons) Forecast by Species Type, 2020-2035
  • Table 39: Latin America Market Value (USD Million) Forecast by Application, 2020-2035
  • Table 40: Latin America Market Volume (Metric Tons) Forecast by Application, 2020-2035
  • Table 41: Latin America Market Value (USD Million) Forecast by Extraction Method, 2020-2035
  • Table 42: Latin America Market Volume (Metric Tons) Forecast by Extraction Method, 2020-2035
  • Table 43: Western Europe Market Value (USD Million) Forecast by Country, 2020-2035
  • Table 44: Western Europe Market Volume (Metric Tons) Forecast by Country, 2020-2035
  • Table 45: Western Europe Market Value (USD Million) Forecast by Form, 2020-2035
  • Table 46: Western Europe Market Volume (Metric Tons) Forecast by Form, 2020-2035
  • Table 47: Western Europe Market Value (USD Million) Forecast by Source, 2020-2035
  • Table 48: Western Europe Market Volume (Metric Tons) Forecast by Source, 2020-2035
  • Table 49: Western Europe Market Value (USD Million) Forecast by Nature, 2020-2035
  • Table 50: Western Europe Market Volume (Metric Tons) Forecast by Nature, 2020-2035
  • Table 51: Western Europe Market Value (USD Million) Forecast by Species Type, 2020-2035
  • Table 52: Western Europe Market Volume (Metric Tons) Forecast by Species Type, 2020-2035
  • Table 53: Western Europe Market Value (USD Million) Forecast by Application, 2020-2035
  • Table 54: Western Europe Market Volume (Metric Tons) Forecast by Application, 2020-2035
  • Table 55: Western Europe Market Value (USD Million) Forecast by Extraction Method, 2020-2035
  • Table 56: Western Europe Market Volume (Metric Tons) Forecast by Extraction Method, 2020-2035
  • Table 57: Eastern Europe Market Value (USD Million) Forecast by Country, 2020-2035
  • Table 58: Eastern Europe Market Volume (Metric Tons) Forecast by Country, 2020-2035
  • Table 59: Eastern Europe Market Value (USD Million) Forecast by Form, 2020-2035
  • Table 60: Eastern Europe Market Volume (Metric Tons) Forecast by Form, 2020-2035
  • Table 61: Eastern Europe Market Value (USD Million) Forecast by Source, 2020-2035
  • Table 62: Eastern Europe Market Volume (Metric Tons) Forecast by Source, 2020-2035
  • Table 63: Eastern Europe Market Value (USD Million) Forecast by Nature, 2020-2035
  • Table 64: Eastern Europe Market Volume (Metric Tons) Forecast by Nature, 2020-2035
  • Table 65: Eastern Europe Market Value (USD Million) Forecast by Species Type, 2020-2035
  • Table 66: Eastern Europe Market Volume (Metric Tons) Forecast by Species Type, 2020-2035
  • Table 67: Eastern Europe Market Value (USD Million) Forecast by Application, 2020-2035
  • Table 68: Eastern Europe Market Volume (Metric Tons) Forecast by Application, 2020-2035
  • Table 69: Eastern Europe Market Value (USD Million) Forecast by Extraction Method, 2020-2035
  • Table 70: Eastern Europe Market Volume (Metric Tons) Forecast by Extraction Method, 2020-2035
  • Table 71: East Asia Market Value (USD Million) Forecast by Country, 2020-2035
  • Table 72: East Asia Market Volume (Metric Tons) Forecast by Country, 2020-2035
  • Table 73: East Asia Market Value (USD Million) Forecast by Form, 2020-2035
  • Table 74: East Asia Market Volume (Metric Tons) Forecast by Form, 2020-2035
  • Table 75: East Asia Market Value (USD Million) Forecast by Source, 2020-2035
  • Table 76: East Asia Market Volume (Metric Tons) Forecast by Source, 2020-2035
  • Table 77: East Asia Market Value (USD Million) Forecast by Nature, 2020-2035
  • Table 78: East Asia Market Volume (Metric Tons) Forecast by Nature, 2020-2035
  • Table 79: East Asia Market Value (USD Million) Forecast by Species Type, 2020-2035
  • Table 80: East Asia Market Volume (Metric Tons) Forecast by Species Type, 2020-2035
  • Table 81: East Asia Market Value (USD Million) Forecast by Application, 2020-2035
  • Table 82: East Asia Market Volume (Metric Tons) Forecast by Application, 2020-2035
  • Table 83: East Asia Market Value (USD Million) Forecast by Extraction Method, 2020-2035
  • Table 84: East Asia Market Volume (Metric Tons) Forecast by Extraction Method, 2020-2035
  • Table 85: South Asia & Pacific Market Value (USD Million) Forecast by Country, 2020-2035
  • Table 86: South Asia & Pacific Market Volume (Metric Tons) Forecast by Country, 2020-2035
  • Table 87: South Asia & Pacific Market Value (USD Million) Forecast by Form, 2020-2035
  • Table 88: South Asia & Pacific Market Volume (Metric Tons) Forecast by Form, 2020-2035
  • Table 89: South Asia & Pacific Market Value (USD Million) Forecast by Source, 2020-2035
  • Table 90: South Asia & Pacific Market Volume (Metric Tons) Forecast by Source, 2020-2035
  • Table 91: South Asia & Pacific Market Value (USD Million) Forecast by Nature, 2020-2035
  • Table 92: South Asia & Pacific Market Volume (Metric Tons) Forecast by Nature, 2020-2035
  • Table 93: South Asia & Pacific Market Value (USD Million) Forecast by Species Type, 2020-2035
  • Table 94: South Asia & Pacific Market Volume (Metric Tons) Forecast by Species Type, 2020-2035
  • Table 95: South Asia & Pacific Market Value (USD Million) Forecast by Application, 2020-2035
  • Table 96: South Asia & Pacific Market Volume (Metric Tons) Forecast by Application, 2020-2035
  • Table 97: South Asia & Pacific Market Value (USD Million) Forecast by Extraction Method, 2020-2035
  • Table 98: South Asia & Pacific Market Volume (Metric Tons) Forecast by Extraction Method, 2020-2035
  • Table 99: Middle East and Africa Market Value (USD Million) Forecast by Country, 2020-2035
  • Table 100: Middle East and Africa Market Volume (Metric Tons) Forecast by Country, 2020-2035
  • Table 101: Middle East and Africa Market Value (USD Million) Forecast by Form, 2020-2035
  • Table 102: Middle East and Africa Market Volume (Metric Tons) Forecast by Form, 2020-2035
  • Table 103: Middle East and Africa Market Value (USD Million) Forecast by Source, 2020-2035
  • Table 104: Middle East and Africa Market Volume (Metric Tons) Forecast by Source, 2020-2035
  • Table 105: Middle East and Africa Market Value (USD Million) Forecast by Nature, 2020-2035
  • Table 106: Middle East and Africa Market Volume (Metric Tons) Forecast by Nature, 2020-2035
  • Table 107: Middle East and Africa Market Value (USD Million) Forecast by Species Type, 2020-2035
  • Table 108: Middle East and Africa Market Volume (Metric Tons) Forecast by Species Type, 2020-2035
  • Table 109: Middle East and Africa Market Value (USD Million) Forecast by Application, 2020-2035
  • Table 110: Middle East and Africa Market Volume (Metric Tons) Forecast by Application, 2020-2035
  • Table 111: Middle East and Africa Market Value (USD Million) Forecast by Extraction Method, 2020-2035
  • Table 112: Middle East and Africa Market Volume (Metric Tons) Forecast by Extraction Method, 2020-2035

List of Figures

  • Figure 1: Global Market Volume (Metric Tons) Forecast 2020-2035
  • Figure 2: Global Market Pricing Analysis
  • Figure 3: Global Market Value (USD Million) Forecast 2020-2035
  • Figure 4: Global Market Value Share and BPS Analysis by Form, 2025 and 2035
  • Figure 5: Global Market Y-o-Y Growth Comparison by Form, 2025-2035
  • Figure 6: Global Market Attractiveness Analysis by Form
  • Figure 7: Global Market Value Share and BPS Analysis by Source, 2025 and 2035
  • Figure 8: Global Market Y-o-Y Growth Comparison by Source, 2025-2035
  • Figure 9: Global Market Attractiveness Analysis by Source
  • Figure 10: Global Market Value Share and BPS Analysis by Nature, 2025 and 2035
  • Figure 11: Global Market Y-o-Y Growth Comparison by Nature, 2025-2035
  • Figure 12: Global Market Attractiveness Analysis by Nature
  • Figure 13: Global Market Value Share and BPS Analysis by Species Type, 2025 and 2035
  • Figure 14: Global Market Y-o-Y Growth Comparison by Species Type, 2025-2035
  • Figure 15: Global Market Attractiveness Analysis by Species Type
  • Figure 16: Global Market Value Share and BPS Analysis by Application, 2025 and 2035
  • Figure 17: Global Market Y-o-Y Growth Comparison by Application, 2025-2035
  • Figure 18: Global Market Attractiveness Analysis by Application
  • Figure 19: Global Market Value Share and BPS Analysis by Extraction Method, 2025 and 2035
  • Figure 20: Global Market Y-o-Y Growth Comparison by Extraction Method, 2025-2035
  • Figure 21: Global Market Attractiveness Analysis by Extraction Method
  • Figure 22: Global Market Value (USD Million) Share and BPS Analysis by Region, 2025 and 2035
  • Figure 23: Global Market Y-o-Y Growth Comparison by Region, 2025-2035
  • Figure 24: Global Market Attractiveness Analysis by Region
  • Figure 25: North America Market Incremental $ Opportunity, 2025-2035
  • Figure 26: Latin America Market Incremental $ Opportunity, 2025-2035
  • Figure 27: Western Europe Market Incremental $ Opportunity, 2025-2035
  • Figure 28: Eastern Europe Market Incremental $ Opportunity, 2025-2035
  • Figure 29: East Asia Market Incremental $ Opportunity, 2025-2035
  • Figure 30: South Asia & Pacific Market Incremental $ Opportunity, 2025-2035
  • Figure 31: Middle East and Africa Market Incremental $ Opportunity, 2025-2035
  • Figure 32: North America Market Value Share and BPS Analysis by Country, 2025 and 2035
  • Figure 33: North America Market Value Share and BPS Analysis by Form, 2025 and 2035
  • Figure 34: North America Market Y-o-Y Growth Comparison by Form, 2025-2035
  • Figure 35: North America Market Attractiveness Analysis by Form
  • Figure 36: North America Market Value Share and BPS Analysis by Source, 2025 and 2035
  • Figure 37: North America Market Y-o-Y Growth Comparison by Source, 2025-2035
  • Figure 38: North America Market Attractiveness Analysis by Source
  • Figure 39: North America Market Value Share and BPS Analysis by Nature, 2025 and 2035
  • Figure 40: North America Market Y-o-Y Growth Comparison by Nature, 2025-2035
  • Figure 41: North America Market Attractiveness Analysis by Nature
  • Figure 42: North America Market Value Share and BPS Analysis by Species Type, 2025 and 2035
  • Figure 43: North America Market Y-o-Y Growth Comparison by Species Type, 2025-2035
  • Figure 44: North America Market Attractiveness Analysis by Species Type
  • Figure 45: North America Market Value Share and BPS Analysis by Application, 2025 and 2035
  • Figure 46: North America Market Y-o-Y Growth Comparison by Application, 2025-2035
  • Figure 47: North America Market Attractiveness Analysis by Application
  • Figure 48: North America Market Value Share and BPS Analysis by Extraction Method, 2025 and 2035
  • Figure 49: North America Market Y-o-Y Growth Comparison by Extraction Method, 2025-2035
  • Figure 50: North America Market Attractiveness Analysis by Extraction Method
  • Figure 51: Latin America Market Value Share and BPS Analysis by Country, 2025 and 2035
  • Figure 52: Latin America Market Value Share and BPS Analysis by Form, 2025 and 2035
  • Figure 53: Latin America Market Y-o-Y Growth Comparison by Form, 2025-2035
  • Figure 54: Latin America Market Attractiveness Analysis by Form
  • Figure 55: Latin America Market Value Share and BPS Analysis by Source, 2025 and 2035
  • Figure 56: Latin America Market Y-o-Y Growth Comparison by Source, 2025-2035
  • Figure 57: Latin America Market Attractiveness Analysis by Source
  • Figure 58: Latin America Market Value Share and BPS Analysis by Nature, 2025 and 2035
  • Figure 59: Latin America Market Y-o-Y Growth Comparison by Nature, 2025-2035
  • Figure 60: Latin America Market Attractiveness Analysis by Nature
  • Figure 61: Latin America Market Value Share and BPS Analysis by Species Type, 2025 and 2035
  • Figure 62: Latin America Market Y-o-Y Growth Comparison by Species Type, 2025-2035
  • Figure 63: Latin America Market Attractiveness Analysis by Species Type
  • Figure 64: Latin America Market Value Share and BPS Analysis by Application, 2025 and 2035
  • Figure 65: Latin America Market Y-o-Y Growth Comparison by Application, 2025-2035
  • Figure 66: Latin America Market Attractiveness Analysis by Application
  • Figure 67: Latin America Market Value Share and BPS Analysis by Extraction Method, 2025 and 2035
  • Figure 68: Latin America Market Y-o-Y Growth Comparison by Extraction Method, 2025-2035
  • Figure 69: Latin America Market Attractiveness Analysis by Extraction Method
  • Figure 70: Western Europe Market Value Share and BPS Analysis by Country, 2025 and 2035
  • Figure 71: Western Europe Market Value Share and BPS Analysis by Form, 2025 and 2035
  • Figure 72: Western Europe Market Y-o-Y Growth Comparison by Form, 2025-2035
  • Figure 73: Western Europe Market Attractiveness Analysis by Form
  • Figure 74: Western Europe Market Value Share and BPS Analysis by Source, 2025 and 2035
  • Figure 75: Western Europe Market Y-o-Y Growth Comparison by Source, 2025-2035
  • Figure 76: Western Europe Market Attractiveness Analysis by Source
  • Figure 77: Western Europe Market Value Share and BPS Analysis by Nature, 2025 and 2035
  • Figure 78: Western Europe Market Y-o-Y Growth Comparison by Nature, 2025-2035
  • Figure 79: Western Europe Market Attractiveness Analysis by Nature
  • Figure 80: Western Europe Market Value Share and BPS Analysis by Species Type, 2025 and 2035
  • Figure 81: Western Europe Market Y-o-Y Growth Comparison by Species Type, 2025-2035
  • Figure 82: Western Europe Market Attractiveness Analysis by Species Type
  • Figure 83: Western Europe Market Value Share and BPS Analysis by Application, 2025 and 2035
  • Figure 84: Western Europe Market Y-o-Y Growth Comparison by Application, 2025-2035
  • Figure 85: Western Europe Market Attractiveness Analysis by Application
  • Figure 86: Western Europe Market Value Share and BPS Analysis by Extraction Method, 2025 and 2035
  • Figure 87: Western Europe Market Y-o-Y Growth Comparison by Extraction Method, 2025-2035
  • Figure 88: Western Europe Market Attractiveness Analysis by Extraction Method
  • Figure 89: Eastern Europe Market Value Share and BPS Analysis by Country, 2025 and 2035
  • Figure 90: Eastern Europe Market Value Share and BPS Analysis by Form, 2025 and 2035
  • Figure 91: Eastern Europe Market Y-o-Y Growth Comparison by Form, 2025-2035
  • Figure 92: Eastern Europe Market Attractiveness Analysis by Form
  • Figure 93: Eastern Europe Market Value Share and BPS Analysis by Source, 2025 and 2035
  • Figure 94: Eastern Europe Market Y-o-Y Growth Comparison by Source, 2025-2035
  • Figure 95: Eastern Europe Market Attractiveness Analysis by Source
  • Figure 96: Eastern Europe Market Value Share and BPS Analysis by Nature, 2025 and 2035
  • Figure 97: Eastern Europe Market Y-o-Y Growth Comparison by Nature, 2025-2035
  • Figure 98: Eastern Europe Market Attractiveness Analysis by Nature
  • Figure 99: Eastern Europe Market Value Share and BPS Analysis by Species Type, 2025 and 2035
  • Figure 100: Eastern Europe Market Y-o-Y Growth Comparison by Species Type, 2025-2035
  • Figure 101: Eastern Europe Market Attractiveness Analysis by Species Type
  • Figure 102: Eastern Europe Market Value Share and BPS Analysis by Application, 2025 and 2035
  • Figure 103: Eastern Europe Market Y-o-Y Growth Comparison by Application, 2025-2035
  • Figure 104: Eastern Europe Market Attractiveness Analysis by Application
  • Figure 105: Eastern Europe Market Value Share and BPS Analysis by Extraction Method, 2025 and 2035
  • Figure 106: Eastern Europe Market Y-o-Y Growth Comparison by Extraction Method, 2025-2035
  • Figure 107: Eastern Europe Market Attractiveness Analysis by Extraction Method
  • Figure 108: East Asia Market Value Share and BPS Analysis by Country, 2025 and 2035
  • Figure 109: East Asia Market Value Share and BPS Analysis by Form, 2025 and 2035
  • Figure 110: East Asia Market Y-o-Y Growth Comparison by Form, 2025-2035
  • Figure 111: East Asia Market Attractiveness Analysis by Form
  • Figure 112: East Asia Market Value Share and BPS Analysis by Source, 2025 and 2035
  • Figure 113: East Asia Market Y-o-Y Growth Comparison by Source, 2025-2035
  • Figure 114: East Asia Market Attractiveness Analysis by Source
  • Figure 115: East Asia Market Value Share and BPS Analysis by Nature, 2025 and 2035
  • Figure 116: East Asia Market Y-o-Y Growth Comparison by Nature, 2025-2035
  • Figure 117: East Asia Market Attractiveness Analysis by Nature
  • Figure 118: East Asia Market Value Share and BPS Analysis by Species Type, 2025 and 2035
  • Figure 119: East Asia Market Y-o-Y Growth Comparison by Species Type, 2025-2035
  • Figure 120: East Asia Market Attractiveness Analysis by Species Type
  • Figure 121: East Asia Market Value Share and BPS Analysis by Application, 2025 and 2035
  • Figure 122: East Asia Market Y-o-Y Growth Comparison by Application, 2025-2035
  • Figure 123: East Asia Market Attractiveness Analysis by Application
  • Figure 124: East Asia Market Value Share and BPS Analysis by Extraction Method, 2025 and 2035
  • Figure 125: East Asia Market Y-o-Y Growth Comparison by Extraction Method, 2025-2035
  • Figure 126: East Asia Market Attractiveness Analysis by Extraction Method
  • Figure 127: South Asia & Pacific Market Value Share and BPS Analysis by Country, 2025 and 2035
  • Figure 128: South Asia & Pacific Market Value Share and BPS Analysis by Form, 2025 and 2035
  • Figure 129: South Asia & Pacific Market Y-o-Y Growth Comparison by Form, 2025-2035
  • Figure 130: South Asia & Pacific Market Attractiveness Analysis by Form
  • Figure 131: South Asia & Pacific Market Value Share and BPS Analysis by Source, 2025 and 2035
  • Figure 132: South Asia & Pacific Market Y-o-Y Growth Comparison by Source, 2025-2035
  • Figure 133: South Asia & Pacific Market Attractiveness Analysis by Source
  • Figure 134: South Asia & Pacific Market Value Share and BPS Analysis by Nature, 2025 and 2035
  • Figure 135: South Asia & Pacific Market Y-o-Y Growth Comparison by Nature, 2025-2035
  • Figure 136: South Asia & Pacific Market Attractiveness Analysis by Nature
  • Figure 137: South Asia & Pacific Market Value Share and BPS Analysis by Species Type, 2025 and 2035
  • Figure 138: South Asia & Pacific Market Y-o-Y Growth Comparison by Species Type, 2025-2035
  • Figure 139: South Asia & Pacific Market Attractiveness Analysis by Species Type
  • Figure 140: South Asia & Pacific Market Value Share and BPS Analysis by Application, 2025 and 2035
  • Figure 141: South Asia & Pacific Market Y-o-Y Growth Comparison by Application, 2025-2035
  • Figure 142: South Asia & Pacific Market Attractiveness Analysis by Application
  • Figure 143: South Asia & Pacific Market Value Share and BPS Analysis by Extraction Method, 2025 and 2035
  • Figure 144: South Asia & Pacific Market Y-o-Y Growth Comparison by Extraction Method, 2025-2035
  • Figure 145: South Asia & Pacific Market Attractiveness Analysis by Extraction Method
  • Figure 146: Middle East and Africa Market Value Share and BPS Analysis by Country, 2025 and 2035
  • Figure 147: Middle East and Africa Market Value Share and BPS Analysis by Form, 2025 and 2035
  • Figure 148: Middle East and Africa Market Y-o-Y Growth Comparison by Form, 2025-2035
  • Figure 149: Middle East and Africa Market Attractiveness Analysis by Form
  • Figure 150: Middle East and Africa Market Value Share and BPS Analysis by Source, 2025 and 2035
  • Figure 151: Middle East and Africa Market Y-o-Y Growth Comparison by Source, 2025-2035
  • Figure 152: Middle East and Africa Market Attractiveness Analysis by Source
  • Figure 153: Middle East and Africa Market Value Share and BPS Analysis by Nature, 2025 and 2035
  • Figure 154: Middle East and Africa Market Y-o-Y Growth Comparison by Nature, 2025-2035
  • Figure 155: Middle East and Africa Market Attractiveness Analysis by Nature
  • Figure 156: Middle East and Africa Market Value Share and BPS Analysis by Species Type, 2025 and 2035
  • Figure 157: Middle East and Africa Market Y-o-Y Growth Comparison by Species Type, 2025-2035
  • Figure 158: Middle East and Africa Market Attractiveness Analysis by Species Type
  • Figure 159: Middle East and Africa Market Value Share and BPS Analysis by Application, 2025 and 2035
  • Figure 160: Middle East and Africa Market Y-o-Y Growth Comparison by Application, 2025-2035
  • Figure 161: Middle East and Africa Market Attractiveness Analysis by Application
  • Figure 162: Middle East and Africa Market Value Share and BPS Analysis by Extraction Method, 2025 and 2035
  • Figure 163: Middle East and Africa Market Y-o-Y Growth Comparison by Extraction Method, 2025-2035
  • Figure 164: Middle East and Africa Market Attractiveness Analysis by Extraction Method
  • Figure 165: Global Market - Tier Structure Analysis
  • Figure 166: Global Market - Company Share Analysis

Frequently Asked Questions

How big is the passion fruit extract market in 2025?

The global passion fruit extract market is estimated to be valued at USD 745.4 million in 2025.

What will be the size of passion fruit extract market in 2035?

The passion fruit extract market size is projected to reach USD 1,669.9 million by 2035.

How much will be the passion fruit extract market growth between 2025 and 2035?

The passion fruit extract market is expected to grow at an 8.4% CAGR between 2025 and 2035.

Which form segment is projected to lead in the passion fruit extract market in 2025?

The powder form segment is projected to lead in the passion fruit extract market with 59% market share in 2025.

Which source segment is expected to contribute significant share in the passion fruit extract market in 2025?

The pulp source segment is expected to command 53% share in the passion fruit extract market in 2025.

Explore Similar Insights

Future Market Insights

Passion Fruit Extract Market