Passive and Interconnecting Electronic Components Market Size and Share Forecast Outlook 2025 to 2035

The passive and interconnecting electronic components market is expected to grow from USD 192.6 billion in 2025 to USD 375.4 billion by 2035, registering a 6.9% CAGR and generating an absolute dollar opportunity of USD 182.8 billion. Growth is driven by increasing demand for electronic devices, industrial automation, automotive electronics, and telecommunication systems. Advancements in miniaturization, reliability, and performance of components such as resistors, capacitors, connectors, and inductors further support adoption across global markets.

Market growth curve shape analysis provides insight into the trajectory of expansion over the forecast period. From 2025 to 2028, the curve rises steadily, reflecting early-stage adoption in North America, Europe, and East Asia, where industrial electronics, telecommunications infrastructure, and consumer electronics demand create incremental growth. Between 2029 and 2032, the curve steepens, indicating accelerated growth as Asia Pacific and Latin America expand manufacturing capacities, urban infrastructure, and automotive electronics production, driving higher demand for interconnecting components. From 2033 to 2035, the curve begins to moderate as mature markets reach higher penetration levels, with incremental revenue increasingly coming from replacements, upgrades, and advanced technology adoption rather than new installations.

The USD 182.8 billion opportunity reflects early gradual uptake, mid-period acceleration, and late-stage stabilization, illustrating the predictable and sustained growth trajectory of the global passive and interconnecting electronic components market between 2025 and 2035.
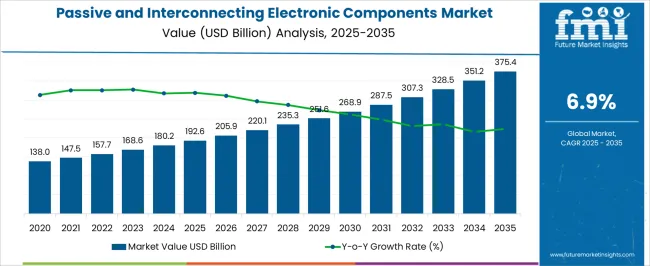
Quick Stats for Passive and Interconnecting Electronic Components Market

  • Passive and Interconnecting Electronic Components Market Value (2025): USD 192.6 billion
  • Passive and Interconnecting Electronic Components Market Forecast Value (2035): USD 375.4 billion
  • Passive and Interconnecting Electronic Components Market Forecast CAGR: 6.9%
  • Leading Segment in Passive and Interconnecting Electronic Components Market in 2025: Passive (38.6%)
  • Key Growth Regions in Passive and Interconnecting Electronic Components Market: North America, Asia-Pacific, Europe
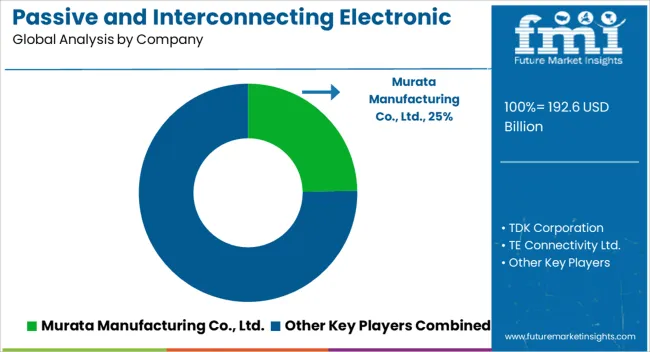
  • Top Key Players in Passive and Interconnecting Electronic Components Market: Murata Manufacturing Co., Ltd., TDK Corporation, TE Connectivity Ltd., AVX Corporation, Amphenol Corporation

Passive And Interconnecting Electronic Components Market Market Value Analysis

Passive and Interconnecting Electronic Components Market Key Takeaways

Metric Value
Passive and Interconnecting Electronic Components Market Estimated Value in (2025 E) USD 192.6 billion
Passive and Interconnecting Electronic Components Market Forecast Value in (2035 F) USD 375.4 billion
Forecast CAGR (2025 to 2035) 6.9%

The passive and interconnecting electronic components market is primarily driven by the consumer electronics sector, which accounts for around 42% of the market share, as devices such as smartphones, laptops, wearables, and home appliances rely on capacitors, resistors, connectors, and inductors for core functionality. The industrial automation and manufacturing segment contributes about 26%, using electronic components in robotics, control systems, and precision instrumentation. The automotive and transportation sector represents close to 16%, integrating components in electric vehicles, infotainment systems, and safety electronics. Telecommunications and networking account for roughly 10%, deploying components in routers, switches, and 5G infrastructure.

The remaining 6% comes from aerospace, defense, and medical electronics, where reliability and high-performance interconnections are critical. The passive and interconnecting electronic components market is evolving with innovations in miniaturization, high-frequency performance, and enhanced reliability. Ultra-compact capacitors, high-precision resistors, and advanced connectors are being developed to support smaller, lighter, and faster electronic devices. High-temperature and corrosion-resistant materials are gaining adoption for automotive, aerospace, and industrial applications. Advanced PCB design and surface-mount technology are improving assembly efficiency and signal integrity. Manufacturers are investing in automated production, quality assurance, and supply chain optimization to enhance their operations. Strategic collaborations with OEMs, telecom providers, and industrial equipment manufacturers are expanding deployment. Rising demand for IoT, 5G, electric vehicles, and smart devices continues to drive global market growth.

Why is the Passive and Interconnecting Electronic Components Market Growing?

The passive and interconnecting electronic components market is experiencing consistent growth fueled by advancements in consumer technology, increasing device miniaturization, and rising integration of smart electronics across sectors. Demand has surged for compact and energy efficient components that can meet the performance requirements of rapidly evolving applications such as smartphones, wearables, automotive electronics, and industrial automation.

Technological innovation in material science and circuit design has enabled better component reliability, thermal stability, and operational efficiency. Regulatory focus on energy consumption and durability in electronics is further accelerating the adoption of advanced passive and interconnect solutions.

The outlook for the market remains positive as manufacturers increasingly rely on high performance passive and interconnecting components to support the next generation of connected and intelligent devices.

Segmental Analysis

The passive and interconnecting electronic components market is segmented by type, application, and geographic regions. By type, passive and interconnecting electronic components market is divided into Passive and Interconnecting. In terms of application, passive and interconnecting electronic components market is classified into Consumer electronics, Automotive, Healthcare, IT & telecom, Telecom equipment, Networking devices, Industrial, Automation & robotics, Power generation, Industrial control systems, Others, Aerospace & defense, Military communications, Weaponry systems, Aircraft safety systems, Others, and Others. Regionally, the passive and interconnecting electronic components industry is classified into North America, Latin America, Western Europe, Eastern Europe, Balkan & Baltic Countries, Russia & Belarus, Central Asia, East Asia, South Asia & Pacific, and the Middle East & Africa.
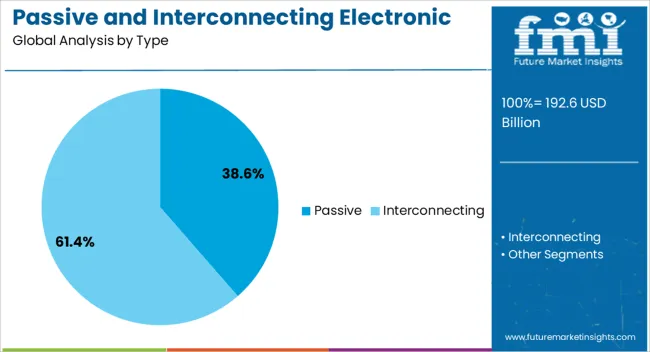
Insights into the Passive Type Segment

Passive And Interconnecting Electronic Components Market Analysis By Type

The passive segment is projected to contribute 38.60 % of the total market revenue by 2025 within the type category, making it the leading segment. This share is supported by the essential role that passive components such as resistors, capacitors, and inductors play in every electronic circuit.

These components are valued for their durability, compactness, and ability to maintain signal integrity and circuit stability. Increased demand for surface mount technology and multilayer designs has led to greater consumption of passive components in compact electronic assemblies.

As devices become more complex and power efficient, the need for stable and thermally resilient passive components continues to grow. The wide applicability across both high volume consumer goods and precision industrial systems has solidified the passive segment’s leadership in the market.

What are the Drivers, Restraints, and Key Trends of the Passive and Interconnecting Electronic Components Market?

The passive and interconnecting electronic components market is expanding due to increasing electronics manufacturing, 5G deployment, and automotive electrification. Asia Pacific leads with USD 42 billion in 2024, driven by China (USD 25 billion), Japan (USD 10 billion), and South Korea (USD 7 billion). Europe accounts for USD 28 billion, led by Germany (USD 12 billion), France (USD 8 billion), and UK (USD 8 billion). North America holds USD 26 billion, primarily the USA, while the rest of the world represents USD 6 billion. Key components include resistors (30%), capacitors (25%), inductors (15%), connectors (20%), and passive interconnects (10%), deployed across consumer electronics, automotive, and industrial applications.

Primary Growth Drivers for Electronic Components

Market growth is driven by rising demand for miniaturized and high-performance electronic devices. Resistors account for 30% of adoption, capacitors 25%, inductors 15%, connectors 20%, and passive interconnects 10%. Asia Pacific leads with USD 42 billion, Europe USD 28 billion, and North America USD 26 billion. Increasing production of smartphones (1.5 billion units annually), tablets (400 million units), and automotive electronics (over 100 million EVs and hybrid vehicles by 2024) supports demand. Adoption of 5G infrastructure, industrial automation, and IoT devices further drives need for reliable, high-quality passive and interconnecting components to ensure performance and connectivity across applications.

Current Technological Trends in Passive Components

Key trends include miniaturization, high-frequency connectors, and multi-layer capacitors. Approximately 30% of new devices incorporate ultra-compact resistors and capacitors, reducing PCB space by 20–25%. High-speed connectors supporting frequencies up to 50 GHz are increasingly used in 15% of telecom and data center applications. Multi-layer ceramic capacitors (MLCCs) dominate automotive and consumer electronics applications, representing USD 8–10 billion in 2024. Automated soldering and assembly processes enhance reliability, adopted in 25% of industrial manufacturing. Growth in high-power electronics and EV battery management systems is driving adoption of temperature-resistant and high-current passive components globally.

Opportunities Across Consumer, Automotive, and Industrial Sectors

Opportunities exist in consumer electronics, automotive, industrial automation, telecom infrastructure, and data centers. Resistors account for 30% of adoption, capacitors 25%, inductors 15%, connectors 20%, and passive interconnects 10%. Asia Pacific is projected to reach USD 52 billion by 2027, Europe USD 33 billion, and North America USD 30 billion. Expansion of electric vehicles, smart home devices, wearable electronics, and 5G networks creates significant market potential. Growth in industrial robotics and automated factories further drives demand for high-reliability interconnecting components. Collaborations between component manufacturers and OEMs can accelerate deployment and reduce production lead times for high-volume applications.

Challenges Limiting Passive and Interconnecting Component Market

High raw material costs, supply chain constraints, and miniaturization complexity limit market growth. MLCCs and high-frequency connectors cost USD 0.10–5 per unit depending on specifications, while inductors and resistors range from USD 0.05–1 per unit. Scarcity of high-purity ceramics and copper affects production timelines by 4–6 weeks. Integration into compact PCBs requires precision manufacturing, increasing assembly costs by 15–20%. Compliance with international standards for automotive, telecom, and industrial applications adds USD 50–150 per thousand units. Rapid technological evolution demands continuous R&D investment, approximately USD 200–300 million annually for leading manufacturers, to maintain performance and reliability standards.
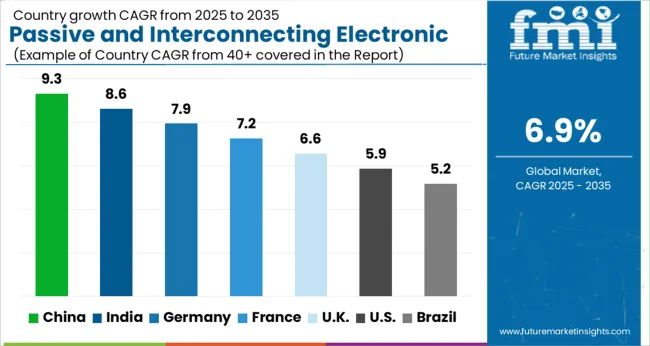
Analysis of Passive and Interconnecting Electronic Components Market By Key Countries

Passive And Interconnecting Electronic Components Market Cagr Analysis By Country

Country CAGR
China 9.3%
India 8.6%
Germany 7.9%
France 7.2%
UK 6.6%
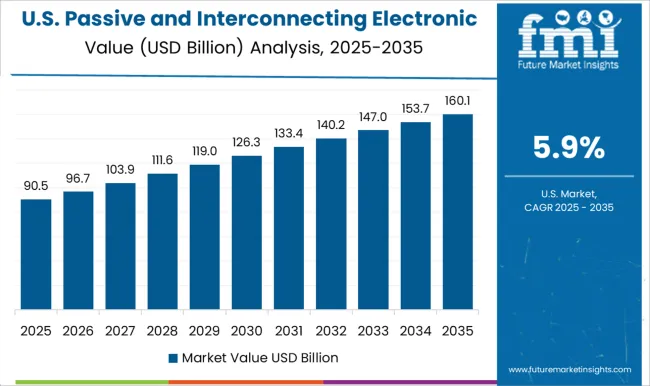
USA 5.9%
Brazil 5.2%

The passive and interconnecting electronic components market is projected to grow at a global CAGR of 6.9% through 2035, fueled by increasing demand for electronic devices, industrial automation, and telecommunication systems. China leads at 9.3%, a 1.35× multiple over the global benchmark, supported by BRICS-driven expansion in electronics manufacturing, IoT adoption, and industrial automation. India follows at 8.6%, a 1.25× multiple of the global rate, reflecting growth in consumer electronics, telecommunication networks, and electronic assembly industries. Germany records 7.9%, a 1.15× multiple of the benchmark, shaped by OECD-backed innovation in high-performance components, precision electronics, and automotive applications. The United Kingdom posts 6.6%, 0.96× the global rate, with adoption focused on industrial automation, commercial electronics, and niche telecommunication applications. The United States stands at 5.9%, 0.85× the benchmark, with steady uptake in consumer electronics, industrial electronics, and communication systems. BRICS economies drive the majority of market volume, OECD countries emphasize technological advancement and precision, while ASEAN nations contribute through growing electronics manufacturing and industrial automation.

Demand Forecast for Passive and Interconnecting Electronic Components Market in China

The passive and interconnecting electronic components market in China is projected to grow at a CAGR of 9.3%, driven by increasing electronics manufacturing, automotive electronics, and industrial automation adoption. Domestic suppliers such as Murata, Yageo, and Samsung Electro-Mechanics provide capacitors, resistors, inductors, and connectors with high reliability and performance. Technological developments focus on miniaturization, higher efficiency, and improved signal integrity. Demand is concentrated in consumer electronics, automotive, and industrial automation applications.

  • China shipped over 4.8 billion passive and interconnecting components in 2024 with consumer electronics representing 55%
  • Automotive electronics adoption increased by 25% year on year
  • Industrial automation applications contributed to 30% of total shipments

Analysis of Passive and Interconnecting Electronic Components Market in India

The market in India is expected to grow at a CAGR of 8.6%, supported by expanding electronics manufacturing, automotive production, and industrial equipment sectors. Key suppliers such as EPCOS India and Vishay provide capacitors, resistors, and connectors with high performance, reliability, and energy efficiency. Technological improvements focus on compact designs, enhanced thermal performance, and integration into smart devices. Adoption is concentrated in consumer electronics, automotive, and industrial automation sectors.
  • India shipped approximately 2.1 billion passive and interconnecting components in 2024 with consumer electronics representing 50%
  • Automotive electronics adoption grew by 22% year on year
  • Industrial automation contributed to 28% of total shipments

Growth Analysis of Passive and Interconnecting Electronic Components Market in Germany

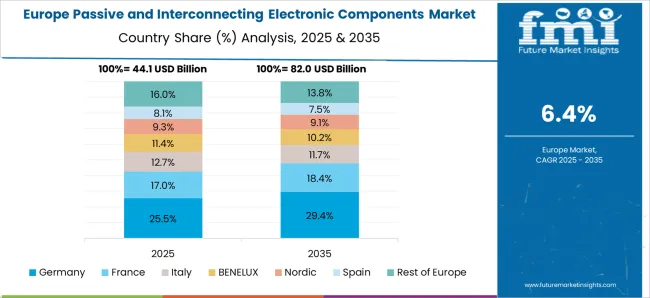
Passive And Interconnecting Electronic Components Market Europe Country Market Share Analysis, 2025 & 2035

Germany’s market is projected to grow at a CAGR of 7.9%, influenced by industrial automation, automotive electronics, and consumer electronics production. Suppliers such as Wurth Elektronik and TDK provide high-reliability capacitors, resistors, and connectors for industrial, automotive, and consumer applications. Technological focus includes miniaturization, energy efficiency, and enhanced signal integrity. Demand is concentrated in automotive electronics, industrial automation, and high-performance consumer devices.

  • Germany shipped over 950 million passive and interconnecting components in 2024 with automotive electronics representing 52%
  • Industrial automation adoption increased by 18% year on year
  • Consumer electronics applications contributed to 30% of total shipments

Future Outlook for Passive and Interconnecting Electronic Components Market in the United Kingdom

The United Kingdom market is expected to grow at a CAGR of 6.6%, driven by demand from consumer electronics, automotive electronics, and industrial automation. Suppliers focus on capacitors, resistors, and connectors with high reliability, energy efficiency, and compact designs. Technological developments emphasize integration with smart devices, enhanced thermal performance, and signal integrity. Adoption is concentrated in automotive, industrial, and consumer electronics sectors.
  • United Kingdom shipped approximately 480 million passive and interconnecting components in 2024 with consumer electronics representing 45%
  • Automotive electronics adoption grew by 15% year on year
  • Industrial automation contributed to 30% of total shipments

Passive and Interconnecting Electronic Components Market Outlook in the United States

Passive And Interconnecting Electronic Components Market Country Value Analysis

The United States market is projected to grow at a CAGR of 5.9%, supported by consumer electronics, automotive electronics, and industrial automation sectors. Key suppliers such as Vishay, TE Connectivity, and Murata provide capacitors, resistors, inductors, and connectors with high performance, reliability, and energy efficiency. Technological improvements focus on miniaturization, thermal stability, and signal integrity. Adoption is concentrated in automotive electronics, industrial automation, and consumer devices.
  • United States shipped over 1.2 billion passive and interconnecting components in 2024 with automotive electronics representing 50%
  • Industrial automation adoption increased by 16% year on year
  • Consumer electronics contributed to 30% of total shipments

Competitive Landscape of Passive and Interconnecting Electronic Components Market

Passive And Interconnecting Electronic Components Market Analysis By Company

Competition in the passive and interconnecting electronic components market is being shaped by component reliability, miniaturization, and electrical performance for consumer electronics, industrial systems, automotive, and telecommunications applications. Market positions are being reinforced through advanced materials, precision manufacturing, and global distribution networks that ensure consistent capacitance, resistance, inductance, and connectivity performance. Murata Manufacturing Co., Ltd. and TDK Corporation are being represented with capacitors, inductors, and resistors engineered for high stability, low losses, and broad frequency applications. TE Connectivity Ltd. and AVX Corporation are being promoted with connectors, terminals, and interconnect solutions structured for secure electrical pathways, vibration resistance, and thermal tolerance. Amphenol Corporation is being applied with interconnecting systems optimized for high-density applications, automotive electronics, and industrial control systems, ensuring reliable signal and power transfer. Components are being integrated into printed circuit boards, communication modules, and control units to enhance system performance and durability. Strategies in the market are being centered on product miniaturization, high-performance specifications, and compatibility with emerging electronics trends. Research and development are being allocated to improve electrical stability, thermal resistance, signal integrity, and environmental durability. Product brochures are being structured with specifications covering capacitance, resistance, inductance, voltage rating, connector type, and mechanical tolerance. Features such as compact design, high reliability, wide operating range, and low insertion loss are being emphasized to guide procurement and system design. Each brochure is being arranged to present technical performance, compliance standards, and handling guidelines. Information is being provided in a clear, evaluation-ready format to assist electronics manufacturers, integrators, and procurement teams in selecting passive and interconnecting components that meet performance, reliability, and operational requirements.


Key Players in the Passive and Interconnecting Electronic Components Market

  • Murata Manufacturing Co., Ltd.
  • TDK Corporation
  • TE Connectivity Ltd.
  • AVX Corporation
  • Amphenol Corporation

Scope of the Report

Item Value
Quantitative Units USD 192.6 Billion
Type Passive and Interconnecting
Application Consumer electronics, Automotive, Healthcare, IT & telecom, Telecom equipment, Networking devices, Industrial, Automation & robotics, Power generation, Industrial control systems, Others, Aerospace & defense, Military communications, Weaponry systems, Aircraft safety systems, Others, and Others
Regions Covered North America, Europe, Asia-Pacific, Latin America, Middle East & Africa
Country Covered United States, Canada, Germany, France, United Kingdom, China, Japan, India, Brazil, South Africa
Key Companies Profiled Murata Manufacturing Co., Ltd., TDK Corporation, TE Connectivity Ltd., AVX Corporation, and Amphenol Corporation
Additional Attributes Dollar sales by component type and end use, demand dynamics across consumer electronics, automotive, and industrial sectors, regional trends in electronics manufacturing, innovation in miniaturization, reliability, and connectivity, environmental impact of electronic waste, and emerging use cases in IoT devices, wearables, and smart infrastructure.

Passive and Interconnecting Electronic Components Market by Segments

Type:

  • Passive
  • Interconnecting

Application:

  • Consumer electronics
  • Automotive
  • Healthcare
  • IT & telecom
  • Telecom equipment
  • Networking devices
  • Industrial
  • Automation & robotics
  • Power generation
  • Industrial control systems
  • Others
  • Aerospace & defense
  • Military communications
  • Weaponry systems
  • Aircraft safety systems
  • Others
  • Others

Region:

  • North America
    • USA
    • Canada
    • Mexico
  • Latin America
    • Brazil
    • Chile
    • Rest of Latin America
  • Western Europe
    • Germany
    • UK
    • Italy
    • Spain
    • France
    • Nordic
    • BENELUX
    • Rest of Western Europe
  • Eastern Europe
    • Russia
    • Poland
    • Hungary
    • Balkan & Baltic
    • Rest of Eastern Europe
  • East Asia
    • China
    • Japan
    • South Korea
  • South Asia and Pacific
    • India
    • ASEAN
    • Australia & New Zealand
    • Rest of South Asia and Pacific
  • Middle East & Africa
    • Kingdom of Saudi Arabia
    • Other GCC Countries
    • Turkiye
    • South Africa
    • Other African Union
    • Rest of Middle East & Africa

Table of Content

  1. Executive Summary
    • Global Market Outlook
    • Demand-side Trends
    • Supply-side Trends
    • Technology Roadmap Analysis
    • Analysis and Recommendations
  2. Market Overview
    • Market Coverage / Taxonomy
    • Market Definition / Scope / Limitations
  3. Market Background
    • Market Dynamics
      • Drivers
      • Restraints
      • Opportunity
      • Trends
    • Scenario Forecast
      • Demand in Optimistic Scenario
      • Demand in Likely Scenario
      • Demand in Conservative Scenario
    • Opportunity Map Analysis
    • Product Life Cycle Analysis
    • Supply Chain Analysis
    • Investment Feasibility Matrix
    • Value Chain Analysis
    • PESTLE and Porter’s Analysis
    • Regulatory Landscape
    • Regional Parent Market Outlook
    • Production and Consumption Statistics
    • Import and Export Statistics
  4. Global Passive and Interconnecting Electronic Components Market Analysis 2020-2024 and Forecast, 2025-2035
    • Historical Market Size Value (USD Mn) Analysis, 2020-2024
    • Current and Future Market Size Value (USD Mn) Projections, 2025-2035
      • Y-o-Y Growth Trend Analysis
      • Absolute $ Opportunity Analysis
  5. Global Passive and Interconnecting Electronic Components Market Pricing Analysis 2020-2024 and Forecast 2025-2035
  6. Global Passive and Interconnecting Electronic Components Market Analysis 2020-2024 and Forecast 2025-2035, By Type
    • Introduction / Key Findings
    • Historical Market Size Value (USD Mn) Analysis By Type , 2020-2024
    • Current and Future Market Size Value (USD Mn) Analysis and Forecast By Type , 2025-2035
      • Passive
        • Resistors
        • Capacitors
        • Inductors
        • Transformers
        • Others
      • Interconnecting
        • PCB
        • Connectors
        • Switches & relays
        • Others
    • Y-o-Y Growth Trend Analysis By Type , 2020-2024
    • Absolute $ Opportunity Analysis By Type , 2025-2035
  7. Global Passive and Interconnecting Electronic Components Market Analysis 2020-2024 and Forecast 2025-2035, By Application
    • Introduction / Key Findings
    • Historical Market Size Value (USD Mn) Analysis By Application, 2020-2024
    • Current and Future Market Size Value (USD Mn) Analysis and Forecast By Application, 2025-2035
      • Consumer electronics
        • Smartphones & tablets
        • Laptops & desktops
        • Televisions & home appliances
        • Others
      • Automotive
        • In-vehicle infotainment
        • Safety & security systems
        • Driver assistance systems
        • Engine control systems
        • Others
      • Healthcare
        • Imaging systems
        • Patient monitoring systems
        • Therapeutic equipment
        • Others
      • IT & telecom
      • Telecom equipment
      • Networking devices
      • Industrial
      • Automation & robotics
      • Power generation
      • Industrial control systems
      • Others
    • Y-o-Y Growth Trend Analysis By Application, 2020-2024
    • Absolute $ Opportunity Analysis By Application, 2025-2035
  8. Global Passive and Interconnecting Electronic Components Market Analysis 2020-2024 and Forecast 2025-2035, By Region
    • Introduction
    • Historical Market Size Value (USD Mn) Analysis By Region, 2020-2024
    • Current Market Size Value (USD Mn) Analysis and Forecast By Region, 2025-2035
      • North America
      • Latin America
      • Western Europe
      • Eastern Europe
      • East Asia
      • South Asia and Pacific
      • Middle East & Africa
    • Market Attractiveness Analysis By Region
  9. North America Passive and Interconnecting Electronic Components Market Analysis 2020-2024 and Forecast 2025-2035, By Country
    • Historical Market Size Value (USD Mn) Trend Analysis By Market Taxonomy, 2020-2024
    • Market Size Value (USD Mn) Forecast By Market Taxonomy, 2025-2035
      • By Country
        • USA
        • Canada
        • Mexico
      • By Type
      • By Application
    • Market Attractiveness Analysis
      • By Country
      • By Type
      • By Application
    • Key Takeaways
  10. Latin America Passive and Interconnecting Electronic Components Market Analysis 2020-2024 and Forecast 2025-2035, By Country
    • Historical Market Size Value (USD Mn) Trend Analysis By Market Taxonomy, 2020-2024
    • Market Size Value (USD Mn) Forecast By Market Taxonomy, 2025-2035
      • By Country
        • Brazil
        • Chile
        • Rest of Latin America
      • By Type
      • By Application
    • Market Attractiveness Analysis
      • By Country
      • By Type
      • By Application
    • Key Takeaways
  11. Western Europe Passive and Interconnecting Electronic Components Market Analysis 2020-2024 and Forecast 2025-2035, By Country
    • Historical Market Size Value (USD Mn) Trend Analysis By Market Taxonomy, 2020-2024
    • Market Size Value (USD Mn) Forecast By Market Taxonomy, 2025-2035
      • By Country
        • Germany
        • UK
        • Italy
        • Spain
        • France
        • Nordic
        • BENELUX
        • Rest of Western Europe
      • By Type
      • By Application
    • Market Attractiveness Analysis
      • By Country
      • By Type
      • By Application
    • Key Takeaways
  12. Eastern Europe Passive and Interconnecting Electronic Components Market Analysis 2020-2024 and Forecast 2025-2035, By Country
    • Historical Market Size Value (USD Mn) Trend Analysis By Market Taxonomy, 2020-2024
    • Market Size Value (USD Mn) Forecast By Market Taxonomy, 2025-2035
      • By Country
        • Russia
        • Poland
        • Hungary
        • Balkan & Baltic
        • Rest of Eastern Europe
      • By Type
      • By Application
    • Market Attractiveness Analysis
      • By Country
      • By Type
      • By Application
    • Key Takeaways
  13. East Asia Passive and Interconnecting Electronic Components Market Analysis 2020-2024 and Forecast 2025-2035, By Country
    • Historical Market Size Value (USD Mn) Trend Analysis By Market Taxonomy, 2020-2024
    • Market Size Value (USD Mn) Forecast By Market Taxonomy, 2025-2035
      • By Country
        • China
        • Japan
        • South Korea
      • By Type
      • By Application
    • Market Attractiveness Analysis
      • By Country
      • By Type
      • By Application
    • Key Takeaways
  14. South Asia and Pacific Passive and Interconnecting Electronic Components Market Analysis 2020-2024 and Forecast 2025-2035, By Country
    • Historical Market Size Value (USD Mn) Trend Analysis By Market Taxonomy, 2020-2024
    • Market Size Value (USD Mn) Forecast By Market Taxonomy, 2025-2035
      • By Country
        • India
        • ASEAN
        • Australia & New Zealand
        • Rest of South Asia and Pacific
      • By Type
      • By Application
    • Market Attractiveness Analysis
      • By Country
      • By Type
      • By Application
    • Key Takeaways
  15. Middle East & Africa Passive and Interconnecting Electronic Components Market Analysis 2020-2024 and Forecast 2025-2035, By Country
    • Historical Market Size Value (USD Mn) Trend Analysis By Market Taxonomy, 2020-2024
    • Market Size Value (USD Mn) Forecast By Market Taxonomy, 2025-2035
      • By Country
        • Kingdom of Saudi Arabia
        • Other GCC Countries
        • Turkiye
        • South Africa
        • Other African Union
        • Rest of Middle East & Africa
      • By Type
      • By Application
    • Market Attractiveness Analysis
      • By Country
      • By Type
      • By Application
    • Key Takeaways
  16. Key Countries Passive and Interconnecting Electronic Components Market Analysis
    • USA
      • Pricing Analysis
      • Market Share Analysis, 2024
        • By Type
        • By Application
    • Canada
      • Pricing Analysis
      • Market Share Analysis, 2024
        • By Type
        • By Application
    • Mexico
      • Pricing Analysis
      • Market Share Analysis, 2024
        • By Type
        • By Application
    • Brazil
      • Pricing Analysis
      • Market Share Analysis, 2024
        • By Type
        • By Application
    • Chile
      • Pricing Analysis
      • Market Share Analysis, 2024
        • By Type
        • By Application
    • Germany
      • Pricing Analysis
      • Market Share Analysis, 2024
        • By Type
        • By Application
    • UK
      • Pricing Analysis
      • Market Share Analysis, 2024
        • By Type
        • By Application
    • Italy
      • Pricing Analysis
      • Market Share Analysis, 2024
        • By Type
        • By Application
    • Spain
      • Pricing Analysis
      • Market Share Analysis, 2024
        • By Type
        • By Application
    • France
      • Pricing Analysis
      • Market Share Analysis, 2024
        • By Type
        • By Application
    • India
      • Pricing Analysis
      • Market Share Analysis, 2024
        • By Type
        • By Application
    • ASEAN
      • Pricing Analysis
      • Market Share Analysis, 2024
        • By Type
        • By Application
    • Australia & New Zealand
      • Pricing Analysis
      • Market Share Analysis, 2024
        • By Type
        • By Application
    • China
      • Pricing Analysis
      • Market Share Analysis, 2024
        • By Type
        • By Application
    • Japan
      • Pricing Analysis
      • Market Share Analysis, 2024
        • By Type
        • By Application
    • South Korea
      • Pricing Analysis
      • Market Share Analysis, 2024
        • By Type
        • By Application
    • Russia
      • Pricing Analysis
      • Market Share Analysis, 2024
        • By Type
        • By Application
    • Poland
      • Pricing Analysis
      • Market Share Analysis, 2024
        • By Type
        • By Application
    • Hungary
      • Pricing Analysis
      • Market Share Analysis, 2024
        • By Type
        • By Application
    • Kingdom of Saudi Arabia
      • Pricing Analysis
      • Market Share Analysis, 2024
        • By Type
        • By Application
    • Turkiye
      • Pricing Analysis
      • Market Share Analysis, 2024
        • By Type
        • By Application
    • South Africa
      • Pricing Analysis
      • Market Share Analysis, 2024
        • By Type
        • By Application
  17. Market Structure Analysis
    • Competition Dashboard
    • Competition Benchmarking
    • Market Share Analysis of Top Players
      • By Regional
      • By Type
      • By Application
  18. Competition Analysis
    • Competition Deep Dive
      • Murata Manufacturing Co., Ltd.
        • Overview
        • Product Portfolio
        • Profitability by Market Segments (Product/Age /Sales Channel/Region)
        • Sales Footprint
        • Strategy Overview
          • Marketing Strategy
          • Product Strategy
          • Channel Strategy
      • TDK Corporation
      • TE Connectivity Ltd.
      • AVX Corporation
      • Amphenol Corporation
  19. Assumptions & Acronyms Used
  20. Research Methodology

List of Tables

  • Table 1: Global Passive and Interconnecting Electronic Components Market Value (USD Mn) Forecast by Region, 2020-2035
  • Table 2: Global Passive and Interconnecting Electronic Components Market Value (USD Mn) Forecast by Type , 2020-2035
  • Table 3: Global Passive and Interconnecting Electronic Components Market Value (USD Mn) Forecast by Application, 2020-2035
  • Table 4: North America Passive and Interconnecting Electronic Components Market Value (USD Mn) Forecast by Country, 2020-2035
  • Table 5: North America Passive and Interconnecting Electronic Components Market Value (USD Mn) Forecast by Type , 2020-2035
  • Table 6: North America Passive and Interconnecting Electronic Components Market Value (USD Mn) Forecast by Application, 2020-2035
  • Table 7: Latin America Passive and Interconnecting Electronic Components Market Value (USD Mn) Forecast by Country, 2020-2035
  • Table 8: Latin America Passive and Interconnecting Electronic Components Market Value (USD Mn) Forecast by Type , 2020-2035
  • Table 9: Latin America Passive and Interconnecting Electronic Components Market Value (USD Mn) Forecast by Application, 2020-2035
  • Table 10: Western Europe Passive and Interconnecting Electronic Components Market Value (USD Mn) Forecast by Country, 2020-2035
  • Table 11: Western Europe Passive and Interconnecting Electronic Components Market Value (USD Mn) Forecast by Type , 2020-2035
  • Table 12: Western Europe Passive and Interconnecting Electronic Components Market Value (USD Mn) Forecast by Application, 2020-2035
  • Table 13: Eastern Europe Passive and Interconnecting Electronic Components Market Value (USD Mn) Forecast by Country, 2020-2035
  • Table 14: Eastern Europe Passive and Interconnecting Electronic Components Market Value (USD Mn) Forecast by Type , 2020-2035
  • Table 15: Eastern Europe Passive and Interconnecting Electronic Components Market Value (USD Mn) Forecast by Application, 2020-2035
  • Table 16: East Asia Passive and Interconnecting Electronic Components Market Value (USD Mn) Forecast by Country, 2020-2035
  • Table 17: East Asia Passive and Interconnecting Electronic Components Market Value (USD Mn) Forecast by Type , 2020-2035
  • Table 18: East Asia Passive and Interconnecting Electronic Components Market Value (USD Mn) Forecast by Application, 2020-2035
  • Table 19: South Asia and Pacific Passive and Interconnecting Electronic Components Market Value (USD Mn) Forecast by Country, 2020-2035
  • Table 20: South Asia and Pacific Passive and Interconnecting Electronic Components Market Value (USD Mn) Forecast by Type , 2020-2035
  • Table 21: South Asia and Pacific Passive and Interconnecting Electronic Components Market Value (USD Mn) Forecast by Application, 2020-2035
  • Table 22: Middle East & Africa Passive and Interconnecting Electronic Components Market Value (USD Mn) Forecast by Country, 2020-2035
  • Table 23: Middle East & Africa Passive and Interconnecting Electronic Components Market Value (USD Mn) Forecast by Type , 2020-2035
  • Table 24: Middle East & Africa Passive and Interconnecting Electronic Components Market Value (USD Mn) Forecast by Application, 2020-2035

List of Figures

  • Figure 1: Global Passive and Interconnecting Electronic Components Market Pricing Analysis
  • Figure 2: Global Passive and Interconnecting Electronic Components Market Value (USD Mn) Forecast 2020–2035
  • Figure 3: Global Passive and Interconnecting Electronic Components Market Value Share and BPS Analysis by Type , 2025 and 2035
  • Figure 4: Global Passive and Interconnecting Electronic Components Market Y-o-Y Growth Comparison by Type , 2025–2035
  • Figure 5: Global Passive and Interconnecting Electronic Components Market Attractiveness Analysis by Type
  • Figure 6: Global Passive and Interconnecting Electronic Components Market Value Share and BPS Analysis by Application, 2025 and 2035
  • Figure 7: Global Passive and Interconnecting Electronic Components Market Y-o-Y Growth Comparison by Application, 2025–2035
  • Figure 8: Global Passive and Interconnecting Electronic Components Market Attractiveness Analysis by Application
  • Figure 9: Global Passive and Interconnecting Electronic Components Market Value (USD Mn) Share and BPS Analysis by Region, 2025 and 2035
  • Figure 10: Global Passive and Interconnecting Electronic Components Market Y-o-Y Growth Comparison by Region, 2025–2035
  • Figure 11: Global Passive and Interconnecting Electronic Components Market Attractiveness Analysis by Region
  • Figure 12: North America Passive and Interconnecting Electronic Components Market Incremental Dollar Opportunity, 2025–2035
  • Figure 13: Latin America Passive and Interconnecting Electronic Components Market Incremental Dollar Opportunity, 2025–2035
  • Figure 14: Western Europe Passive and Interconnecting Electronic Components Market Incremental Dollar Opportunity, 2025–2035
  • Figure 15: Eastern Europe Passive and Interconnecting Electronic Components Market Incremental Dollar Opportunity, 2025–2035
  • Figure 16: East Asia Passive and Interconnecting Electronic Components Market Incremental Dollar Opportunity, 2025–2035
  • Figure 17: South Asia and Pacific Passive and Interconnecting Electronic Components Market Incremental Dollar Opportunity, 2025–2035
  • Figure 18: Middle East & Africa Passive and Interconnecting Electronic Components Market Incremental Dollar Opportunity, 2025–2035
  • Figure 19: North America Passive and Interconnecting Electronic Components Market Value Share and BPS Analysis by Country, 2025 and 2035
  • Figure 20: North America Passive and Interconnecting Electronic Components Market Value Share and BPS Analysis by Type , 2025 and 2035
  • Figure 21: North America Passive and Interconnecting Electronic Components Market Y-o-Y Growth Comparison by Type , 2025–2035
  • Figure 22: North America Passive and Interconnecting Electronic Components Market Attractiveness Analysis by Type
  • Figure 23: North America Passive and Interconnecting Electronic Components Market Value Share and BPS Analysis by Application, 2025 and 2035
  • Figure 24: North America Passive and Interconnecting Electronic Components Market Y-o-Y Growth Comparison by Application, 2025–2035
  • Figure 25: North America Passive and Interconnecting Electronic Components Market Attractiveness Analysis by Application
  • Figure 26: Latin America Passive and Interconnecting Electronic Components Market Value Share and BPS Analysis by Country, 2025 and 2035
  • Figure 27: Latin America Passive and Interconnecting Electronic Components Market Value Share and BPS Analysis by Type , 2025 and 2035
  • Figure 28: Latin America Passive and Interconnecting Electronic Components Market Y-o-Y Growth Comparison by Type , 2025–2035
  • Figure 29: Latin America Passive and Interconnecting Electronic Components Market Attractiveness Analysis by Type
  • Figure 30: Latin America Passive and Interconnecting Electronic Components Market Value Share and BPS Analysis by Application, 2025 and 2035
  • Figure 31: Latin America Passive and Interconnecting Electronic Components Market Y-o-Y Growth Comparison by Application, 2025–2035
  • Figure 32: Latin America Passive and Interconnecting Electronic Components Market Attractiveness Analysis by Application
  • Figure 33: Western Europe Passive and Interconnecting Electronic Components Market Value Share and BPS Analysis by Country, 2025 and 2035
  • Figure 34: Western Europe Passive and Interconnecting Electronic Components Market Value Share and BPS Analysis by Type , 2025 and 2035
  • Figure 35: Western Europe Passive and Interconnecting Electronic Components Market Y-o-Y Growth Comparison by Type , 2025–2035
  • Figure 36: Western Europe Passive and Interconnecting Electronic Components Market Attractiveness Analysis by Type
  • Figure 37: Western Europe Passive and Interconnecting Electronic Components Market Value Share and BPS Analysis by Application, 2025 and 2035
  • Figure 38: Western Europe Passive and Interconnecting Electronic Components Market Y-o-Y Growth Comparison by Application, 2025–2035
  • Figure 39: Western Europe Passive and Interconnecting Electronic Components Market Attractiveness Analysis by Application
  • Figure 40: Eastern Europe Passive and Interconnecting Electronic Components Market Value Share and BPS Analysis by Country, 2025 and 2035
  • Figure 41: Eastern Europe Passive and Interconnecting Electronic Components Market Value Share and BPS Analysis by Type , 2025 and 2035
  • Figure 42: Eastern Europe Passive and Interconnecting Electronic Components Market Y-o-Y Growth Comparison by Type , 2025–2035
  • Figure 43: Eastern Europe Passive and Interconnecting Electronic Components Market Attractiveness Analysis by Type
  • Figure 44: Eastern Europe Passive and Interconnecting Electronic Components Market Value Share and BPS Analysis by Application, 2025 and 2035
  • Figure 45: Eastern Europe Passive and Interconnecting Electronic Components Market Y-o-Y Growth Comparison by Application, 2025–2035
  • Figure 46: Eastern Europe Passive and Interconnecting Electronic Components Market Attractiveness Analysis by Application
  • Figure 47: East Asia Passive and Interconnecting Electronic Components Market Value Share and BPS Analysis by Country, 2025 and 2035
  • Figure 48: East Asia Passive and Interconnecting Electronic Components Market Value Share and BPS Analysis by Type , 2025 and 2035
  • Figure 49: East Asia Passive and Interconnecting Electronic Components Market Y-o-Y Growth Comparison by Type , 2025–2035
  • Figure 50: East Asia Passive and Interconnecting Electronic Components Market Attractiveness Analysis by Type
  • Figure 51: East Asia Passive and Interconnecting Electronic Components Market Value Share and BPS Analysis by Application, 2025 and 2035
  • Figure 52: East Asia Passive and Interconnecting Electronic Components Market Y-o-Y Growth Comparison by Application, 2025–2035
  • Figure 53: East Asia Passive and Interconnecting Electronic Components Market Attractiveness Analysis by Application
  • Figure 54: South Asia and Pacific Passive and Interconnecting Electronic Components Market Value Share and BPS Analysis by Country, 2025 and 2035
  • Figure 55: South Asia and Pacific Passive and Interconnecting Electronic Components Market Value Share and BPS Analysis by Type , 2025 and 2035
  • Figure 56: South Asia and Pacific Passive and Interconnecting Electronic Components Market Y-o-Y Growth Comparison by Type , 2025–2035
  • Figure 57: South Asia and Pacific Passive and Interconnecting Electronic Components Market Attractiveness Analysis by Type
  • Figure 58: South Asia and Pacific Passive and Interconnecting Electronic Components Market Value Share and BPS Analysis by Application, 2025 and 2035
  • Figure 59: South Asia and Pacific Passive and Interconnecting Electronic Components Market Y-o-Y Growth Comparison by Application, 2025–2035
  • Figure 60: South Asia and Pacific Passive and Interconnecting Electronic Components Market Attractiveness Analysis by Application
  • Figure 61: Middle East & Africa Passive and Interconnecting Electronic Components Market Value Share and BPS Analysis by Country, 2025 and 2035
  • Figure 62: Middle East & Africa Passive and Interconnecting Electronic Components Market Value Share and BPS Analysis by Type , 2025 and 2035
  • Figure 63: Middle East & Africa Passive and Interconnecting Electronic Components Market Y-o-Y Growth Comparison by Type , 2025–2035
  • Figure 64: Middle East & Africa Passive and Interconnecting Electronic Components Market Attractiveness Analysis by Type
  • Figure 65: Middle East & Africa Passive and Interconnecting Electronic Components Market Value Share and BPS Analysis by Application, 2025 and 2035
  • Figure 66: Middle East & Africa Passive and Interconnecting Electronic Components Market Y-o-Y Growth Comparison by Application, 2025–2035
  • Figure 67: Middle East & Africa Passive and Interconnecting Electronic Components Market Attractiveness Analysis by Application
  • Figure 68: Global Passive and Interconnecting Electronic Components Market – Tier Structure Analysis
  • Figure 69: Global Passive and Interconnecting Electronic Components Market – Company Share Analysis

Frequently Asked Questions

How big is the passive and interconnecting electronic components market in 2025?

The global passive and interconnecting electronic components market is estimated to be valued at USD 192.6 billion in 2025.

What will be the size of passive and interconnecting electronic components market in 2035?

The market size for the passive and interconnecting electronic components market is projected to reach USD 375.4 billion by 2035.

How much will be the passive and interconnecting electronic components market growth between 2025 and 2035?

The passive and interconnecting electronic components market is expected to grow at a 6.9% CAGR between 2025 and 2035.

What are the key product types in the passive and interconnecting electronic components market?

The key product types in passive and interconnecting electronic components market are passive, _resistors, _capacitors, _inductors, _transformers, _others, interconnecting, _pcb, _connectors, _switches & relays and _others.

Which application segment to contribute significant share in the passive and interconnecting electronic components market in 2025?

In terms of application, consumer electronics segment to command 27.4% share in the passive and interconnecting electronic components market in 2025.

Explore Similar Insights

Future Market Insights

Passive and Interconnecting Electronic Components Market

Chat With

MaRIA

Hi There, I am MaRIA, Your Market Research Intelligence Assistant. How may I help you?