Permeability Testing Machine Market Size and Share Forecast Outlook 2025 to 2035

The Permeability Testing Machine Market is estimated to be valued at USD 159.2 million in 2025 and is projected to reach USD 287.7 million by 2035, registering a compound annual growth rate (CAGR) of 6.1% over the forecast period.
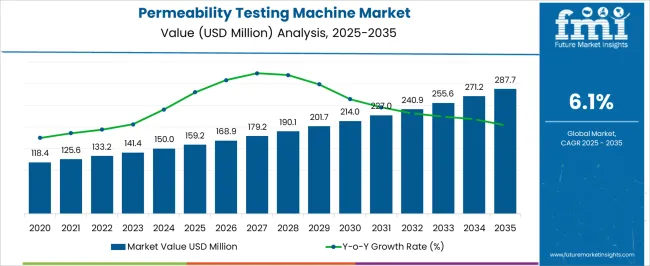
Quick Stats for Permeability Testing Machine Market

  • Permeability Testing Machine Market Value (2025): USD 159.2 million
  • Permeability Testing Machine Market Forecast Value (2035): USD 287.7 million
  • Permeability Testing Machine Market Forecast CAGR: 6.1%
  • Leading Segment in Permeability Testing Machine Market in 2025: Sand Permeability Testing Machine (35.0%)
  • Key Growth Regions in Permeability Testing Machine Market: North America, Asia-Pacific, Europe
  • Top Key Players in Permeability Testing Machine Market: Labthink Instruments, Asian Test Equipments, OFI Testing Equipment, Testing Machines, Texcare Instruments, Versatile Equipments, Zhejiang Tugong Instrument, Qualitest, Brugger Munchen, Torontech, Rycobel, U-Therm International

Permeability Testing Machine Market Market Value Analysis

Permeability Testing Machine Market Key Takeaways

Metric Value
Permeability Testing Machine Market Estimated Value in (2025 E) USD 159.2 million
Permeability Testing Machine Market Forecast Value in (2035 F) USD 287.7 million
Forecast CAGR (2025 to 2035) 6.1%

Why is the Permeability Testing Machine Market Growing?

The Permeability Testing Machine market is experiencing steady growth, driven by the increasing demand for high-precision testing in construction, civil engineering, and material research applications. The market has been shaped by the growing need for accurate assessment of soil, sand, and other granular materials to ensure structural stability and compliance with safety standards. Investment in infrastructure projects, particularly in urban development and transportation, is driving demand for advanced testing equipment capable of providing reliable and repeatable results.

The evolution of machinery from purely mechanical to semi-automated and software-integrated systems has enhanced operational efficiency, reducing time and labor costs. The market is also influenced by the increasing adoption of international testing standards, which necessitate standardized equipment for consistent measurements.

The focus on quality assurance in material testing and the rising complexity of construction projects are expected to sustain long-term growth The future outlook of the market is supported by continuous innovation in testing techniques and increasing adoption of automated and digital systems in laboratory environments.

Segmental Analysis

The permeability testing machine market is segmented by type, orientation, operation, end user, and geographic regions. By type, permeability testing machine market is divided into Sand Permeability Testing Machine, Water Permeability Testing Machine, Air Permeability Testing Machine, Gas Permeability Testing Machine, and Others (Concrete Permeability Testing Machine, etc.). In terms of orientation, permeability testing machine market is classified into Horizontal and Vertical. Based on operation, permeability testing machine market is segmented into Manual and Digital. By end user, permeability testing machine market is segmented into Construction Industry and Institution. Regionally, the permeability testing machine industry is classified into North America, Latin America, Western Europe, Eastern Europe, Balkan & Baltic Countries, Russia & Belarus, Central Asia, East Asia, South Asia & Pacific, and the Middle East & Africa.

Insights into the Sand Permeability Testing Machine Segment

The Sand Permeability Testing Machine type is projected to hold 35.00% of the market revenue share in 2025, making it the leading type in this segment. This dominance is being attributed to its specialized application in evaluating the permeability characteristics of sand and other granular materials in civil engineering and construction projects.

The segment has been supported by the rising focus on ensuring soil stability and accurate assessment of drainage properties, which are critical in infrastructure and foundation design. The ability of sand permeability machines to provide consistent and precise measurements has enhanced their adoption in laboratories and field testing scenarios.

Furthermore, the modular design of these machines allows for integration with digital measurement and reporting systems, improving efficiency and reducing human error As infrastructure projects continue to expand globally, the demand for reliable and standardized sand permeability testing equipment is expected to sustain the growth of this segment, reinforcing its position as the leading type in the market.
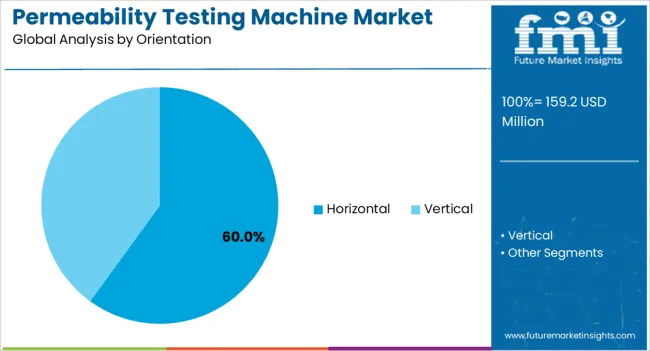
Insights into the Horizontal Orientation Segment

Permeability Testing Machine Market Analysis By Orientation

The Horizontal Orientation segment is expected to account for 60.00% of the market revenue share in 2025, emerging as the dominant orientation type. This preference is being driven by the advantages offered in handling and testing bulk samples of sand and soil, allowing for uniform distribution of material and accurate measurement of permeability.

Horizontal systems facilitate easier observation and manipulation of test specimens, which improves data reliability and repeatability. The growth of this segment has been accelerated by its compatibility with standardized laboratory protocols and testing methods that require controlled sample orientation.

Additionally, the operational simplicity and ergonomic design of horizontal systems have enhanced adoption in both academic and commercial laboratories As the need for precise and reproducible permeability testing continues to increase, horizontal machines are expected to maintain leadership, supported by their proven efficiency, adaptability, and alignment with international testing standards.
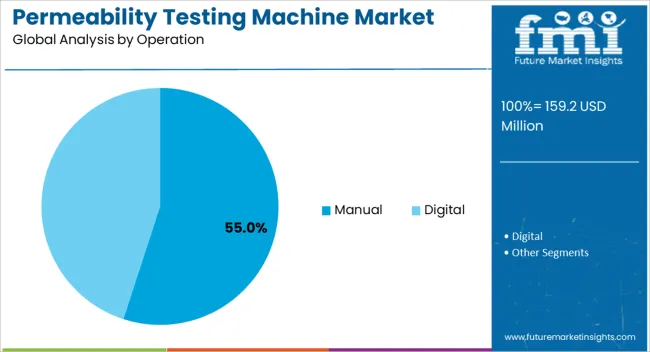
Insights into the Manual Operation Segment

Permeability Testing Machine Market Analysis By Operation

The Manual Operation segment is projected to capture 55.00% of the market revenue share in 2025, making it the leading operational type. This predominance is being attributed to its ease of use, lower initial cost, and flexibility in diverse testing environments.

Manual systems allow operators to adjust parameters directly, providing greater control over test conditions and enabling customized testing protocols for different materials. The segment has grown in popularity due to the simplicity of maintenance and reduced dependency on electrical or electronic components, making it suitable for laboratories with limited technical infrastructure.

Manual operation machines also provide a reliable means of training and educational use, allowing students and technicians to understand the fundamentals of permeability testing As infrastructure development and quality control in material testing remain critical priorities, the manual operation segment is expected to sustain strong demand, supported by its cost-effectiveness, reliability, and adaptability across various testing scenarios.

Market Overview

Permeability Testing Machine Market: Introduction

The permeability testing machine is a laboratory testing machine used to measure the rate of flow of water through the soil. The permeability can be tested either in the laboratory or on the field. Field test produces a more realistic estimation of the permeability as compared to laboratory test.

The permeability testing machine market is estimated to show significant growth as the demand from end-user industry is increasing day-by-day in the global market. Different types of permeability testing machines are available in the market based on operations including manual and digital. The digital segment is estimated to gain traction in the coming years.
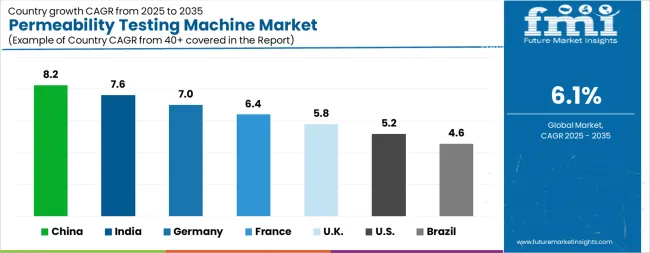
Analysis of Permeability Testing Machine Market By Key Countries

Permeability Testing Machine Market Cagr Analysis By Country

Country CAGR
China 8.2%
India 7.6%
Germany 7.0%
France 6.4%
U.K. 5.8%
U.S. 5.2%
Brazil 4.6%

Country-wise Analysis

The Permeability Testing Machine Market is expected to register a CAGR of 6.1% during the forecast period, exhibiting varied country level momentum. China leads with the highest CAGR of 8.2%, followed by India at 7.6%. Developed markets such as Germany, France, and the U.K. continue to expand steadily, while the U.S. is likely to grow at consistent rates. Brazil posts the lowest CAGR at 4.6%, yet still underscores a broadly positive trajectory for the global Permeability Testing Machine Market. In 2024, Germany held a dominant revenue in the Western Europe market and is expected to grow with a CAGR of 7.0%. The U.S. Permeability Testing Machine Market is estimated to be valued at USD 58.2 million in 2025 and is anticipated to reach a valuation of USD 96.5 million by 2035. Sales are projected to rise at a CAGR of 5.2% over the forecast period between 2025 and 2035. While Japan and South Korea markets are estimated to be valued at USD 7.3 million and USD 4.5 million respectively in 2025.
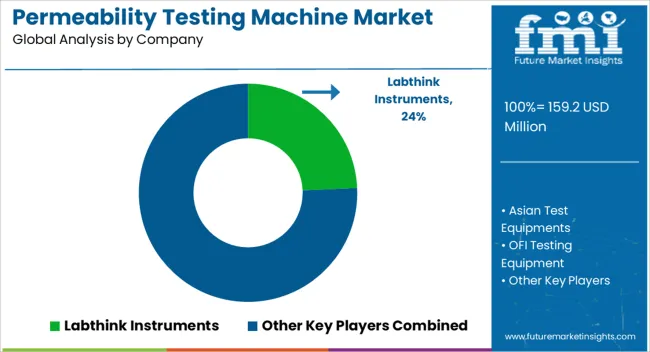
Key Players in the Permeability Testing Machine Market

Permeability Testing Machine Market Analysis By Company

  • Labthink Instruments
  • Asian Test Equipments
  • OFI Testing Equipment
  • Testing Machines
  • Texcare Instruments
  • Versatile Equipments
  • Zhejiang Tugong Instrument
  • Qualitest
  • Brugger Munchen
  • Torontech
  • Rycobel
  • U-Therm International

Scope of the Report

Item Value
Quantitative Units USD 159.2 Million
Type Sand Permeability Testing Machine, Water Permeability Testing Machine, Air Permeability Testing Machine, Gas Permeability Testing Machine, and Others (Concrete Permeability Testing Machine, etc.)
Orientation Horizontal and Vertical
Operation Manual and Digital
End User Construction Industry and Institution
Regions Covered North America, Europe, Asia-Pacific, Latin America, Middle East & Africa
Country Covered United States, Canada, Germany, France, United Kingdom, China, Japan, India, Brazil, South Africa
Key Companies Profiled Labthink Instruments, Asian Test Equipments, OFI Testing Equipment, Testing Machines, Texcare Instruments, Versatile Equipments, Zhejiang Tugong Instrument, Qualitest, Brugger Munchen, Torontech, Rycobel, and U-Therm International

Permeability Testing Machine Market by Segments

Type:

  • Sand Permeability Testing Machine
  • Water Permeability Testing Machine
  • Air Permeability Testing Machine
  • Gas Permeability Testing Machine
  • Others (Concrete Permeability Testing Machine, etc.)

Orientation:

  • Horizontal
  • Vertical

Operation:

  • Manual
  • Digital

End User:

  • Construction Industry
  • Institution

Region:

  • North America
    • U.S.
    • Canada
    • Mexico
  • Latin America
    • Brazil
    • Chile
    • Rest of Latin America
  • Western Europe
    • Germany
    • U.K.
    • Italy
    • Spain
    • France
    • Nordic
    • BENELUX
    • Rest of Western Europe
  • Eastern Europe
    • Russia
    • Poland
    • Hungary
    • Balkan & Baltic
    • Rest of Eastern Europe
  • East Asia
    • China
    • Japan
    • South Korea
  • South Asia and Pacific
    • India
    • ASEAN
    • Australia & New Zealand
    • Rest of South Asia and Pacific
  • Middle East & Africa
    • Kingdom of Saudi Arabia
    • Other GCC Countries
    • Turkiye
    • South Africa
    • Other African Union
    • Rest of Middle East & Africa

Frequently Asked Questions

How big is the permeability testing machine market in 2025?

The global permeability testing machine market is estimated to be valued at USD 159.2 million in 2025.

What will be the size of permeability testing machine market in 2035?

The market size for the permeability testing machine market is projected to reach USD 287.7 million by 2035.

How much will be the permeability testing machine market growth between 2025 and 2035?

The permeability testing machine market is expected to grow at a 6.1% CAGR between 2025 and 2035.

What are the key product types in the permeability testing machine market?

The key product types in permeability testing machine market are sand permeability testing machine, water permeability testing machine, air permeability testing machine, gas permeability testing machine and others (concrete permeability testing machine, etc.).

Which orientation segment to contribute significant share in the permeability testing machine market in 2025?

In terms of orientation, horizontal segment to command 60.0% share in the permeability testing machine market in 2025.

Table of Content

  1. Executive Summary
    • Global Market Outlook
    • Demand-side Trends
    • Supply-side Trends
    • Technology Roadmap Analysis
    • Analysis and Recommendations
  2. Market Overview
    • Market Coverage / Taxonomy
    • Market Definition / Scope / Limitations
  3. Market Background
    • Market Dynamics
      • Drivers
      • Restraints
      • Opportunity
      • Trends
    • Scenario Forecast
      • Demand in Optimistic Scenario
      • Demand in Likely Scenario
      • Demand in Conservative Scenario
    • Opportunity Map Analysis
    • Product Life Cycle Analysis
    • Supply Chain Analysis
    • Investment Feasibility Matrix
    • Value Chain Analysis
    • PESTLE and Porter’s Analysis
    • Regulatory Landscape
    • Regional Parent Market Outlook
    • Production and Consumption Statistics
    • Import and Export Statistics
  4. Global Market Analysis 2020-2024 and Forecast, 2025-2035
    • Historical Market Size Value (USD Million) Analysis, 2020-2024
    • Current and Future Market Size Value (USD Million) Projections, 2025-2035
      • Y-o-Y Growth Trend Analysis
      • Absolute $ Opportunity Analysis
  5. Global Market Pricing Analysis 2020-2024 and Forecast 2025-2035
  6. Global Market Analysis 2020-2024 and Forecast 2025-2035, By Type
    • Introduction / Key Findings
    • Historical Market Size Value (USD Million) Analysis By Type , 2020-2024
    • Current and Future Market Size Value (USD Million) Analysis and Forecast By Type , 2025-2035
      • Sand Permeability Testing Machine
      • Water Permeability Testing Machine
      • Air Permeability Testing Machine
      • Gas Permeability Testing Machine
      • Others (Concrete Permeability Testing Machine, etc.)
    • Y-o-Y Growth Trend Analysis By Type , 2020-2024
    • Absolute $ Opportunity Analysis By Type , 2025-2035
  7. Global Market Analysis 2020-2024 and Forecast 2025-2035, By Orientation
    • Introduction / Key Findings
    • Historical Market Size Value (USD Million) Analysis By Orientation, 2020-2024
    • Current and Future Market Size Value (USD Million) Analysis and Forecast By Orientation, 2025-2035
      • Horizontal
      • Vertical
    • Y-o-Y Growth Trend Analysis By Orientation, 2020-2024
    • Absolute $ Opportunity Analysis By Orientation, 2025-2035
  8. Global Market Analysis 2020-2024 and Forecast 2025-2035, By Operation
    • Introduction / Key Findings
    • Historical Market Size Value (USD Million) Analysis By Operation, 2020-2024
    • Current and Future Market Size Value (USD Million) Analysis and Forecast By Operation, 2025-2035
      • Manual
      • Digital
    • Y-o-Y Growth Trend Analysis By Operation, 2020-2024
    • Absolute $ Opportunity Analysis By Operation, 2025-2035
  9. Global Market Analysis 2020-2024 and Forecast 2025-2035, By End User
    • Introduction / Key Findings
    • Historical Market Size Value (USD Million) Analysis By End User, 2020-2024
    • Current and Future Market Size Value (USD Million) Analysis and Forecast By End User, 2025-2035
      • Construction Industry
      • Institution
    • Y-o-Y Growth Trend Analysis By End User, 2020-2024
    • Absolute $ Opportunity Analysis By End User, 2025-2035
  10. Global Market Analysis 2020-2024 and Forecast 2025-2035, By Region
    • Introduction
    • Historical Market Size Value (USD Million) Analysis By Region, 2020-2024
    • Current Market Size Value (USD Million) Analysis and Forecast By Region, 2025-2035
      • North America
      • Latin America
      • Western Europe
      • Eastern Europe
      • East Asia
      • South Asia and Pacific
      • Middle East & Africa
    • Market Attractiveness Analysis By Region
  11. North America Market Analysis 2020-2024 and Forecast 2025-2035, By Country
    • Historical Market Size Value (USD Million) Trend Analysis By Market Taxonomy, 2020-2024
    • Market Size Value (USD Million) Forecast By Market Taxonomy, 2025-2035
      • By Country
        • U.S.
        • Canada
        • Mexico
      • By Type
      • By Orientation
      • By Operation
      • By End User
    • Market Attractiveness Analysis
      • By Country
      • By Type
      • By Orientation
      • By Operation
      • By End User
    • Key Takeaways
  12. Latin America Market Analysis 2020-2024 and Forecast 2025-2035, By Country
    • Historical Market Size Value (USD Million) Trend Analysis By Market Taxonomy, 2020-2024
    • Market Size Value (USD Million) Forecast By Market Taxonomy, 2025-2035
      • By Country
        • Brazil
        • Chile
        • Rest of Latin America
      • By Type
      • By Orientation
      • By Operation
      • By End User
    • Market Attractiveness Analysis
      • By Country
      • By Type
      • By Orientation
      • By Operation
      • By End User
    • Key Takeaways
  13. Western Europe Market Analysis 2020-2024 and Forecast 2025-2035, By Country
    • Historical Market Size Value (USD Million) Trend Analysis By Market Taxonomy, 2020-2024
    • Market Size Value (USD Million) Forecast By Market Taxonomy, 2025-2035
      • By Country
        • Germany
        • U.K.
        • Italy
        • Spain
        • France
        • Nordic
        • BENELUX
        • Rest of Western Europe
      • By Type
      • By Orientation
      • By Operation
      • By End User
    • Market Attractiveness Analysis
      • By Country
      • By Type
      • By Orientation
      • By Operation
      • By End User
    • Key Takeaways
  14. Eastern Europe Market Analysis 2020-2024 and Forecast 2025-2035, By Country
    • Historical Market Size Value (USD Million) Trend Analysis By Market Taxonomy, 2020-2024
    • Market Size Value (USD Million) Forecast By Market Taxonomy, 2025-2035
      • By Country
        • Russia
        • Poland
        • Hungary
        • Balkan & Baltic
        • Rest of Eastern Europe
      • By Type
      • By Orientation
      • By Operation
      • By End User
    • Market Attractiveness Analysis
      • By Country
      • By Type
      • By Orientation
      • By Operation
      • By End User
    • Key Takeaways
  15. East Asia Market Analysis 2020-2024 and Forecast 2025-2035, By Country
    • Historical Market Size Value (USD Million) Trend Analysis By Market Taxonomy, 2020-2024
    • Market Size Value (USD Million) Forecast By Market Taxonomy, 2025-2035
      • By Country
        • China
        • Japan
        • South Korea
      • By Type
      • By Orientation
      • By Operation
      • By End User
    • Market Attractiveness Analysis
      • By Country
      • By Type
      • By Orientation
      • By Operation
      • By End User
    • Key Takeaways
  16. South Asia and Pacific Market Analysis 2020-2024 and Forecast 2025-2035, By Country
    • Historical Market Size Value (USD Million) Trend Analysis By Market Taxonomy, 2020-2024
    • Market Size Value (USD Million) Forecast By Market Taxonomy, 2025-2035
      • By Country
        • India
        • ASEAN
        • Australia & New Zealand
        • Rest of South Asia and Pacific
      • By Type
      • By Orientation
      • By Operation
      • By End User
    • Market Attractiveness Analysis
      • By Country
      • By Type
      • By Orientation
      • By Operation
      • By End User
    • Key Takeaways
  17. Middle East & Africa Market Analysis 2020-2024 and Forecast 2025-2035, By Country
    • Historical Market Size Value (USD Million) Trend Analysis By Market Taxonomy, 2020-2024
    • Market Size Value (USD Million) Forecast By Market Taxonomy, 2025-2035
      • By Country
        • Kingdom of Saudi Arabia
        • Other GCC Countries
        • Turkiye
        • South Africa
        • Other African Union
        • Rest of Middle East & Africa
      • By Type
      • By Orientation
      • By Operation
      • By End User
    • Market Attractiveness Analysis
      • By Country
      • By Type
      • By Orientation
      • By Operation
      • By End User
    • Key Takeaways
  18. Key Countries Market Analysis
    • U.S.
      • Pricing Analysis
      • Market Share Analysis, 2024
        • By Type
        • By Orientation
        • By Operation
        • By End User
    • Canada
      • Pricing Analysis
      • Market Share Analysis, 2024
        • By Type
        • By Orientation
        • By Operation
        • By End User
    • Mexico
      • Pricing Analysis
      • Market Share Analysis, 2024
        • By Type
        • By Orientation
        • By Operation
        • By End User
    • Brazil
      • Pricing Analysis
      • Market Share Analysis, 2024
        • By Type
        • By Orientation
        • By Operation
        • By End User
    • Chile
      • Pricing Analysis
      • Market Share Analysis, 2024
        • By Type
        • By Orientation
        • By Operation
        • By End User
    • Germany
      • Pricing Analysis
      • Market Share Analysis, 2024
        • By Type
        • By Orientation
        • By Operation
        • By End User
    • U.K.
      • Pricing Analysis
      • Market Share Analysis, 2024
        • By Type
        • By Orientation
        • By Operation
        • By End User
    • Italy
      • Pricing Analysis
      • Market Share Analysis, 2024
        • By Type
        • By Orientation
        • By Operation
        • By End User
    • Spain
      • Pricing Analysis
      • Market Share Analysis, 2024
        • By Type
        • By Orientation
        • By Operation
        • By End User
    • France
      • Pricing Analysis
      • Market Share Analysis, 2024
        • By Type
        • By Orientation
        • By Operation
        • By End User
    • India
      • Pricing Analysis
      • Market Share Analysis, 2024
        • By Type
        • By Orientation
        • By Operation
        • By End User
    • ASEAN
      • Pricing Analysis
      • Market Share Analysis, 2024
        • By Type
        • By Orientation
        • By Operation
        • By End User
    • Australia & New Zealand
      • Pricing Analysis
      • Market Share Analysis, 2024
        • By Type
        • By Orientation
        • By Operation
        • By End User
    • China
      • Pricing Analysis
      • Market Share Analysis, 2024
        • By Type
        • By Orientation
        • By Operation
        • By End User
    • Japan
      • Pricing Analysis
      • Market Share Analysis, 2024
        • By Type
        • By Orientation
        • By Operation
        • By End User
    • South Korea
      • Pricing Analysis
      • Market Share Analysis, 2024
        • By Type
        • By Orientation
        • By Operation
        • By End User
    • Russia
      • Pricing Analysis
      • Market Share Analysis, 2024
        • By Type
        • By Orientation
        • By Operation
        • By End User
    • Poland
      • Pricing Analysis
      • Market Share Analysis, 2024
        • By Type
        • By Orientation
        • By Operation
        • By End User
    • Hungary
      • Pricing Analysis
      • Market Share Analysis, 2024
        • By Type
        • By Orientation
        • By Operation
        • By End User
    • Kingdom of Saudi Arabia
      • Pricing Analysis
      • Market Share Analysis, 2024
        • By Type
        • By Orientation
        • By Operation
        • By End User
    • Turkiye
      • Pricing Analysis
      • Market Share Analysis, 2024
        • By Type
        • By Orientation
        • By Operation
        • By End User
    • South Africa
      • Pricing Analysis
      • Market Share Analysis, 2024
        • By Type
        • By Orientation
        • By Operation
        • By End User
  19. Market Structure Analysis
    • Competition Dashboard
    • Competition Benchmarking
    • Market Share Analysis of Top Players
      • By Regional
      • By Type
      • By Orientation
      • By Operation
      • By End User
  20. Competition Analysis
    • Competition Deep Dive
      • Labthink Instruments
        • Overview
        • Product Portfolio
        • Profitability by Market Segments (Product/Age /Sales Channel/Region)
        • Sales Footprint
        • Strategy Overview
          • Marketing Strategy
          • Product Strategy
          • Channel Strategy
      • Asian Test Equipments
      • OFI Testing Equipment
      • Testing Machines
      • Texcare Instruments
      • Versatile Equipments
      • Zhejiang Tugong Instrument
      • Qualitest
      • Brugger Munchen
      • Torontech
      • Rycobel
      • U-Therm International
  21. Assumptions & Acronyms Used
  22. Research Methodology

List of Tables

  • Table 1: Global Permeability Testing Machine Market Value (USD Mn) Forecast by Region, 2020-2035
  • Table 2: Global Permeability Testing Machine Market Value (USD Mn) Forecast by Type , 2020-2035
  • Table 3: Global Permeability Testing Machine Market Value (USD Mn) Forecast by Orientation, 2020-2035
  • Table 4: Global Permeability Testing Machine Market Value (USD Mn) Forecast by Operation, 2020-2035
  • Table 5: Global Permeability Testing Machine Market Value (USD Mn) Forecast by End User, 2020-2035
  • Table 6: North America Permeability Testing Machine Market Value (USD Mn) Forecast by Country, 2020-2035
  • Table 7: North America Permeability Testing Machine Market Value (USD Mn) Forecast by Type , 2020-2035
  • Table 8: North America Permeability Testing Machine Market Value (USD Mn) Forecast by Orientation, 2020-2035
  • Table 9: North America Permeability Testing Machine Market Value (USD Mn) Forecast by Operation, 2020-2035
  • Table 10: North America Permeability Testing Machine Market Value (USD Mn) Forecast by End User, 2020-2035
  • Table 11: Latin America Permeability Testing Machine Market Value (USD Mn) Forecast by Country, 2020-2035
  • Table 12: Latin America Permeability Testing Machine Market Value (USD Mn) Forecast by Type , 2020-2035
  • Table 13: Latin America Permeability Testing Machine Market Value (USD Mn) Forecast by Orientation, 2020-2035
  • Table 14: Latin America Permeability Testing Machine Market Value (USD Mn) Forecast by Operation, 2020-2035
  • Table 15: Latin America Permeability Testing Machine Market Value (USD Mn) Forecast by End User, 2020-2035
  • Table 16: Western Europe Permeability Testing Machine Market Value (USD Mn) Forecast by Country, 2020-2035
  • Table 17: Western Europe Permeability Testing Machine Market Value (USD Mn) Forecast by Type , 2020-2035
  • Table 18: Western Europe Permeability Testing Machine Market Value (USD Mn) Forecast by Orientation, 2020-2035
  • Table 19: Western Europe Permeability Testing Machine Market Value (USD Mn) Forecast by Operation, 2020-2035
  • Table 20: Western Europe Permeability Testing Machine Market Value (USD Mn) Forecast by End User, 2020-2035
  • Table 21: Eastern Europe Permeability Testing Machine Market Value (USD Mn) Forecast by Country, 2020-2035
  • Table 22: Eastern Europe Permeability Testing Machine Market Value (USD Mn) Forecast by Type , 2020-2035
  • Table 23: Eastern Europe Permeability Testing Machine Market Value (USD Mn) Forecast by Orientation, 2020-2035
  • Table 24: Eastern Europe Permeability Testing Machine Market Value (USD Mn) Forecast by Operation, 2020-2035
  • Table 25: Eastern Europe Permeability Testing Machine Market Value (USD Mn) Forecast by End User, 2020-2035
  • Table 26: East Asia Permeability Testing Machine Market Value (USD Mn) Forecast by Country, 2020-2035
  • Table 27: East Asia Permeability Testing Machine Market Value (USD Mn) Forecast by Type , 2020-2035
  • Table 28: East Asia Permeability Testing Machine Market Value (USD Mn) Forecast by Orientation, 2020-2035
  • Table 29: East Asia Permeability Testing Machine Market Value (USD Mn) Forecast by Operation, 2020-2035
  • Table 30: East Asia Permeability Testing Machine Market Value (USD Mn) Forecast by End User, 2020-2035
  • Table 31: South Asia and Pacific Permeability Testing Machine Market Value (USD Mn) Forecast by Country, 2020-2035
  • Table 32: South Asia and Pacific Permeability Testing Machine Market Value (USD Mn) Forecast by Type , 2020-2035
  • Table 33: South Asia and Pacific Permeability Testing Machine Market Value (USD Mn) Forecast by Orientation, 2020-2035
  • Table 34: South Asia and Pacific Permeability Testing Machine Market Value (USD Mn) Forecast by Operation, 2020-2035
  • Table 35: South Asia and Pacific Permeability Testing Machine Market Value (USD Mn) Forecast by End User, 2020-2035
  • Table 36: Middle East & Africa Permeability Testing Machine Market Value (USD Mn) Forecast by Country, 2020-2035
  • Table 37: Middle East & Africa Permeability Testing Machine Market Value (USD Mn) Forecast by Type , 2020-2035
  • Table 38: Middle East & Africa Permeability Testing Machine Market Value (USD Mn) Forecast by Orientation, 2020-2035
  • Table 39: Middle East & Africa Permeability Testing Machine Market Value (USD Mn) Forecast by Operation, 2020-2035
  • Table 40: Middle East & Africa Permeability Testing Machine Market Value (USD Mn) Forecast by End User, 2020-2035

List of Figures

  • Figure 1: Global Permeability Testing Machine Market Pricing Analysis
  • Figure 2: Global Permeability Testing Machine Market Value (USD Mn) Forecast 2020–2035
  • Figure 3: Global Permeability Testing Machine Market Value Share and BPS Analysis by Type , 2025 and 2035
  • Figure 4: Global Permeability Testing Machine Market Y-o-Y Growth Comparison by Type , 2025–2035
  • Figure 5: Global Permeability Testing Machine Market Attractiveness Analysis by Type
  • Figure 6: Global Permeability Testing Machine Market Value Share and BPS Analysis by Orientation, 2025 and 2035
  • Figure 7: Global Permeability Testing Machine Market Y-o-Y Growth Comparison by Orientation, 2025–2035
  • Figure 8: Global Permeability Testing Machine Market Attractiveness Analysis by Orientation
  • Figure 9: Global Permeability Testing Machine Market Value Share and BPS Analysis by Operation, 2025 and 2035
  • Figure 10: Global Permeability Testing Machine Market Y-o-Y Growth Comparison by Operation, 2025–2035
  • Figure 11: Global Permeability Testing Machine Market Attractiveness Analysis by Operation
  • Figure 12: Global Permeability Testing Machine Market Value Share and BPS Analysis by End User, 2025 and 2035
  • Figure 13: Global Permeability Testing Machine Market Y-o-Y Growth Comparison by End User, 2025–2035
  • Figure 14: Global Permeability Testing Machine Market Attractiveness Analysis by End User
  • Figure 15: Global Permeability Testing Machine Market Value (USD Mn) Share and BPS Analysis by Region, 2025 and 2035
  • Figure 16: Global Permeability Testing Machine Market Y-o-Y Growth Comparison by Region, 2025–2035
  • Figure 17: Global Permeability Testing Machine Market Attractiveness Analysis by Region
  • Figure 18: North America Permeability Testing Machine Market Incremental Dollar Opportunity, 2025–2035
  • Figure 19: Latin America Permeability Testing Machine Market Incremental Dollar Opportunity, 2025–2035
  • Figure 20: Western Europe Permeability Testing Machine Market Incremental Dollar Opportunity, 2025–2035
  • Figure 21: Eastern Europe Permeability Testing Machine Market Incremental Dollar Opportunity, 2025–2035
  • Figure 22: East Asia Permeability Testing Machine Market Incremental Dollar Opportunity, 2025–2035
  • Figure 23: South Asia and Pacific Permeability Testing Machine Market Incremental Dollar Opportunity, 2025–2035
  • Figure 24: Middle East & Africa Permeability Testing Machine Market Incremental Dollar Opportunity, 2025–2035
  • Figure 25: North America Permeability Testing Machine Market Value Share and BPS Analysis by Country, 2025 and 2035
  • Figure 26: North America Permeability Testing Machine Market Value Share and BPS Analysis by Type , 2025 and 2035
  • Figure 27: North America Permeability Testing Machine Market Y-o-Y Growth Comparison by Type , 2025–2035
  • Figure 28: North America Permeability Testing Machine Market Attractiveness Analysis by Type
  • Figure 29: North America Permeability Testing Machine Market Value Share and BPS Analysis by Orientation, 2025 and 2035
  • Figure 30: North America Permeability Testing Machine Market Y-o-Y Growth Comparison by Orientation, 2025–2035
  • Figure 31: North America Permeability Testing Machine Market Attractiveness Analysis by Orientation
  • Figure 32: North America Permeability Testing Machine Market Value Share and BPS Analysis by Operation, 2025 and 2035
  • Figure 33: North America Permeability Testing Machine Market Y-o-Y Growth Comparison by Operation, 2025–2035
  • Figure 34: North America Permeability Testing Machine Market Attractiveness Analysis by Operation
  • Figure 35: North America Permeability Testing Machine Market Value Share and BPS Analysis by End User, 2025 and 2035
  • Figure 36: North America Permeability Testing Machine Market Y-o-Y Growth Comparison by End User, 2025–2035
  • Figure 37: North America Permeability Testing Machine Market Attractiveness Analysis by End User
  • Figure 38: Latin America Permeability Testing Machine Market Value Share and BPS Analysis by Country, 2025 and 2035
  • Figure 39: Latin America Permeability Testing Machine Market Value Share and BPS Analysis by Type , 2025 and 2035
  • Figure 40: Latin America Permeability Testing Machine Market Y-o-Y Growth Comparison by Type , 2025–2035
  • Figure 41: Latin America Permeability Testing Machine Market Attractiveness Analysis by Type
  • Figure 42: Latin America Permeability Testing Machine Market Value Share and BPS Analysis by Orientation, 2025 and 2035
  • Figure 43: Latin America Permeability Testing Machine Market Y-o-Y Growth Comparison by Orientation, 2025–2035
  • Figure 44: Latin America Permeability Testing Machine Market Attractiveness Analysis by Orientation
  • Figure 45: Latin America Permeability Testing Machine Market Value Share and BPS Analysis by Operation, 2025 and 2035
  • Figure 46: Latin America Permeability Testing Machine Market Y-o-Y Growth Comparison by Operation, 2025–2035
  • Figure 47: Latin America Permeability Testing Machine Market Attractiveness Analysis by Operation
  • Figure 48: Latin America Permeability Testing Machine Market Value Share and BPS Analysis by End User, 2025 and 2035
  • Figure 49: Latin America Permeability Testing Machine Market Y-o-Y Growth Comparison by End User, 2025–2035
  • Figure 50: Latin America Permeability Testing Machine Market Attractiveness Analysis by End User
  • Figure 51: Western Europe Permeability Testing Machine Market Value Share and BPS Analysis by Country, 2025 and 2035
  • Figure 52: Western Europe Permeability Testing Machine Market Value Share and BPS Analysis by Type , 2025 and 2035
  • Figure 53: Western Europe Permeability Testing Machine Market Y-o-Y Growth Comparison by Type , 2025–2035
  • Figure 54: Western Europe Permeability Testing Machine Market Attractiveness Analysis by Type
  • Figure 55: Western Europe Permeability Testing Machine Market Value Share and BPS Analysis by Orientation, 2025 and 2035
  • Figure 56: Western Europe Permeability Testing Machine Market Y-o-Y Growth Comparison by Orientation, 2025–2035
  • Figure 57: Western Europe Permeability Testing Machine Market Attractiveness Analysis by Orientation
  • Figure 58: Western Europe Permeability Testing Machine Market Value Share and BPS Analysis by Operation, 2025 and 2035
  • Figure 59: Western Europe Permeability Testing Machine Market Y-o-Y Growth Comparison by Operation, 2025–2035
  • Figure 60: Western Europe Permeability Testing Machine Market Attractiveness Analysis by Operation
  • Figure 61: Western Europe Permeability Testing Machine Market Value Share and BPS Analysis by End User, 2025 and 2035
  • Figure 62: Western Europe Permeability Testing Machine Market Y-o-Y Growth Comparison by End User, 2025–2035
  • Figure 63: Western Europe Permeability Testing Machine Market Attractiveness Analysis by End User
  • Figure 64: Eastern Europe Permeability Testing Machine Market Value Share and BPS Analysis by Country, 2025 and 2035
  • Figure 65: Eastern Europe Permeability Testing Machine Market Value Share and BPS Analysis by Type , 2025 and 2035
  • Figure 66: Eastern Europe Permeability Testing Machine Market Y-o-Y Growth Comparison by Type , 2025–2035
  • Figure 67: Eastern Europe Permeability Testing Machine Market Attractiveness Analysis by Type
  • Figure 68: Eastern Europe Permeability Testing Machine Market Value Share and BPS Analysis by Orientation, 2025 and 2035
  • Figure 69: Eastern Europe Permeability Testing Machine Market Y-o-Y Growth Comparison by Orientation, 2025–2035
  • Figure 70: Eastern Europe Permeability Testing Machine Market Attractiveness Analysis by Orientation
  • Figure 71: Eastern Europe Permeability Testing Machine Market Value Share and BPS Analysis by Operation, 2025 and 2035
  • Figure 72: Eastern Europe Permeability Testing Machine Market Y-o-Y Growth Comparison by Operation, 2025–2035
  • Figure 73: Eastern Europe Permeability Testing Machine Market Attractiveness Analysis by Operation
  • Figure 74: Eastern Europe Permeability Testing Machine Market Value Share and BPS Analysis by End User, 2025 and 2035
  • Figure 75: Eastern Europe Permeability Testing Machine Market Y-o-Y Growth Comparison by End User, 2025–2035
  • Figure 76: Eastern Europe Permeability Testing Machine Market Attractiveness Analysis by End User
  • Figure 77: East Asia Permeability Testing Machine Market Value Share and BPS Analysis by Country, 2025 and 2035
  • Figure 78: East Asia Permeability Testing Machine Market Value Share and BPS Analysis by Type , 2025 and 2035
  • Figure 79: East Asia Permeability Testing Machine Market Y-o-Y Growth Comparison by Type , 2025–2035
  • Figure 80: East Asia Permeability Testing Machine Market Attractiveness Analysis by Type
  • Figure 81: East Asia Permeability Testing Machine Market Value Share and BPS Analysis by Orientation, 2025 and 2035
  • Figure 82: East Asia Permeability Testing Machine Market Y-o-Y Growth Comparison by Orientation, 2025–2035
  • Figure 83: East Asia Permeability Testing Machine Market Attractiveness Analysis by Orientation
  • Figure 84: East Asia Permeability Testing Machine Market Value Share and BPS Analysis by Operation, 2025 and 2035
  • Figure 85: East Asia Permeability Testing Machine Market Y-o-Y Growth Comparison by Operation, 2025–2035
  • Figure 86: East Asia Permeability Testing Machine Market Attractiveness Analysis by Operation
  • Figure 87: East Asia Permeability Testing Machine Market Value Share and BPS Analysis by End User, 2025 and 2035
  • Figure 88: East Asia Permeability Testing Machine Market Y-o-Y Growth Comparison by End User, 2025–2035
  • Figure 89: East Asia Permeability Testing Machine Market Attractiveness Analysis by End User
  • Figure 90: South Asia and Pacific Permeability Testing Machine Market Value Share and BPS Analysis by Country, 2025 and 2035
  • Figure 91: South Asia and Pacific Permeability Testing Machine Market Value Share and BPS Analysis by Type , 2025 and 2035
  • Figure 92: South Asia and Pacific Permeability Testing Machine Market Y-o-Y Growth Comparison by Type , 2025–2035
  • Figure 93: South Asia and Pacific Permeability Testing Machine Market Attractiveness Analysis by Type
  • Figure 94: South Asia and Pacific Permeability Testing Machine Market Value Share and BPS Analysis by Orientation, 2025 and 2035
  • Figure 95: South Asia and Pacific Permeability Testing Machine Market Y-o-Y Growth Comparison by Orientation, 2025–2035
  • Figure 96: South Asia and Pacific Permeability Testing Machine Market Attractiveness Analysis by Orientation
  • Figure 97: South Asia and Pacific Permeability Testing Machine Market Value Share and BPS Analysis by Operation, 2025 and 2035
  • Figure 98: South Asia and Pacific Permeability Testing Machine Market Y-o-Y Growth Comparison by Operation, 2025–2035
  • Figure 99: South Asia and Pacific Permeability Testing Machine Market Attractiveness Analysis by Operation
  • Figure 100: South Asia and Pacific Permeability Testing Machine Market Value Share and BPS Analysis by End User, 2025 and 2035
  • Figure 101: South Asia and Pacific Permeability Testing Machine Market Y-o-Y Growth Comparison by End User, 2025–2035
  • Figure 102: South Asia and Pacific Permeability Testing Machine Market Attractiveness Analysis by End User
  • Figure 103: Middle East & Africa Permeability Testing Machine Market Value Share and BPS Analysis by Country, 2025 and 2035
  • Figure 104: Middle East & Africa Permeability Testing Machine Market Value Share and BPS Analysis by Type , 2025 and 2035
  • Figure 105: Middle East & Africa Permeability Testing Machine Market Y-o-Y Growth Comparison by Type , 2025–2035
  • Figure 106: Middle East & Africa Permeability Testing Machine Market Attractiveness Analysis by Type
  • Figure 107: Middle East & Africa Permeability Testing Machine Market Value Share and BPS Analysis by Orientation, 2025 and 2035
  • Figure 108: Middle East & Africa Permeability Testing Machine Market Y-o-Y Growth Comparison by Orientation, 2025–2035
  • Figure 109: Middle East & Africa Permeability Testing Machine Market Attractiveness Analysis by Orientation
  • Figure 110: Middle East & Africa Permeability Testing Machine Market Value Share and BPS Analysis by Operation, 2025 and 2035
  • Figure 111: Middle East & Africa Permeability Testing Machine Market Y-o-Y Growth Comparison by Operation, 2025–2035
  • Figure 112: Middle East & Africa Permeability Testing Machine Market Attractiveness Analysis by Operation
  • Figure 113: Middle East & Africa Permeability Testing Machine Market Value Share and BPS Analysis by End User, 2025 and 2035
  • Figure 114: Middle East & Africa Permeability Testing Machine Market Y-o-Y Growth Comparison by End User, 2025–2035
  • Figure 115: Middle East & Africa Permeability Testing Machine Market Attractiveness Analysis by End User
  • Figure 116: Global Permeability Testing Machine Market – Tier Structure Analysis
  • Figure 117: Global Permeability Testing Machine Market – Company Share Analysis
Dashboard
Dashboard
Dashboard
Dashboard
Dashboard
Dashboard

Full Research Suite comprises of:

Market outlook & trends analysis

Market outlook & trends analysis

Interviews & case studies

Interviews & case studies

Strategic recommendations

Strategic recommendations

Vendor profiles & capabilities analysis

Vendor profiles & capabilities analysis

5-year forecasts

5-year forecasts

8 regions and 60+ country-level data splits

8 regions and 60+ country-level data splits

Market segment data splits

Market segment data splits

12 months of continuous data updates

12 months of continuous data updates

DELIVERED AS:

PDF EXCEL ONLINE

Full Research Suite


$5000

$7500

$10000

Buy Report Now
Similar Industry Reports

Similar Industry Reports

Testing, Inspection & Certification Market

Testing, Inspection & Certification Market Growth – Trends & Forecast 2025 to 2035

5G Testing Market
5G Testing Market

5G Testing Market Size and Share Forecast Outlook 2025 to 2035

AB Testing Software Market

AB Testing Software Market Size and Share Forecast Outlook 2025 to 2035

5G Testing Equipment Market

5G Testing Equipment Market Analysis - Size, Growth, and Forecast 2025 to 2035

Eye Testing Equipment Market

Eye Testing Equipment Market Size and Share Forecast Outlook 2025 to 2035

HSV Testing Market
HSV Testing Market

HSV Testing Market Size and Share Forecast Outlook 2025 to 2035

IoT Testing Equipment Market

IoT Testing Equipment Market Size and Share Forecast Outlook 2025 to 2035

HPV Testing and Pap Test Market

HPV Testing and Pap Test Market Size and Share Forecast Outlook 2025 to 2035

GMO Testing Services Market

GMO Testing Services Market Insights – Food Safety & Regulatory Compliance 2024 to 2034

GMP Testing Services Market

GMP Testing Services Market

LTE Testing Equipment Market

LTE Testing Equipment Market Growth – Trends & Forecast 2019-2027

Drug Testing Systems Market

Drug Testing Systems Market Size and Share Forecast Outlook 2025 to 2035

Sand Testing Equipments Market

Sand Testing Equipments Market Size and Share Forecast Outlook 2025 to 2035

Self Testing Market
Self Testing Market

Self-Testing Market Analysis - Size, Share, and Forecast 2025 to 2035

Food Testing Services Market

Food Testing Services Market Size, Growth, and Forecast for 2025–2035

Soil Testing Market
Soil Testing Market

Soil Testing Market Growth - Trends & Forecast 2025 to 2035

Food Testing Services Market Share Analysis

Examining Food Testing Services Market Share & Industry Outlook

Self-Testing Market Share Analysis

Examining Market Trends in the Self-Testing Industry Share

Soil Testing Kit Market

Soil Testing Kit Market Growth - Trends & Forecast 2025 to 2035

CTNG Testing Market
CTNG Testing Market

Global CTNG Testing Market Analysis – Trends, Size & Forecast 2024-2034

Future Market Insights

Permeability Testing Machine Market

Chat With MaRIA

Chat With

MaRIA

Hi There, I am MaRIA, Your Market Research Intelligence Assistant. How may I help you?