

- Market Size (2026)
- USD 4.4 Bn
- Forecast (2036)
- USD 11.4 Bn
- CAGR (2026 to 2036)
- 10.0%
How big is Port & Container Terminal Automation Market in 2026?
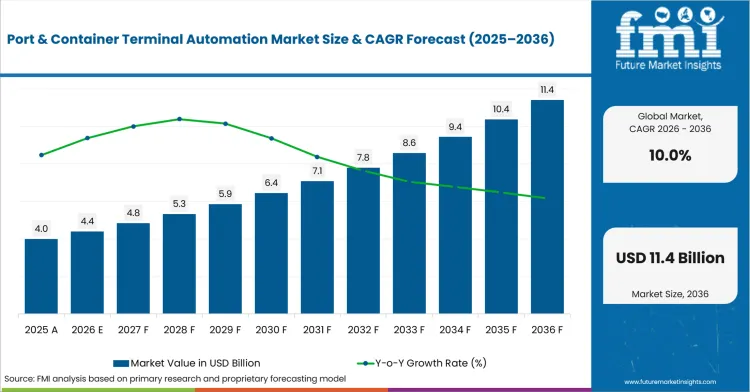
USD 4.4 billion in 2026 and USD 11.4 billion by 2036 at a 10.0% CAGR.
Demand for port & container terminal automation is projected to rise at a CAGR of 10.0% by 2036, driving industry valuation from USD 4.4 billion in 2026 to USD 11.4 billion during the forecast period.Expansion reflects a shift toward system-level reliability as trade volumes grow unevenly. For instance, UN Trade and Development reported in September 2025 that containerized trade was expected to expand 1.4% during 2025 despite weaker overall maritime growth of 0.5%. Terminals therefore need more dependable quay, yard and gate coordination instead of isolated machine speed. Investment in automated material handling equipment becomes commercially useful when software directs each lift toward a confirmed vessel, truck, or rail handoff.
Automation programmes take different forms across China and Europe because terminal age changes the investment problem. Chinese projects can standardize equipment and traffic lanes across newer capacity, whereas European terminals often integrate new controls around existing civil works and labour agreements. The World Bank reported in September 2025 that its 2024 Container Port Performance Index assessed 403 ports, showing how widely vessel time and operating consistency vary between sites. That variation helps explain why the USD 4.4 billion market includes selective retrofits beside complete terminal programmes. Procurement decisions increasingly test stacker crane systems against recovery procedures, interface ownership and throughput during live commissioning.
Key Takeaways of Port & Container Terminal Automation Market
- Demand for port and container terminal automation is driven by the cost of unreliable handoffs rather than crane speed alone, as vessel exchanges place several container moves into narrow berth windows requiring reserved yard space and retrieval paths.
- By component, equipment is expected to lead with 62.0% share in 2026, driven by the high capital cost of cranes, terminal vehicles, sensors, drives, and electrical power systems.
- Container yard operations are the dominant application segment, projected to hold 36.0% share in 2026, reflecting the yard's role in absorbing schedule mismatches between quay handling and inland transport.
- Automated stacking cranes are estimated to lead the equipment type category with 30.0% share in 2026, as container storage blocks require frequent and repeatable lift cycles during each vessel call.
- Software is expected to gain increasing commercial importance as growing installed fleets require enhanced dispatching and coordination across mixed-vendor systems over longer operating lifetimes.
- Latin America, South Korea, the European Union, and Japan are expected to lead growth at 11.0%, 10.5%, 9.5%, and 9.0% CAGR respectively, shaped by terminal age, cargo concentration, and equipment interface standardization.
- Competition centers on Kalmar, Konecranes, ABB Ports, and Künz, with vendors differentiating through equipment-neutral software layers, remote crane retrofit paths, electrical integration systems, and project-engineered gantry crane coordination.
Analyst Perspective
"Container terminal automation creates measurable value when every stage of cargo movement operates as a coordinated system rather than as isolated automated equipment. Port operators are increasingly assessing crane utilization, yard synchronization, and fleet coordination over sustained operating periods instead of peak performance during controlled trials. The next phase of investment will favor suppliers that minimize commissioning risk, establish clear accountability across integrated systems, and help terminals maximize productive operating time while maintaining uninterrupted vessel handling."
- Nikhil Kaitwade, Principal Analyst at Future Market Insights
How is the Port & Container Terminal Automation Market segmented?
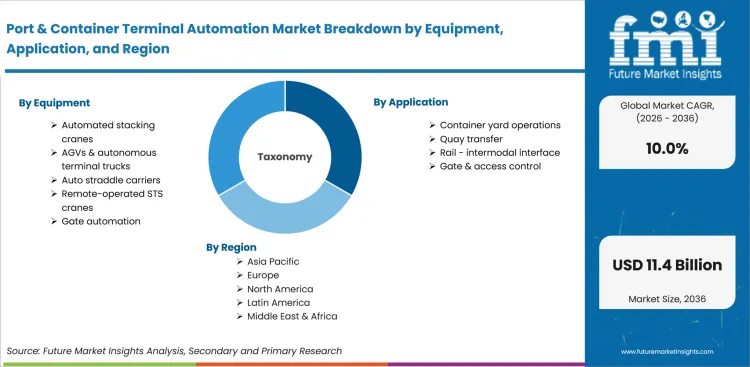
The port & container terminal automation industry is segmented by equipment, application, component, end-use, sales channel and region.
The segmentation follows the container journey from gate entry through yard storage and quay transfer across the terminal. Equipment includes automated stacking cranes, terminal vehicles, remote ship-to-shore cranes and access systems used in defined operating zones. Application separates yard work from quay transfer and rail exchange, with gate control treated as a distinct workflow. Component analysis distinguishes physical machines from the software and services required to integrate them with terminal plans.
End-use identifies the operating setting, whereas Sales Channel shows whether the programme is bought directly, integrated, retrofitted, or supported through aftermarket work. These distinctions prevent one automation purchase from representing every project type across the defined terminal automation market. The final comparison connects machine choice with AGV fleet management software and clear site responsibility.
What makes automated stacking cranes central to the equipment category?
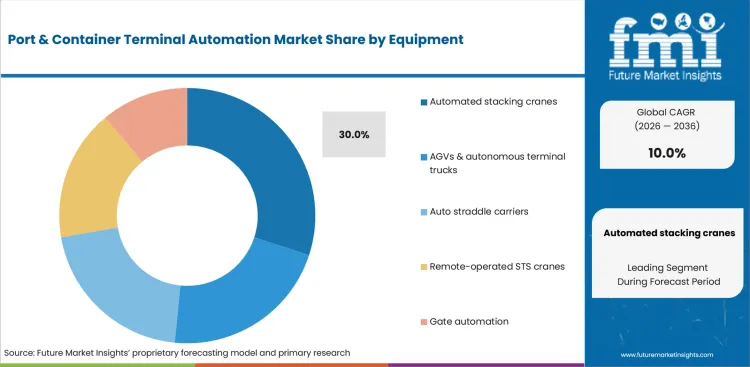
Automated stacking cranes organize storage blocks that must accept quay discharge and prepare later truck or rail retrieval. The Ministry of Oceans and Fisheries reported in January 2025 that South Korean ports handled 31.73 million TEU during 2024. That volume makes repeatable yard positioning commercially important at scale because one misplaced box can trigger extra lifts across several connected retrieval moves.
- In 2026, automated stacking cranes are projected to hold 30.0% share, owing to the repeated lifting needed inside dense storage blocks and the value of precise positioning. Marine crane controls become more useful as crane status reaches the yard plan ahead of the next task release.
- Container terminal operators favour automated stacking cranes for blocks with stable lane geometry and high retrieval pressure. Remote supervision lets one control room handle routine cycles and route difficult lifts to an operator. The purchasing decision therefore depends on block layout, recovery access and the quality of the terminal operating system interface.
How do container yard operations shape application demand?
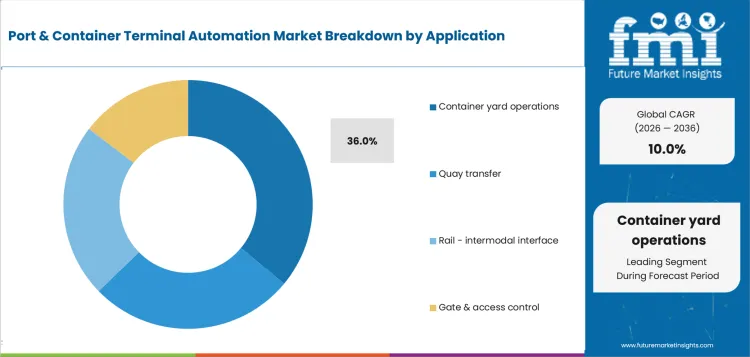
Container yards absorb timing differences between vessel discharge schedules and inland collection appointments across every storage block. Shanghai International Port Group reported in January 2025 that the Port of Shanghai handled 51.5 million TEU during 2024. A yard serving that scale cannot rely on visual memory or separate machine queues, because storage choices made during discharge determine later crane travel and truck waiting time.
- Based on application segment, container yard operations are forecast to represent 36.0% share in 2026, which reflects the yard's role as the terminal buffer between quay work and inland release. Automation has commercial value here because better stacking decisions reduce unproductive reshuffles and protect space for containers with earlier retrieval appointments.
- Terminals with mixed import, export and transshipment flows invest in yard automation to keep container identity tied to an achievable pickup sequence. Demand therefore extends beyond crane control into position confirmation, vehicle dispatch and exception recovery across the automated yard.
How is equipment positioned within the component category?
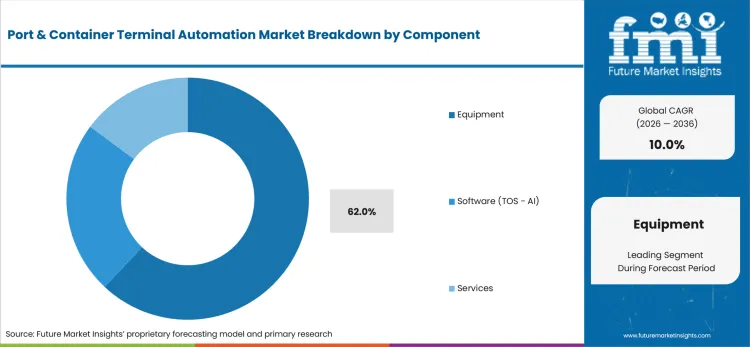
Physical equipment remains the main cost block because automated terminal assets must lift loaded containers outdoors for long operating periods. Konecranes announced in September 2025 that a Colombian container terminal ordered 25 rubber-tyred gantry cranes and ten remote-operation retrofits. The order shows how capital spending can combine new machines with conversion work across an existing yard without replacing every operating block.
- Equipment is estimated to account for 62.0% of Component demand in 2026. Cranes and terminal vehicles carry high structural, drive and power costs before software integration begins. Their long service lives make maintainability and retrofit access central to the investment case, especially at sites that cannot replace a complete fleet together.
- Port operators compare equipment packages through productive availability across the working week rather than purchase price alone. Automated machines need safe manual recovery, accessible maintenance zones and controls that remain supported across several software releases.
What are the drivers, restraints and opportunities in the Port & Container Terminal Automation Market?
Vessel exchange peaks support coordinated automation. Brownfield interfaces extend commissioning risk. Equipment-neutral control creates a phased investment route.
- Driver: Larger vessel exchanges and safety goals support remote operation, planned vehicle dispatch and repeatable yard cycles across connected terminal zones.
- Restraint: Existing civil layouts, mixed equipment generations and operational technology security can extend testing without allowing vessel service to stop.
- Opportunity: Equipment-neutral software and retrofit controls let terminals automate selected workflows before committing capital to a complete fleet replacement.
Larger vessel exchanges concentrate work into short berth windows, so terminals need cranes and transfer vehicles to follow one operating plan. Kalmar introduced Automation as a Service in June 2025 for marine container terminals and intermodal sites. The offer places automation software and operating support within a recurring service structure, which lowers the need for one large initial programme. Reliable time-controlled industrial networks remain important because dispatch instructions must reach connected equipment without uncertain delay.
Brownfield terminals face a different problem because old controls, power systems and traffic lanes cannot be replaced together. The European Commission confirmed in October 2024 that transport entities covered by the NIS2 framework must manage cyber risk and report significant incidents. Connected cranes and gates therefore require protected maintenance access beside recovery procedures that preserve safe terminal service. A weak interface can delay commissioning or force the terminal to retain parallel manual processes longer than planned.
Phased retrofit programmes create a practical opening for ports with durable machines and limited shutdown windows. Position sensors, remote operating stations and shared dispatch rules can be introduced block by block after interface testing. digital operator training systems let teams rehearse faults and peak vessel exchanges before changes reach live equipment. The opportunity is commercially relevant for providers that define responsibility across software, controls and field service instead of leaving the terminal to resolve failures between separate contracts.
Which country CAGRs are profiled in the Port & Container Terminal Automation Market?
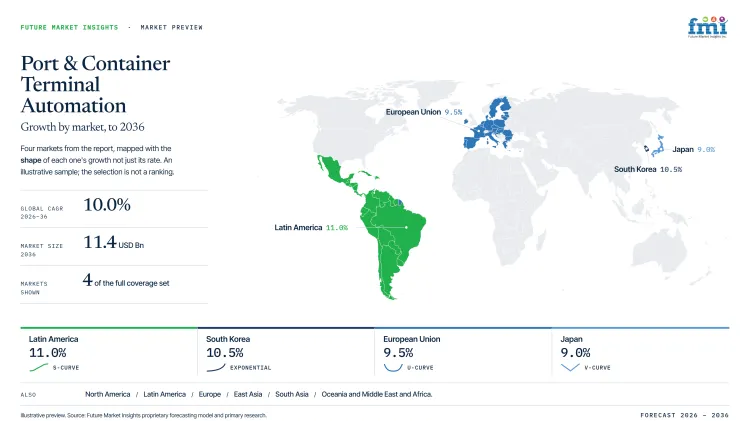
| Country | CAGR |
|---|---|
| Latin America | 11.0% |
| South Korea | 10.5% |
| European Union | 9.5% |
| Japan | 9.0% |
Source: FMI's proprietary forecasting model and primary research
How do country-level CAGRs compare in the Port & Container Terminal Automation Market?
The comparison spans 2.0 percentage points across the port & container terminal automation market. Latin America records the highest CAGR at 11.0%, followed by South Korea at 10.5%, the European Union at 9.5% and Japan at 9.0%. The narrow range indicates that terminal automation is advancing across all four markets, although investment priorities differ by port infrastructure and cargo handling requirements.
- Latin America leads with a CAGR of 11.0%. Port operators are investing in automated container handling, terminal management systems and equipment modernization to improve vessel turnaround, increase yard efficiency and support higher container throughput.
- South Korea follows at 10.5%, only 0.5 percentage points below Latin America. Terminal operators continue integrating automated cranes, autonomous transport equipment and digital control systems to improve operational coordination across container terminals.
- The European Union records a CAGR of 9.5%, 1.0 percentage point behind South Korea. Automation projects focus on improving container movement, terminal productivity and logistics coordination. Deployment varies among member states because port capacity, infrastructure investment and modernization schedules are not uniform.
- Japan posts a CAGR of 9.0%, 0.5 percentage points below the European Union. Investment is directed toward automated terminal operations that improve cargo handling efficiency, optimize equipment utilization and support reliable container movement within busy port facilities.
Comparable CAGRs do not indicate identical market conditions. Differences in port infrastructure, container traffic, automation strategies and capital investment priorities influence implementation timelines and long-term commercial opportunities. The full report provides country-level CAGR analysis across North America, Latin America, Europe, East Asia, South Asia, Oceania and the Middle East and Africa.
Country-wise Analysis
- Latin American gateway ports often add capacity through concessions that combine civil work with imported cranes and local operating requirements. The regional outlook is forecast at 11.0% CAGR during the forecast period as container terminals modernize without assuming unlimited land for expansion. Santos Port Authority reported in January 2025 that the Port of Santos handled 5.485 million TEU during 2024. The volume shows why yard density and gate scheduling matter at a port serving several private terminals along one channel. Integrators gain a useful role by coordinating equipment delivery with power, data and commissioning responsibilities. Supplier selection therefore depends on regional service coverage and a transition plan that protects cargo flow during construction.
- South Korean transshipment hubs manage concentrated vessel exchanges that leave little room for inconsistent handoffs between quay cranes and yard blocks. Demand is estimated to rise at 10.5% CAGR from 2026 to 2036 for terminal automation demand in South Korea. The Ministry of Oceans and Fisheries reported in January 2025 that Busan handled 24.4 million TEU during 2024. That concentration rewards accurate yard planning and stable control-room procedures during peak vessel exchanges at Busan. Equipment providers must demonstrate recovery performance under dense traffic rather than present an isolated cycle-time claim.
- European Union terminals include established automated sites beside older city ports with fixed quay walls and limited construction space. Port and container terminal automation in the European Union is projected to record 9.5% CAGR from 2026 to 2036. The Port of Rotterdam reported in February 2025 that its terminals handled 13.8 million TEU during 2024. Large volumes at mature sites make phased control upgrades more practical than broad equipment replacement. Workforce consultation, cyber duties and energy planning affect how quickly each programme can enter live service. Providers with clear interface ownership and local commissioning capacity can reduce the commercial risk attached to long brownfield transitions.
- Japanese terminals place a high value on service reliability as labour availability tightens across transport and maintenance roles. The industry in Japan is projected to rise at 9.0% CAGR from by 2036, reflecting measured adoption across established facilities. The World Bank reported in September 2025 that container calls requiring fewer than 500 moves averaged 11.5 hours at Japanese ports in its 2024 performance data. The figure indicates that automation must protect an existing operating discipline rather than create disruption during conversion. Projects are therefore likely to favour remote assistance, staged machine functions and clear manual recovery. Long-term confidence depends on dependable local service and controls that can be maintained across extended equipment lives.
Who are the notable companies in the Port & Container Terminal Automation Market?
Kalmar, Konecranes, ABB Ports and Künz are notable companies serving port and container terminal automation.
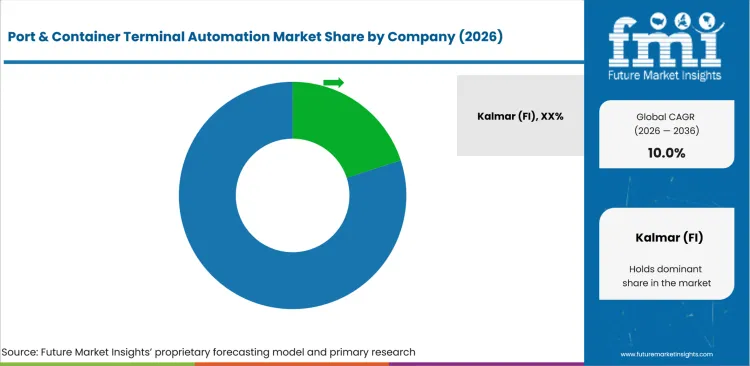
Competition spans terminal vehicles and yard cranes beside control systems, remote operating rooms and terminal-wide software. Kalmar combines equipment with fleet orchestration, whereas Konecranes places more emphasis on crane automation and retrofit paths. ABB Ports supplies control, sensing and electrical integration through several crane delivery routes, whereas Künz contributes project-engineered stacking and intermodal gantry cranes for defined terminal layouts. Terminals compare these offers through productive availability, interface responsibility and lifecycle support across the complete operating chain. proactive maintenance software adds value when equipment condition can be linked to an achievable maintenance window instead of a generic alert.
- Kalmar and Konecranes address broad terminal equipment needs through distinct combinations of machines, controls and lifecycle services. Kalmar connects mobile equipment with fleet software, whereas Konecranes combines yard cranes with remote and automated functions. Their commercial relevance depends on how clearly each programme assigns responsibility for machines, controls, software and field service.
- ABB Ports and Künz address different parts of crane automation through control integration and project-engineered equipment. ABB Ports provides crane controls and remote operator rooms for several crane builders, whereas Künz designs automated stacking and gantry cranes for terminal-specific layouts. A shared project can work well when interface duties remain explicit through commissioning and later upgrades.
- Kalmar One and ABB control layers support coordination across equipment supplied by several manufacturers within one terminal. OPC UA controller links can support that approach by giving industrial controls a more consistent exchange method. The commercial test is safe degraded operation, because a terminal must preserve limited service during a connection or software fault.
Competitive Benchmarking: Port & Container Terminal Automation Market
| Company | Terminal Equipment | Crane Automation | Fleet Software | Brownfield Integration | Geographic Reach |
|---|---|---|---|---|---|
| Kalmar | High | High | High | High | High |
| Konecranes | High | High | Medium | High | High |
| ABB Ports | Low | High | High | High | High |
| Künz | Medium | High | Low | Medium | Medium |
Source: Future Market Insights competitive analysis, 2026. Ratings reflect verified portfolio relevance to port and container terminal automation.
Key Developments in the Port & Container Terminal Automation Market
- In February 2025, Künz announced an order from ÖBB for five automatic gantry cranes with remote operating stations at TSA INFRA terminals in Vienna South, Wels, and Wolfurt. The project connects automated crane cycles with operator supervision across intermodal container handling and scheduled rail work.
- In May 2025, Kalmar made Kalmar One available as standalone equipment-neutral terminal automation software for marine and intermodal terminal programmes. The release gives ports a route to coordinate mixed equipment without tying the operating layer to one new machine order.
- In September 2025, Transnet Port Terminals introduced the first nine units from a twenty-five-crane rubber-tyred gantry programme at Cape Town Container Terminal. The cranes include anti-sway controls and camera systems that support safer load handling in high winds.
Key Players in the Port & Container Terminal Automation Market
Terminal Equipment and Fleet Control
- Kalmar
Crane Automation and Remote Operation
- Konecranes
- ABB Ports
Automated Yard Crane Engineering
- Künz
Port & Container Terminal Automation Market - Report Scope
| Coverage Field | Report Scope |
|---|---|
| Market Breakdown | Equipment, application, component, end-use, sales channel and region. |
| Quantitative Units | Revenue in USD Million, CAGR in %. |
| Market Definition | Automation equipment, controls, software and services that direct container movement within marine and inland terminal workflows. |
| Regions Covered | North America, Latin America, Europe, East Asia, South Asia, Oceania and Middle East and Africa. |
| Countries Covered | China, Japan, South Korea, major European countries, Brazil, Mexico, the United States, Canada, India and selected regional economies. |
| Companies Profiled | Kalmar, Konecranes, ABB Ports and Künz. |
| Forecast Period | 2026 to 2036. |
| Approach | Equipment and project mapping combined with aggregate terminal spending analysis, primary interviews and official desk research. |
Source: Future Market Insights analysis based on proprietary forecasting models and primary research
Port & Container Terminal Automation Market - Research Methodology
| Method | Approach |
|---|---|
| Primary Research | FMI analysts gathered input from manufacturers, service providers, technology developers, distributors, end users, procurement teams, and subject-matter experts. Interviews examined purchasing decisions, product or service evaluation, adoption barriers, approval requirements, pricing considerations, and expectations for technical or commercial support. Respondents were also asked what evidence is required before a trial, pilot, or initial order develops into regular purchasing. |
| Desk Research | Desk research covered government statistics, regulatory publications, trade data, industry associations, technical literature, standards, company filings, product information, and official corporate announcements. Sources were reviewed for relevance, publication date, geographic coverage, and consistency with the defined market scope. Claims relating to performance, applications, approvals, capacity, investment, and commercial activity were retained only when supported by credible public evidence. |
| Market Sizing and Forecasting | The market model combined the baseline value with historical performance, segment structure, pricing and volume indicators, adoption levels, company participation, and country-level demand conditions. Forecast assumptions considered economic activity, investment trends, regulatory developments, technology adoption, purchasing cycles, supply availability, and barriers to wider market use. Segment and regional estimates were reconciled before the final market total was calculated. |
| Data Validation | Estimates were checked against multiple independent indicators, including public data, company activity, trade patterns, industry developments, and findings from primary interviews. Validation also tested whether products, services, applications, and company revenues fell within the defined market boundaries. Adjacent categories, unsupported claims, overlapping revenues, and activities without direct market relevance were excluded to reduce double counting and maintain consistency across segments and countries. |
Port & Container Terminal Automation Market by Segments
Port & Container Terminal Automation Market segmented by Equipment:
- Automated Stacking Cranes
- AGVs and Autonomous Terminal Trucks
- Automated Straddle Carriers
- Remote-Operated Ship-to-Shore Cranes
- Gate Automation Systems
Port & Container Terminal Automation Market segmented by Application:
- Container Yard Operations
- Quay Transfer
- Rail and Intermodal Interface
- Gate and Access Control
Port & Container Terminal Automation Market segmented by Component:
- Equipment
- Software, Terminal Operating Systems and AI
- Services
Port & Container Terminal Automation Market segmented by End-use:
- Container Terminals
- Bulk Terminals
- Intermodal Yards
- Ro-Ro Terminals
Port & Container Terminal Automation Market segmented by Sales Channel:
- Direct
- EPC and Integrators
- Retrofit Programmes
- Aftermarket
Port & Container Terminal Automation Market by Region:
- North America
- United States
- Canada
- Latin America
- Brazil
- Mexico
- Argentina
- Europe
- Germany
- United Kingdom
- France
- Italy
- Spain
- East Asia
- China
- Japan
- South Korea
- South Asia
- India
- Thailand
- Indonesia
- Oceania
- Australia
- New Zealand
- Middle East and Africa
- GCC Countries
- South Africa
- Türkiye
Research Sources and Bibliography
- UN Trade and Development. (2025, September). Review of Maritime Transport 2025. UNCTAD.
- World Bank. (2025, September). The Container Port Performance Index 2020 to 2024: Trends and Lessons Learned. World Bank.
- Ministry of Transport of the People's Republic of China. (2025, January). National port cargo and container throughput statistics for 2024. Ministry of Transport.
- Shanghai International Port Group. (2025, January). Shanghai Port container throughput results for 2024. Shanghai International Port Group.
- Santos Port Authority. (2025, January). Port of Santos operating statistics for 2024. Federal Government of Brazil.
- Ministry of Oceans and Fisheries. (2025, January). Korea's ports handle record-high container volume of 31.73 million TEUs in 2024. Government of the Republic of Korea.
- Port of Rotterdam Authority. (2025, February). Port of Rotterdam throughput results for 2024. Port of Rotterdam Authority.
- European Commission. (2024, October). NIS2 Directive implementation and obligations for transport entities. European Commission.
- Konecranes. (2025, September). Major Colombian container terminal extends its Konecranes-led yard modernization. Konecranes.
- Kalmar. (2025, June). Kalmar introduces Automation as a Service. Kalmar.
- Künz. (2025, February). Major contract for automatic gantry cranes at TSA INFRA terminals. Künz.
- Kalmar. (2025, July). Kalmar One now available as standalone software solution. Kalmar.
- APM Terminals. (2025, September). Rijeka Gateway begins commercial operations. APM Terminals.
- Transnet Port Terminals. (2025, September). First new rubber-tyred gantry cranes introduced at Cape Town Container Terminal. Transnet.
This bibliography is provided for reader reference and uses primary government, standards-body, official trade body and company sources.
This Report Answers
- What market value is estimated for 2026 and 2036?
- What CAGR is projected from 2026 to 2036?
- Why do automated stacking cranes account for 30.0% of Equipment demand in 2026?
- How do container yard operations shape Application spending?
- Which operating risks extend brownfield automation schedules?
- How do country growth rates differ across China, Latin America, South Korea, the European Union and Japan?
- Which verified companies supply terminal equipment, crane automation and fleet control?
- How should operators compare mixed-fleet software and equipment packages?
- What research approach supports the market forecast and company mapping?
Frequently Asked Questions
What is driving growth in the Port & Container Terminal Automation Market?
Vessel exchange peaks and safety goals are increasing demand for coordinated crane, yard and gate control. Staged retrofits let operating terminals improve selected workflows without stopping the complete site.
Who are the key players in the Port & Container Terminal Automation Market?
Kalmar, Konecranes, ABB Ports and Künz are verified participants in terminal automation. Their roles differ across equipment, crane controls, fleet software, remote operation and project engineering.
What is a notable restraint in the Port & Container Terminal Automation Market?
Brownfield integration can extend commissioning because old controls and traffic lanes must remain operational. Cybersecurity and recovery procedures add further work across connected cranes, gates and software.
Why should executives track the Port & Container Terminal Automation Market?
Terminal automation changes how ports convert expensive equipment into dependable capacity across a working week. The market therefore affects berth reliability, labour exposure, maintenance planning and capital timing.
What business problem does the Port & Container Terminal Automation Market address?
The market addresses delays created by poorly coordinated container handoffs between quay, yard, gate and inland transport. Automation aligns equipment tasks with one operating plan and clearer recovery rules.
What should procurement teams evaluate in the Port & Container Terminal Automation Market?
Procurement teams should compare productive availability, interface ownership, recovery time and local service support. A lower equipment price provides limited value if commissioning disrupts vessel service or leaves software responsibility unclear.
What limits return on investment in the Port & Container Terminal Automation Market?
Weak interface design can leave automated machines waiting for tasks and reduce the expected throughput gain. Extended testing, parallel manual processes and poor maintenance access can delay the financial return.
What supports long-term commercial confidence in the Port & Container Terminal Automation Market?
Confidence grows through stable operation during peak exchanges and documented recovery from equipment or software faults. Clear lifecycle support gives terminals a practical basis for expanding automation across additional blocks.
Preview the report firsthand - request a free sample
Get SampleGet the brochure for pricing and purchase details.
Get PDFTable of Content
- Key Takeaways
- Market Size and CAGR
- Top Growth Driver
- Fastest Growing Segment
- Leading Region
- Key Companies
- Emerging Opportunities
- Executive Summary
- Global Market Outlook
- Demand-side Trends
- Supply-side Trends
- Technology Roadmap Analysis
- Analysis and Recommendations
- Analyst Perspective (What is happening? Why now? What should investors know?)
- Key Questions Answered
- How large is the market?
- What is the CAGR?
- What are key trends?
- Which region dominates?
- Who are the leaders?
- Market Overview
- Market Coverage / Taxonomy
- Market Definition / Scope / Limitations
- Research Methodology
- Chapter Orientation
- Analytical Lens and Working Hypotheses
- Market Structure, Signals, and Trend Drivers
- Benchmarking and Cross-market Comparability
- Market Sizing, Forecasting, and Opportunity Mapping
- Research Design and Evidence Framework
- Desk Research Programme (Secondary Evidence)
- Expert Input and Fieldwork (Primary Evidence)
- Tooling, Models, and Reference Databases
- Data Engineering and Model Build
- Quality Assurance and Audit Trail
- Market Background
- Market Dynamics (Drivers, Restraints, Opportunity, Trends)
- Scenario Forecast (Optimistic, Likely, Conservative)
- Impact Analysis
- AI Impact
- Sustainability Impact
- Regulatory Impact
- Technology Impact
- Consumer / Buyer Analysis
- Purchase Drivers
- Adoption Barriers
- Buyer Journey
- Opportunity Map Analysis
- Product Life Cycle Analysis
- Supply Chain Analysis
- Investment Feasibility Matrix
- Value Chain Analysis
- PESTLE and Porter's Analysis
- Regulatory Landscape
- Regional Parent Market Outlook
- Production and Consumption Statistics
- Import and Export Statistics
- Global Market Analysis and Forecast, 2021 to 2036
- Historical Market Size Value (USD Bn) Analysis, 2021 to 2025
- Current and Future Market Size Value (USD Bn) Projections, 2026 to 2036
- Y-o-Y Growth Trend Analysis
- Absolute $ Opportunity Analysis
- Global Market Pricing Analysis, 2021 to 2036
- Global Market Analysis and Forecast, By Equipment, 2021 to 2036
- Introduction / Key Findings
- Historical Market Size Value (USD Bn) Analysis By Equipment, 2021 to 2025
- Current and Future Market Size Value (USD Bn) Analysis and Forecast By Equipment, 2026 to 2036
- Automated stacking cranes
- AGVs & autonomous terminal trucks
- Auto straddle carriers
- Remote-operated STS cranes
- Gate automation
- Automated stacking cranes
- Y-o-Y Growth Trend Analysis By Equipment, 2021 to 2025
- Absolute $ Opportunity Analysis By Equipment, 2026 to 2036
- Global Market Analysis and Forecast, By Application, 2021 to 2036
- Introduction / Key Findings
- Historical Market Size Value (USD Bn) Analysis By Application, 2021 to 2025
- Current and Future Market Size Value (USD Bn) Analysis and Forecast By Application, 2026 to 2036
- Container yard operations
- Quay transfer
- Rail - intermodal interface
- Gate & access control
- Container yard operations
- Y-o-Y Growth Trend Analysis By Application, 2021 to 2025
- Absolute $ Opportunity Analysis By Application, 2026 to 2036
- Global Market Analysis and Forecast, By Component, 2021 to 2036
- Introduction / Key Findings
- Historical Market Size Value (USD Bn) Analysis By Component, 2021 to 2025
- Current and Future Market Size Value (USD Bn) Analysis and Forecast By Component, 2026 to 2036
- Equipment
- Software (TOS - AI)
- Services
- Equipment
- Y-o-Y Growth Trend Analysis By Component, 2021 to 2025
- Absolute $ Opportunity Analysis By Component, 2026 to 2036
- Global Market Analysis and Forecast, By End-use, 2021 to 2036
- Introduction / Key Findings
- Historical Market Size Value (USD Bn) Analysis By End-use, 2021 to 2025
- Current and Future Market Size Value (USD Bn) Analysis and Forecast By End-use, 2026 to 2036
- Container terminals
- Bulk terminals
- Intermodal yards
- Ro-Ro terminals
- Container terminals
- Y-o-Y Growth Trend Analysis By End-use, 2021 to 2025
- Absolute $ Opportunity Analysis By End-use, 2026 to 2036
- Global Market Analysis and Forecast, By Sales Channel, 2021 to 2036
- Introduction / Key Findings
- Historical Market Size Value (USD Bn) Analysis By Sales Channel, 2021 to 2025
- Current and Future Market Size Value (USD Bn) Analysis and Forecast By Sales Channel, 2026 to 2036
- Direct
- EPC - integrators
- Retrofit programs
- Aftermarket
- Direct
- Y-o-Y Growth Trend Analysis By Sales Channel, 2021 to 2025
- Absolute $ Opportunity Analysis By Sales Channel, 2026 to 2036
- Global Market Analysis and Forecast, By Region, 2021 to 2036
- Introduction
- Historical Market Size Value (USD Bn) Analysis By Region, 2021 to 2025
- Current Market Size Value (USD Bn) Analysis and Forecast By Region, 2026 to 2036
- North America
- Latin America
- Western Europe
- Eastern Europe
- East Asia
- South Asia and Pacific
- Middle East & Africa
- Market Attractiveness Analysis By Region
- North America Market Analysis and Forecast, By Country, 2021 to 2036
- Historical Market Size Value (USD Bn) Trend Analysis By Market Taxonomy, 2021 to 2025
- Market Size Value (USD Bn) Forecast By Market Taxonomy, 2026 to 2036
- By Country
- USA
- Canada
- By Equipment
- By Application
- By Component
- By End-use
- By Sales Channel
- By Country
- Market Attractiveness Analysis
- By Country
- By Equipment
- By Application
- By Component
- By End-use
- By Sales Channel
- Key Takeaways
- Latin America Market Analysis and Forecast, By Country
- Historical Market Size Value (USD Bn) Trend Analysis By Market Taxonomy, 2021 to 2025
- Market Size Value (USD Bn) Forecast By Market Taxonomy, 2026 to 2036
- By Country
- Brazil
- Mexico
- Chile
- Rest of Latin America
- By Equipment
- By Application
- By Component
- By End-use
- By Sales Channel
- By Country
- Market Attractiveness Analysis
- By Country
- By Equipment
- By Application
- By Component
- By End-use
- By Sales Channel
- Key Takeaways
- Western Europe Market Analysis and Forecast, By Country
- Historical Market Size Value (USD Bn) Trend Analysis By Market Taxonomy, 2021 to 2025
- Market Size Value (USD Bn) Forecast By Market Taxonomy, 2026 to 2036
- By Country
- Germany
- UK
- Italy
- Spain
- France
- Nordic
- BENELUX
- Rest of Western Europe
- By Equipment
- By Application
- By Component
- By End-use
- By Sales Channel
- By Country
- Market Attractiveness Analysis
- By Country
- By Equipment
- By Application
- By Component
- By End-use
- By Sales Channel
- Key Takeaways
- Eastern Europe Market Analysis and Forecast, By Country
- Historical Market Size Value (USD Bn) Trend Analysis By Market Taxonomy, 2021 to 2025
- Market Size Value (USD Bn) Forecast By Market Taxonomy, 2026 to 2036
- By Country
- Russia
- Poland
- Hungary
- Balkan & Baltic
- Rest of Eastern Europe
- By Equipment
- By Application
- By Component
- By End-use
- By Sales Channel
- By Country
- Market Attractiveness Analysis
- By Country
- By Equipment
- By Application
- By Component
- By End-use
- By Sales Channel
- Key Takeaways
- East Asia Market Analysis and Forecast, By Country
- Historical Market Size Value (USD Bn) Trend Analysis By Market Taxonomy, 2021 to 2025
- Market Size Value (USD Bn) Forecast By Market Taxonomy, 2026 to 2036
- By Country
- China
- Japan
- South Korea
- By Equipment
- By Application
- By Component
- By End-use
- By Sales Channel
- By Country
- Market Attractiveness Analysis
- By Country
- By Equipment
- By Application
- By Component
- By End-use
- By Sales Channel
- Key Takeaways
- South Asia and Pacific Market Analysis and Forecast, By Country
- Historical Market Size Value (USD Bn) Trend Analysis By Market Taxonomy, 2021 to 2025
- Market Size Value (USD Bn) Forecast By Market Taxonomy, 2026 to 2036
- By Country
- India
- ASEAN
- Australia & New Zealand
- Rest of South Asia and Pacific
- By Equipment
- By Application
- By Component
- By End-use
- By Sales Channel
- By Country
- Market Attractiveness Analysis
- By Country
- By Equipment
- By Application
- By Component
- By End-use
- By Sales Channel
- Key Takeaways
- Middle East & Africa Market Analysis and Forecast, By Country
- Historical Market Size Value (USD Bn) Trend Analysis By Market Taxonomy, 2021 to 2025
- Market Size Value (USD Bn) Forecast By Market Taxonomy, 2026 to 2036
- By Country
- Kingdom of Saudi Arabia
- Other GCC Countries
- Türkiye
- South Africa
- Other African Union
- Rest of Middle East & Africa
- By Equipment
- By Application
- By Component
- By End-use
- By Sales Channel
- By Country
- Market Attractiveness Analysis
- By Country
- By Equipment
- By Application
- By Component
- By End-use
- By Sales Channel
- Key Takeaways
- Key Countries Market Analysis
- USA
- Pricing Analysis
- Market Share Analysis, 2025
- By Equipment
- By Application
- By Component
- By End-use
- By Sales Channel
- Canada
- Pricing Analysis
- Market Share Analysis, 2025
- By Equipment
- By Application
- By Component
- By End-use
- By Sales Channel
- Mexico
- Pricing Analysis
- Market Share Analysis, 2025
- By Equipment
- By Application
- By Component
- By End-use
- By Sales Channel
- Brazil
- Pricing Analysis
- Market Share Analysis, 2025
- By Equipment
- By Application
- By Component
- By End-use
- By Sales Channel
- Chile
- Pricing Analysis
- Market Share Analysis, 2025
- By Equipment
- By Application
- By Component
- By End-use
- By Sales Channel
- Germany
- Pricing Analysis
- Market Share Analysis, 2025
- By Equipment
- By Application
- By Component
- By End-use
- By Sales Channel
- UK
- Pricing Analysis
- Market Share Analysis, 2025
- By Equipment
- By Application
- By Component
- By End-use
- By Sales Channel
- Italy
- Pricing Analysis
- Market Share Analysis, 2025
- By Equipment
- By Application
- By Component
- By End-use
- By Sales Channel
- Spain
- Pricing Analysis
- Market Share Analysis, 2025
- By Equipment
- By Application
- By Component
- By End-use
- By Sales Channel
- France
- Pricing Analysis
- Market Share Analysis, 2025
- By Equipment
- By Application
- By Component
- By End-use
- By Sales Channel
- India
- Pricing Analysis
- Market Share Analysis, 2025
- By Equipment
- By Application
- By Component
- By End-use
- By Sales Channel
- ASEAN
- Pricing Analysis
- Market Share Analysis, 2025
- By Equipment
- By Application
- By Component
- By End-use
- By Sales Channel
- Australia & New Zealand
- Pricing Analysis
- Market Share Analysis, 2025
- By Equipment
- By Application
- By Component
- By End-use
- By Sales Channel
- China
- Pricing Analysis
- Market Share Analysis, 2025
- By Equipment
- By Application
- By Component
- By End-use
- By Sales Channel
- Japan
- Pricing Analysis
- Market Share Analysis, 2025
- By Equipment
- By Application
- By Component
- By End-use
- By Sales Channel
- South Korea
- Pricing Analysis
- Market Share Analysis, 2025
- By Equipment
- By Application
- By Component
- By End-use
- By Sales Channel
- Russia
- Pricing Analysis
- Market Share Analysis, 2025
- By Equipment
- By Application
- By Component
- By End-use
- By Sales Channel
- Poland
- Pricing Analysis
- Market Share Analysis, 2025
- By Equipment
- By Application
- By Component
- By End-use
- By Sales Channel
- Hungary
- Pricing Analysis
- Market Share Analysis, 2025
- By Equipment
- By Application
- By Component
- By End-use
- By Sales Channel
- Kingdom of Saudi Arabia
- Pricing Analysis
- Market Share Analysis, 2025
- By Equipment
- By Application
- By Component
- By End-use
- By Sales Channel
- Türkiye
- Pricing Analysis
- Market Share Analysis, 2025
- By Equipment
- By Application
- By Component
- By End-use
- By Sales Channel
- South Africa
- Pricing Analysis
- Market Share Analysis, 2025
- By Equipment
- By Application
- By Component
- By End-use
- By Sales Channel
- USA
- Market Structure Analysis
- Competition Dashboard
- Competition Benchmarking
- Market Share Analysis of Top Players
- By Regional
- By Equipment
- By Application
- By Component
- By End-use
- By Sales Channel
- Emerging Startups
- Innovation Benchmarking
- Competition Analysis
- Competition Deep Dive
- Kalmar (FI)
- Overview
- Product Portfolio
- Profitability by Market Segments
- Sales Footprint
- Strategy Overview
- Marketing Strategy
- Product Strategy
- Channel Strategy
- Konecranes (FI)
- ABB Ports (CH)
- Künz (AT)
- Kalmar (FI)
- Case Studies
- Success Stories
- Recent Developments
- Competition Deep Dive
- Assumptions & Acronyms Used


