
- Market Size (2026)
- USD 252.9 Mn
- Forecast (2036)
- USD 502.2 Mn
- CAGR (2026 to 2036)
- 7.1%
How Big is the Potato Bread & Rolls Market in 2026?
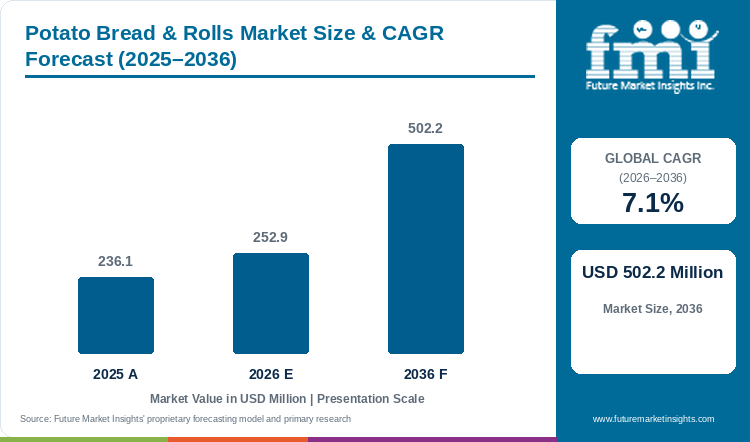
Potato bread and roll sales are valued at USD 252.9 Million in 2026, against USD 236.1 Million in 2025.
The potato bread & rolls market is valued at USD 252.9 Million in 2026 and is forecast to reach USD 502.2 Million by 2036 at a 7.1% CAGR, compared with USD 236.1 Million in 2025. Defra reports that UK household bread purchases averaged 439 grams per person per week in the financial year ending 2025 and fell 1.7% over the year. In a market where bread purchases per person are falling, potato loaves need to win a larger share of the purchases households already make.
Restaurant demand offers potato rolls a separate route to growth. Food away from home accounted for 56.3% of USA food spending in 2025. Burger and sandwich menus give bakers an opportunity to replace conventional buns within meals customers already order. Suppliers of bakery ingredients and finished rolls need to show that a potato recipe improves the finished meal enough to justify its cost. The bun must also fit the kitchen’s normal slicing and filling process so that adopting it does not add preparation work.
Key Takeaways of Potato Bread & Rolls Market
- The potato bread & rolls market is valued at USD 252.9 Million in 2026 and is forecast to grow at a 7.1% CAGR through 2036.
- Classic / original will lead product type at 38.0% in 2026 as shoppers and restaurants can use its mild taste across familiar meals.
- Conventional will hold 52.0% of claim / nature sales in 2026. Organic and other specialist claims add sourcing or labeling work.
- Fresh will lead format with a 35.0% share in 2026 because shoppers can judge softness when they buy the bread.
- Bakers must balance crumb softness with slice integrity. Shelf life and pack price also affect purchasing.
- FMI profiles Grupo Bimbo and Flowers Foods alongside Aryzta and Lantmannen Unibake. Vandemoortele and Yamazaki Baking are also covered. The group includes Warburtons and King’s Hawaiian as well as Europastry and St Pierre Groupe.
Analyst Perspective
“Potato buns will earn repeat restaurant orders when they stay soft and hold together during service. Retail buyers will also watch shelf life and the price per pack.”
- Nandini Roy Choudhury, Principal Consultant, Future Market Insights
How is the Potato Bread & Rolls Market Segmented?
FMI segments the potato bread & rolls market by product type, claim / nature, format, packaging format, sales channel and region.
Product type covers classic / original, whole grain & seeded, flavored & filled, mini & snacking formats, and premium / artisan.
Claim / nature covers conventional, clean label, organic, gluten-free, and high-protein / fortified.
Format covers fresh, frozen, ambient packaged, chilled, and par-baked / thaw-and-serve.
Packaging format covers multipack, single-serve, family / loaf pack, and bulk foodservice.
Sales channel covers supermarkets & hypermarkets, artisan & specialty bakeries, convenience & forecourt, online & DTC, and foodservice distributors.
What Makes Classic / Original Central to the Product Type Category?
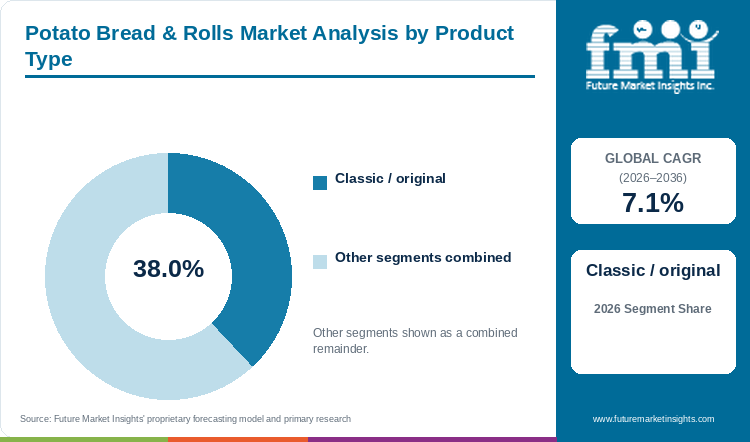
Classic / original is expected to hold 38.0% of product type market share in 2026.
Classic / original will remain the largest product type because it fits the most meal uses. Its mild taste leaves room for burger fillings and sandwich spreads. Bakers can work on crumb softness and bun strength without the added cost of seeds or fillings.
- Classic / original will hold a 38.0% share of product type revenue in 2026, led by routine household and foodservice use.
- Lantmannen Unibake announced a new bread facility in May 2025 [11]. Its existing Örebro site produces more than two million hot dog and burger buns a day. This scale shows the volume suppliers may need to serve large foodservice accounts.
Why Does Conventional Remain the Leading Claim / Nature Category?
Conventional is expected to account for 52.0% of claim / nature market share in 2026.
Conventional potato bread will reach the widest set of buyers because it does not need a special claim. Clean label bread and organic versions can command attention on the shelf. They also require tighter ingredient checks or certification. Large retail and restaurant accounts will usually test taste and price before adding those claims.
- Conventional will take 52.0% of claim / nature sales in 2026 as its recipe can serve mainstream retail and foodservice buyers.
- The FDA confirmed in February 2025 that its updated healthy-claim rule would take effect on April 28, 2025 [1]. A bakery using the claim has to meet the relevant food-group and nutrient conditions. This adds recipe work beyond a conventional potato roll.
What Keeps Fresh at the Center of the Format Category?
Fresh is expected to hold 35.0% of format market share in 2026.
Fresh potato bread lets shoppers judge the crumb before the product spends weeks in storage. Fresh distribution will favor suppliers that keep softness without losing the strength needed for slicing and filling.
- Fresh will lead format at 35.0% in 2026 as immediate softness remains a main reason to buy potato bread and rolls.
- Fresh potato rolls need to reach the shelf while their texture meets shopper expectations. Bakers must coordinate production and replenishment so that the bread remains suitable for slicing and filling.
Why is Multipack the Leading Packaging Format?
Multipack is expected to hold 34.0% of packaging format market share in 2026.
A multipack matches the way buns are bought for family meals and restaurant service. It gives households several portions in one purchase and gives kitchens a predictable count per case. Bakers can also protect the soft crumb after baking. A single roll carries more packaging cost for each serving.
- Multipack will hold a 34.0% packaging format share in 2026 because households and operators commonly buy several buns at once.
- King’s Hawaiian lists pre-sliced 24-packs for foodservice alongside hamburger and slider buns [28]. That range shows why operators want soft rolls in known counts. Potato-bun suppliers can use the same pack logic while keeping the recipe within this market’s scope.
What Gives Supermarkets & Hypermarkets the Leading Role in the Sales Channel Category?
Supermarkets & hypermarkets are expected to hold 36.0% of sales channel market share in 2026.
Supermarkets bring potato bread into the shopper’s normal bread trip. Shelf space lets buyers compare classic and specialist recipes alongside other buns. Pack size and price are visible at once. Frequent replenishment will matter for a product sold on softness.
- Supermarkets & hypermarkets will lead sales channel at 36.0% in 2026 through routine bread shopping and regular shelf replenishment.
- Japan’s supermarket sales rose 2.6% in 2024 according to METI [9]. Food and beverage retail made the largest contribution to growth. As higher prices weakened quantity growth later in the year suppliers will need packs that keep units moving.
What are the Drivers, Restraints, and Opportunities in the Potato Bread & Rolls Market?
Soft buns support meals at home and in restaurants. Dough strength and cost restrain growth. Frozen formats can reach kitchens needing faster preparation.
- Driver: Restaurants and households want soft buns that hold fillings through normal service.
- Restraint: Recipes must meet texture and handling requirements at a pack price buyers can accept.
- Opportunity: Frozen and thaw-and-serve rolls can help kitchens serve the same bun with less on-site preparation.
Potato buns will gain orders when restaurants can fill them quickly without the bread tearing. U.S. food-away-from-home spending reached USD 1.41 trillion in 2025 or 56.3% of total food expenditure [2]. The foodservice industry needs repeatable texture and reliable case deliveries. Suppliers meeting both requirements can sell beyond the fresh bread aisle.
A soft crumb must still hold together during slicing and filling. Bakers need to test the finished bun through the storage and service conditions used by their customers. A higher recipe cost is harder to justify when those handling requirements are not met.
In 2024 Dubai issued around 1,200 new restaurant licenses [8]. Saudi Arabia recorded about 116 million domestic and inbound tourists [6]. These are foodservice signals in two profiled markets. Frozen bakery formats can give distributors a bun that stores longer and needs less preparation in the kitchen. The product still has to thaw evenly and meet local labeling rules.
Which Country CAGRs are Profiled in the Potato Bread & Rolls Market?
The eight profiled countries record CAGRs from 6.3% in Japan to 8.5% in the UAE between 2026 and 2036.
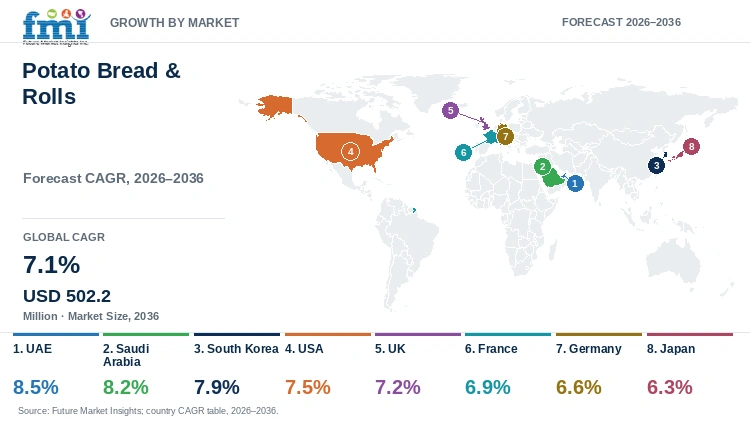
| Country | CAGR, 2026 to 2036 |
|---|---|
| UAE | 8.5% |
| Saudi Arabia | 8.2% |
| South Korea | 7.9% |
| USA | 7.5% |
| UK | 7.2% |
| France | 6.9% |
| Germany | 6.6% |
| Japan | 6.3% |
How do Country-Level CAGRs Compare in the Potato Bread & Rolls Market?
The eight profiled countries fall within a 2.2 percentage point band, from 6.3% in Japan to 8.5% in the UAE through 2036.
UAE will grow fastest among the profiled countries at 8.5% through 2036. Saudi Arabia and South Korea follow at 8.2% and 7.9%. USA and UK sit in the middle at 7.5% and 7.2%. France and Germany grow more slowly at 6.9% and 6.6%. Japan reaches 6.3%. The gap between UAE and Japan is 2.2 percentage points.
- UAE: Dubai’s new restaurant base gives distributors more kitchens in which to test frozen potato rolls.
- Saudi Arabia: Tourism adds hotel and restaurant meals that can use a standard bun across sites.
- South Korea: Bread already ranks among high-spend processed foods, giving soft rolls room in retail and convenience stores.
- USA: Large food-away-from-home spending supports burger and sandwich buns through distributors.
- UK: Bread purchases remain below FYE 2021, so potato rolls must win shelf space through taste or a clear meal use.
- France: Bread and cereal consumption rose in 2024 but potato rolls will still compete with established fresh bakeries.
- Germany: Grain products form a substantial share of household food spending. Potato buns need a clear meal use within this established category.
- Japan: Supermarket sales grew in 2024 while higher prices weakened unit growth. Pack size will matter.
FMI profiles all eight countries from 2026 to 2036. The CAGR ranking shows the pace of sales growth rather than the size of each national market.
Country Outlook
Hospitality demand, food-away-from-home spending, bread prices and retail sales trends shape the country outlook for potato bread and rolls.
- Demand for potato bread and rolls in UAE will rise at an 8.5% CAGR through 2036. Dubai issued around 1,200 new restaurant licenses in 2024 [8] and welcomed 18.72 million overnight visitors [7]. The figures describe Dubai rather than the whole country. Even so they give bun suppliers a dense hospitality market in which to test frozen and ambient products. Multi-site buyers will want the same thawing result and case count at every kitchen.
- Sales of potato bread and rolls in Saudi Arabia will grow at an 8.2% CAGR through 2036. Roughly 116 million domestic and inbound tourists visited in 2024 and tourism spending reached about SAR 284 billion (approximately USD 75.7 billion). [6]. Hotels and restaurants serving those visitors can specify one bun across many meals. Potato-roll suppliers will need a steady frozen or ambient supply and a recipe that survives busy service.
- Potato bread and rolls in South Korea will grow at a 7.9% CAGR through 2036 on demand across retail and convenience routes. A February 2025 KREI brief found bread among the highest-spend processed foods in the third quarter of 2024 [10]. Real spending on dining out and processed foods was also above pre-COVID levels. Soft potato rolls can enter those channels but suppliers will have to earn space beside many familiar bread options.
- Sales of potato bread and rolls in the USA will grow at a 7.5% CAGR through 2036. Of USD 2.51 trillion in food expenditure during 2025, USD 1.41 trillion was spent away from home [2]. Restaurants therefore offer a large route for burger and sandwich buns. Fresh retail and distributor cases give bakers two ways to scale one successful recipe.
- Growth of potato bread and rolls in the UK will reach a 7.2% CAGR through 2036 despite a mature bread aisle. Household purchases stood at 466 grams per person per week in FYE 2024 [5]. That was 0.2% above the previous year but 7.2% below FYE 2021. Cakes and buns also fell 1.2% from the previous year. Potato rolls will need to give shoppers a reason to switch through softness or a useful meal format.
- Adoption of potato bread and rolls in France will grow at a 6.9% CAGR through 2036. Bread and cereal consumption rose 2.8% in volume during 2024 and reached EUR 34.7 billion in value [4]. Overall food and non-alcoholic drink volume grew only 0.1%. Potato buns will have to find a distinct burger or sandwich use beside France’s established fresh bread. They are less likely to replace a bakery loaf bought for the table.
- Demand for potato bread and rolls in Germany will rise at a 6.6% CAGR through 2036. Grain products accounted for 17% of household food spending in 2023 according to a June 2026 Destatis release [3]. Potato buns compete within an established bread and grain category. Suppliers need to show how the bun fits burger or sandwich service at a price buyers can justify.
- Sales of potato bread and rolls in Japan will grow at a 6.3% CAGR through 2036. Retail sales rose 2.5% in 2024 while supermarkets gained 2.6% and convenience stores gained 1.2% [9]. METI said higher prices supported sales as quantity growth weakened later in the year. Smaller packs and regular product rotation can help potato bread suppliers protect unit sales.
Who are the Notable Companies in the Potato Bread & Rolls Market?
Grupo Bimbo and Flowers Foods bring packaged bread ranges. Aryzta and Lantmannen Unibake serve bake-off and foodservice buyers. Yamazaki Baking, Warburtons, Vandemoortele, Europastry, King’s Hawaiian and St Pierre Groupe complete the profiled group.
Packaged bread groups sell through frequent grocery replenishment. Grupo Bimbo and Flowers Foods have broad bread and roll ranges [15] [16] [17] while Yamazaki Baking and Warburtons serve large retail bakery markets [24] [26] [27]. Aryzta and Lantmannen Unibake sell into bake-off or foodservice routes [21] [13]. Vandemoortele and Europastry are active in frozen bakery [23] [31]. King’s Hawaiian and St Pierre Groupe compete for similar bun and roll meals [29] [33].
- Branded Retail Bread and Roll Platforms: Grupo Bimbo, Flowers Foods, Yamazaki Baking and Warburtons.
- Frozen and Foodservice Bakery Platforms: Aryzta, Lantmannen Unibake, Vandemoortele and Europastry.
- Specialty Branded Bun and Roll Platforms: King’s Hawaiian and St Pierre Groupe.
Competitive Benchmarking
Lantmannen Unibake scores High on potato-bun evidence, bread and roll format breadth and frozen / foodservice evidence in the potato bread & rolls market benchmark.
| Company | Potato-bun evidence | Bread and roll format breadth | Frozen / foodservice evidence | Geographic Reach |
|---|---|---|---|---|
| Grupo Bimbo | Low | High | Low | Multi-region global bakery operations |
| Flowers Foods | Low | High | Medium | United States |
| Aryzta | Low | High | High | Europe, Asia, Australia and New Zealand |
| Lantmannen Unibake | High | High | High | Europe-led presence with sales in 60+ markets |
| Vandemoortele | Low | High | High | Europe |
| Yamazaki Baking | Low | High | Medium | Japan, other Asian markets, United States and Europe |
| Warburtons | Low | High | Low | United Kingdom |
| King’s Hawaiian | Low | High | High | United States |
| Europastry | Low | High | High | Europe, United States and other international markets |
| St Pierre Groupe | Low | High | Medium | UK, USA, Europe and Middle East |
Scoring basis: High marks broad documented capability in the stated measure. Medium covers a narrower offer. Low marks limited public product or channel evidence. Geographic Reach describes where the company operates.
Key Developments
Lantmannen Unibake (May 2025), Grupo Bimbo (July 2025) and Aryzta (January 2026) made the dated moves FMI tracks in the potato bread & rolls market.
- In May 2025, Lantmannen Unibake announced approximately SEK 700 million (approximately USD 73 million) for a new Örebro bread facility.[11]. Its existing site makes more than two million hot dog and burger buns a day. The new 13,000-square-meter plant will add capacity for large bun orders.
- In July 2025, Grupo Bimbo said it would remove artificial colors from its portfolio by the end of 2026 [14]. It reported that 99% of daily-consumption products were already free of artificial flavors and colors. Potato-roll suppliers selling to the same retail buyers will face closer attention to their ingredient lists.
- In January 2026, Aryzta announced a EUR 40 million (approximately USD 46.8 million) bun bakery in Portugal. [19]. The investment adds dedicated capacity for restaurant and convenience buyers. Potato buns will compete for those same orders where frozen handling and case supply matter.
Key Players
Branded Retail Bread and Roll Platforms
- Grupo Bimbo
- Flowers Foods
- Yamazaki Baking
- Warburtons
Frozen and Foodservice Bakery Platforms
- Aryzta
- Lantmannen Unibake
- Vandemoortele
- Europastry
Specialty Branded Bun and Roll Platforms
- King’s Hawaiian
- St Pierre Groupe
Report Scope and Methodology
| Coverage field | Report scope |
|---|---|
| Market breakdown | Product Type; Claim / Nature; Format; Packaging Format; Sales Channel; Region |
| Quantitative units | USD Million |
| Market definition | Includes supplier revenue from bread loaves and roll or bun formats intentionally formulated and marketed as potato bread or potato rolls, with potato flakes, flour, starch, mashed potato or comparable potato solids as a defining recipe component. It covers all listed formats and channels while excluding standalone potato ingredients, prepared sandwiches or burgers, downstream meal revenue and non-potato substitute bread. |
| Regions covered | North America; Latin America; Western Europe; Eastern Europe; East Asia; South Asia and Pacific; Middle East and Africa |
| Countries covered | USA; Germany; France; UK; Saudi Arabia; UAE; Japan; South Korea |
| Key companies profiled | Grupo Bimbo; Flowers Foods; Aryzta; Lantmannen Unibake; Vandemoortele; Yamazaki Baking; Warburtons; King’s Hawaiian; Europastry; St Pierre Groupe |
| Forecast period | 2026 to 2036 |
| Approach | Primary and secondary research with market triangulation. |
Research Methodology
FMI combines interviews with bakery manufacturers, ingredient suppliers, retail buyers and foodservice distributors with desk research and market triangulation to size the potato bread & rolls market.
| Method | Approach |
|---|---|
| Primary research | FMI analysts consulted bakery manufacturers and ingredient suppliers as well as retail buyers and foodservice distributors. Interviews examined softness and slice integrity. They also covered shelf life and pack size plus case supply and price. Respondents described tests needed before regular purchasing. |
| Desk research | Desk research covered government food spending data and food labeling rules. It also reviewed bakery literature and company filings alongside product information. Official releases supplied dated country and company evidence. |
| Market sizing and forecasting | The market model combined the 2026 base value with estimates by product type and claim / nature. It also covered format and packaging format plus sales channel. Country demand conditions and channel economics informed the forecast through 2036. |
| Data validation | Estimates were checked against public spending data, bakery product ranges, company activity and primary interviews. The review kept potato bread and rolls within the stated market definition and avoided overlap with prepared meals or standalone potato ingredients. |
Potato Bread & Rolls Market by Segments
Potato Bread & Rolls Market Segmented by Product Type
- Classic / original
- Whole grain & seeded
- Flavored & filled
- Mini & snacking formats
- Premium / artisan
Potato Bread & Rolls Market Segmented by Claim / Nature
- Conventional
- Clean label
- Organic
- Gluten-free
- High-protein / fortified
Potato Bread & Rolls Market Segmented by Format
- Fresh
- Frozen
- Ambient packaged
- Chilled
- Par-baked / thaw-and-serve
Potato Bread & Rolls Market Segmented by Packaging Format
- Multipack
- Single-serve
- Family / loaf pack
- Bulk foodservice
Potato Bread & Rolls Market Segmented by Sales Channel
- Supermarkets & hypermarkets
- Artisan & specialty bakeries
- Convenience & forecourt
- Online & DTC
- Foodservice distributors
Potato Bread & Rolls Market Segmented by Region
- North America
- United States
- Canada
- Latin America
- Brazil
- Mexico
- Argentina
- Chile
- Western Europe
- Germany
- France
- United Kingdom
- Italy
- Spain
- Benelux
- Nordics
- Eastern Europe
- Poland
- Czech Republic
- Romania
- Hungary
- East Asia
- China
- Japan
- South Korea
- South Asia and Pacific
- India
- ASEAN
- Australia and New Zealand
- Middle East and Africa
- GCC Countries
- South Africa
- Türkiye
- Israel
Research Sources and Bibliography
- U.S. Food and Drug Administration (2025, February 24). FDA Extends the Effective Date for the “Healthy” Final Rule.
- U.S. Department of Agriculture, Economic Research Service (2026, June 11). Total U.S. food spending reached $2.51 trillion in 2025.
- Statistisches Bundesamt (2026, June 16). Gut ein Fünftel der Nahrungsmittelausgaben entfallen auf Fleisch und Fisch.
- INSEE (2025, June 11). La consommation des ménages en 2024.
- Department for Environment, Food & Rural Affairs (2025, November 6). Family Food FYE 2024.
- Saudi Press Agency (2025, June 22). Tourism Ministry: Saudi Arabia Tops 100 Million Visitors for Second Consecutive Year in 2024.
- Government of Dubai Media Office (2025, February 9). Dubai welcomes 18.72 million international visitors in 2024, up 9% year-on-year.
- Government of Dubai Media Office (2025, June 11). Dubai Department of Economy and Tourism Highlights Community Effort and Industry Growth Momentum at First City Briefing of 2025.
- Ministry of Economy, Trade and Industry Japan (2025, June 10). 2024
- Korea Rural Economic Institute / aT FIS (2025, February 14). [2025]
- Lantmannen Unibake (2025, May 28). Lantmännen makes strategic and long-term investment in new production facility for bread.
- Lantmannen Unibake (n.d.). Potato Burger bun, Glazed.
- Lantmannen Unibake (n.d.). Lantmännen Unibake.
- Grupo Bimbo (2025, July 29). Grupo Bimbo Commits to Removing All Artificial Colorants by End of 2026.
- Grupo Bimbo (n.d.). Annual reports.
- Flowers Foods (2025, April 16). Flowers Foods Launches New Products and Line Expansions to Meet Consumer Needs.
- Flowers Foods (n.d.). Brands.
- Flowers Foods (n.d.). Operations.
- ARYZTA AG (2026, January 22). Full year 2025 targets achieved; Revenue growth & improved performance expected in 2026; New €40m bun bakery in Portugal.
- ARYZTA AG (2026, August 26). New Perth bakery officially opened.
- ARYZTA AG (n.d.). Portfolio.
- ARYZTA AG (n.d.). Company profile.
- Vandemoortele (2025, February 14). Vandemoortele acquires Lizzi in Italy, a specialty player in frozen Bakery.
- Yamazaki Baking (n.d.). Bread Division.
- Yamazaki Baking (n.d.). Overseas Operations.
- Warburtons (n.d.). Our range of rolls.
- Warburtons (n.d.). Our Family.
- King’s Hawaiian (n.d.). Product Lineup - Foodservice.
- King’s Hawaiian (n.d.). FAQs - Foodservice.
- Europastry (n.d.). Burger Bun.
- Europastry (n.d.). Group.
- St Pierre Groupe (2025, February 13). St Pierre Launched Eat Avec Respect Campaign.
- St Pierre Groupe (n.d.). Home.
- Department for Environment, Food & Rural Affairs (2026, September 18). Family Food FYE 2025: household food purchases. Updated release.
This bibliography is provided for reader reference and is not exhaustive. The full FMI report contains the complete reference list and detailed citations.
This Report Answers
- How large is the Potato Bread & Rolls Market in 2026 and what value is forecast for 2036?
- Which industry pressures support demand for potato bread and roll formats?
- Why does Classic / original hold the leading position within Product Type?
- Why does Conventional hold the leading position within Claim / Nature?
- How do profiled country growth rates differ between 2026 and 2036?
- Which companies supply the bread, bun and roll capabilities relevant to this market?
- What limits adoption, qualification or supplier switching for potato bread and rolls?
- What should buyers evaluate before purchasing potato bread and roll products?
Table of Content
- Key Takeaways
- Market Size and CAGR
- Top Growth Driver
- Fastest Growing Segment
- Leading Region
- Key Companies
- Emerging Opportunities
- Executive Summary
- Global Market Outlook
- Demand-side Trends
- Supply-side Trends
- Technology Roadmap Analysis
- Analysis and Recommendations
- Analyst Perspective (What is happening? Why now? What should investors know?)
- Key Questions Answered
- How large is the market?
- What is the CAGR?
- What are key trends?
- Which region dominates?
- Who are the leaders?
Read More...
- Market Overview
- Market Coverage / Taxonomy
- Market Definition / Scope / Limitations
- Research Methodology
- Chapter Orientation
- Analytical Lens and Working Hypotheses
- Market Structure, Signals, and Trend Drivers
- Benchmarking and Cross-market Comparability
- Market Sizing, Forecasting, and Opportunity Mapping
- Research Design and Evidence Framework
- Desk Research Programme (Secondary Evidence)
- Expert Input and Fieldwork (Primary Evidence)
- Tooling, Models, and Reference Databases
- Data Engineering and Model Build
- Quality Assurance and Audit Trail
- Market Background
- Market Dynamics (Drivers, Restraints, Opportunity, Trends)
- Scenario Forecast (Optimistic, Likely, Conservative)
- Impact Analysis
- AI Impact
- Sustainability Impact
- Regulatory Impact
- Technology Impact
- Consumer / Buyer Analysis
- Purchase Drivers
- Adoption Barriers
- Buyer Journey
- Opportunity Map Analysis
- Product Life Cycle Analysis
- Supply Chain Analysis
- Investment Feasibility Matrix
- Value Chain Analysis
- PESTLE and Porter's Analysis
- Regulatory Landscape
- Regional Parent Market Outlook
- Production and Consumption Statistics
- Import and Export Statistics
- Global Market Analysis and Forecast, 2021 to 2036
- Historical Market Size Value (USD Million) Analysis, 2021 to 2025
- Current and Future Market Size Value (USD Million) Projections, 2026 to 2036
- Y-o-Y Growth Trend Analysis
- Absolute $ Opportunity Analysis
- Global Market Pricing Analysis, 2021 to 2036
- Global Market Analysis and Forecast, By Product Type, 2021 to 2036
- Introduction / Key Findings
- Historical Market Size Value (USD Million) Analysis By Product Type, 2021 to 2025
- Current and Future Market Size Value (USD Million) Analysis and Forecast By Product Type, 2026 to 2036
- Classic / original
- Whole grain & seeded
- Flavored & filled
- Mini & snacking formats
- Premium / artisan
- Y-o-Y Growth Trend Analysis By Product Type, 2021 to 2025
- Absolute $ Opportunity Analysis By Product Type, 2026 to 2036
- Global Market Analysis and Forecast, By Claim / Nature, 2021 to 2036
- Introduction / Key Findings
- Historical Market Size Value (USD Million) Analysis By Claim / Nature, 2021 to 2025
- Current and Future Market Size Value (USD Million) Analysis and Forecast By Claim / Nature, 2026 to 2036
- Conventional
- Clean label
- Organic
- Gluten-free
- High-protein / fortified
- Y-o-Y Growth Trend Analysis By Claim / Nature, 2021 to 2025
- Absolute $ Opportunity Analysis By Claim / Nature, 2026 to 2036
- Global Market Analysis and Forecast, By Format, 2021 to 2036
- Introduction / Key Findings
- Historical Market Size Value (USD Million) Analysis By Format, 2021 to 2025
- Current and Future Market Size Value (USD Million) Analysis and Forecast By Format, 2026 to 2036
- Fresh
- Frozen
- Ambient packaged
- Chilled
- Par-baked / thaw-and-serve
- Y-o-Y Growth Trend Analysis By Format, 2021 to 2025
- Absolute $ Opportunity Analysis By Format, 2026 to 2036
- Global Market Analysis and Forecast, By Packaging Format, 2021 to 2036
- Introduction / Key Findings
- Historical Market Size Value (USD Million) Analysis By Packaging Format, 2021 to 2025
- Current and Future Market Size Value (USD Million) Analysis and Forecast By Packaging Format, 2026 to 2036
- Multipack
- Single-serve
- Family / loaf pack
- Bulk foodservice
- Y-o-Y Growth Trend Analysis By Packaging Format, 2021 to 2025
- Absolute $ Opportunity Analysis By Packaging Format, 2026 to 2036
- Global Market Analysis and Forecast, By Sales Channel, 2021 to 2036
- Introduction / Key Findings
- Historical Market Size Value (USD Million) Analysis By Sales Channel, 2021 to 2025
- Current and Future Market Size Value (USD Million) Analysis and Forecast By Sales Channel, 2026 to 2036
- Supermarkets & hypermarkets
- Artisan & specialty bakeries
- Convenience & forecourt
- Online & DTC
- Foodservice distributors
- Y-o-Y Growth Trend Analysis By Sales Channel, 2021 to 2025
- Absolute $ Opportunity Analysis By Sales Channel, 2026 to 2036
- Global Market Analysis and Forecast, By Region, 2021 to 2036
- Introduction
- Historical Market Size Value (USD Million) Analysis By Region, 2021 to 2025
- Current Market Size Value (USD Million) Analysis and Forecast By Region, 2026 to 2036
- North America
- Latin America
- Western Europe
- Eastern Europe
- East Asia
- South Asia and Pacific
- Middle East and Africa
- Market Attractiveness Analysis By Region
- North America Market Analysis and Forecast, By Country, 2021 to 2036
- Historical Market Size Value (USD Million) Trend Analysis By Market Taxonomy, 2021 to 2025
- Market Size Value (USD Million) Forecast By Market Taxonomy, 2026 to 2036
- By Country
- United States
- Canada
- By Product Type
- By Claim / Nature
- By Format
- By Packaging Format
- By Sales Channel
- By Country
- Market Attractiveness Analysis
- By Country
- By Product Type
- By Claim / Nature
- By Format
- By Packaging Format
- By Sales Channel
- Key Takeaways
- Latin America Market Analysis and Forecast, By Country
- Historical Market Size Value (USD Million) Trend Analysis By Market Taxonomy, 2021 to 2025
- Market Size Value (USD Million) Forecast By Market Taxonomy, 2026 to 2036
- By Country
- Brazil
- Mexico
- Argentina
- Chile
- By Product Type
- By Claim / Nature
- By Format
- By Packaging Format
- By Sales Channel
- By Country
- Market Attractiveness Analysis
- By Country
- By Product Type
- By Claim / Nature
- By Format
- By Packaging Format
- By Sales Channel
- Key Takeaways
- Western Europe Market Analysis and Forecast, By Country
- Historical Market Size Value (USD Million) Trend Analysis By Market Taxonomy, 2021 to 2025
- Market Size Value (USD Million) Forecast By Market Taxonomy, 2026 to 2036
- By Country
- Germany
- France
- United Kingdom
- Italy
- Spain
- Benelux
- Nordics
- By Product Type
- By Claim / Nature
- By Format
- By Packaging Format
- By Sales Channel
- By Country
- Market Attractiveness Analysis
- By Country
- By Product Type
- By Claim / Nature
- By Format
- By Packaging Format
- By Sales Channel
- Key Takeaways
- Eastern Europe Market Analysis and Forecast, By Country
- Historical Market Size Value (USD Million) Trend Analysis By Market Taxonomy, 2021 to 2025
- Market Size Value (USD Million) Forecast By Market Taxonomy, 2026 to 2036
- By Country
- Poland
- Czech Republic
- Romania
- Hungary
- By Product Type
- By Claim / Nature
- By Format
- By Packaging Format
- By Sales Channel
- By Country
- Market Attractiveness Analysis
- By Country
- By Product Type
- By Claim / Nature
- By Format
- By Packaging Format
- By Sales Channel
- Key Takeaways
- East Asia Market Analysis and Forecast, By Country
- Historical Market Size Value (USD Million) Trend Analysis By Market Taxonomy, 2021 to 2025
- Market Size Value (USD Million) Forecast By Market Taxonomy, 2026 to 2036
- By Country
- China
- Japan
- South Korea
- By Product Type
- By Claim / Nature
- By Format
- By Packaging Format
- By Sales Channel
- By Country
- Market Attractiveness Analysis
- By Country
- By Product Type
- By Claim / Nature
- By Format
- By Packaging Format
- By Sales Channel
- Key Takeaways
- South Asia and Pacific Market Analysis and Forecast, By Country
- Historical Market Size Value (USD Million) Trend Analysis By Market Taxonomy, 2021 to 2025
- Market Size Value (USD Million) Forecast By Market Taxonomy, 2026 to 2036
- By Country
- India
- ASEAN
- Australia and New Zealand
- By Product Type
- By Claim / Nature
- By Format
- By Packaging Format
- By Sales Channel
- By Country
- Market Attractiveness Analysis
- By Country
- By Product Type
- By Claim / Nature
- By Format
- By Packaging Format
- By Sales Channel
- Key Takeaways
- Middle East and Africa Market Analysis and Forecast, By Country
- Historical Market Size Value (USD Million) Trend Analysis By Market Taxonomy, 2021 to 2025
- Market Size Value (USD Million) Forecast By Market Taxonomy, 2026 to 2036
- By Country
- GCC Countries
- South Africa
- Türkiye
- Israel
- By Product Type
- By Claim / Nature
- By Format
- By Packaging Format
- By Sales Channel
- By Country
- Market Attractiveness Analysis
- By Country
- By Product Type
- By Claim / Nature
- By Format
- By Packaging Format
- By Sales Channel
- Key Takeaways
- Key Countries Market Analysis
- United States
- Pricing Analysis
- Market Share Analysis, 2025
- By Product Type
- By Claim / Nature
- By Format
- By Packaging Format
- By Sales Channel
- Canada
- Pricing Analysis
- Market Share Analysis, 2025
- By Product Type
- By Claim / Nature
- By Format
- By Packaging Format
- By Sales Channel
- Mexico
- Pricing Analysis
- Market Share Analysis, 2025
- By Product Type
- By Claim / Nature
- By Format
- By Packaging Format
- By Sales Channel
- Brazil
- Pricing Analysis
- Market Share Analysis, 2025
- By Product Type
- By Claim / Nature
- By Format
- By Packaging Format
- By Sales Channel
- Chile
- Pricing Analysis
- Market Share Analysis, 2025
- By Product Type
- By Claim / Nature
- By Format
- By Packaging Format
- By Sales Channel
- Germany
- Pricing Analysis
- Market Share Analysis, 2025
- By Product Type
- By Claim / Nature
- By Format
- By Packaging Format
- By Sales Channel
- United Kingdom
- Pricing Analysis
- Market Share Analysis, 2025
- By Product Type
- By Claim / Nature
- By Format
- By Packaging Format
- By Sales Channel
- Italy
- Pricing Analysis
- Market Share Analysis, 2025
- By Product Type
- By Claim / Nature
- By Format
- By Packaging Format
- By Sales Channel
- Spain
- Pricing Analysis
- Market Share Analysis, 2025
- By Product Type
- By Claim / Nature
- By Format
- By Packaging Format
- By Sales Channel
- France
- Pricing Analysis
- Market Share Analysis, 2025
- By Product Type
- By Claim / Nature
- By Format
- By Packaging Format
- By Sales Channel
- India
- Pricing Analysis
- Market Share Analysis, 2025
- By Product Type
- By Claim / Nature
- By Format
- By Packaging Format
- By Sales Channel
- ASEAN
- Pricing Analysis
- Market Share Analysis, 2025
- By Product Type
- By Claim / Nature
- By Format
- By Packaging Format
- By Sales Channel
- Australia and New Zealand
- Pricing Analysis
- Market Share Analysis, 2025
- By Product Type
- By Claim / Nature
- By Format
- By Packaging Format
- By Sales Channel
- China
- Pricing Analysis
- Market Share Analysis, 2025
- By Product Type
- By Claim / Nature
- By Format
- By Packaging Format
- By Sales Channel
- Japan
- Pricing Analysis
- Market Share Analysis, 2025
- By Product Type
- By Claim / Nature
- By Format
- By Packaging Format
- By Sales Channel
- South Korea
- Pricing Analysis
- Market Share Analysis, 2025
- By Product Type
- By Claim / Nature
- By Format
- By Packaging Format
- By Sales Channel
- Poland
- Pricing Analysis
- Market Share Analysis, 2025
- By Product Type
- By Claim / Nature
- By Format
- By Packaging Format
- By Sales Channel
- Hungary
- Pricing Analysis
- Market Share Analysis, 2025
- By Product Type
- By Claim / Nature
- By Format
- By Packaging Format
- By Sales Channel
- Türkiye
- Pricing Analysis
- Market Share Analysis, 2025
- By Product Type
- By Claim / Nature
- By Format
- By Packaging Format
- By Sales Channel
- South Africa
- Pricing Analysis
- Market Share Analysis, 2025
- By Product Type
- By Claim / Nature
- By Format
- By Packaging Format
- By Sales Channel
- UAE
- Pricing Analysis
- Market Share Analysis, 2025
- By Product Type
- By Claim / Nature
- By Format
- By Packaging Format
- By Sales Channel
- Saudi Arabia
- Pricing Analysis
- Market Share Analysis, 2025
- By Product Type
- By Claim / Nature
- By Format
- By Packaging Format
- By Sales Channel
- United States
- Market Structure Analysis
- Competition Dashboard
- Competition Benchmarking
- Market Share Analysis of Top Players
- By Regional
- By Product Type
- By Claim / Nature
- By Format
- By Packaging Format
- By Sales Channel
- Emerging Startups
- Innovation Benchmarking
- Competition Analysis
- Competition Deep Dive
- Grupo Bimbo
- Overview
- Product Portfolio
- Profitability by Market Segments
- Sales Footprint
- Strategy Overview
- Marketing Strategy
- Product Strategy
- Channel Strategy
- Flowers Foods
- Aryzta
- Lantmannen Unibake
- Vandemoortele
- Yamazaki Baking
- Warburtons
- King’s Hawaiian
- Europastry
- St Pierre Groupe
- Grupo Bimbo
- Case Studies
- Success Stories
- Recent Developments
- Competition Deep Dive
- Assumptions & Acronyms Used
List of Tables
- Table 1: Global Market Value (USD Million) Forecast by Region, 2021 to 2036
- Table 2: Global Market Value (USD Million) Forecast by Product Type, 2021 to 2036
- Table 3: Global Market Value (USD Million) Forecast by Claim / Nature, 2021 to 2036
- Table 4: Global Market Value (USD Million) Forecast by Format, 2021 to 2036
- Table 5: Global Market Value (USD Million) Forecast by Packaging Format, 2021 to 2036
- Table 6: Global Market Value (USD Million) Forecast by Sales Channel, 2021 to 2036
- Table 7: North America Market Value (USD Million) Forecast by Country, 2021 to 2036
- Table 8: North America Market Value (USD Million) Forecast by Product Type, 2021 to 2036
- Table 9: North America Market Value (USD Million) Forecast by Claim / Nature, 2021 to 2036
- Table 10: North America Market Value (USD Million) Forecast by Format, 2021 to 2036
- Table 11: North America Market Value (USD Million) Forecast by Packaging Format, 2021 to 2036
- Table 12: North America Market Value (USD Million) Forecast by Sales Channel, 2021 to 2036
- Table 13: Latin America Market Value (USD Million) Forecast by Country, 2021 to 2036
- Table 14: Latin America Market Value (USD Million) Forecast by Product Type, 2021 to 2036
- Table 15: Latin America Market Value (USD Million) Forecast by Claim / Nature, 2021 to 2036
- Table 16: Latin America Market Value (USD Million) Forecast by Format, 2021 to 2036
- Table 17: Latin America Market Value (USD Million) Forecast by Packaging Format, 2021 to 2036
- Table 18: Latin America Market Value (USD Million) Forecast by Sales Channel, 2021 to 2036
- Table 19: Western Europe Market Value (USD Million) Forecast by Country, 2021 to 2036
- Table 20: Western Europe Market Value (USD Million) Forecast by Product Type, 2021 to 2036
- Table 21: Western Europe Market Value (USD Million) Forecast by Claim / Nature, 2021 to 2036
- Table 22: Western Europe Market Value (USD Million) Forecast by Format, 2021 to 2036
- Table 23: Western Europe Market Value (USD Million) Forecast by Packaging Format, 2021 to 2036
- Table 24: Western Europe Market Value (USD Million) Forecast by Sales Channel, 2021 to 2036
- Table 25: Eastern Europe Market Value (USD Million) Forecast by Country, 2021 to 2036
- Table 26: Eastern Europe Market Value (USD Million) Forecast by Product Type, 2021 to 2036
- Table 27: Eastern Europe Market Value (USD Million) Forecast by Claim / Nature, 2021 to 2036
- Table 28: Eastern Europe Market Value (USD Million) Forecast by Format, 2021 to 2036
- Table 29: Eastern Europe Market Value (USD Million) Forecast by Packaging Format, 2021 to 2036
- Table 30: Eastern Europe Market Value (USD Million) Forecast by Sales Channel, 2021 to 2036
- Table 31: East Asia Market Value (USD Million) Forecast by Country, 2021 to 2036
- Table 32: East Asia Market Value (USD Million) Forecast by Product Type, 2021 to 2036
- Table 33: East Asia Market Value (USD Million) Forecast by Claim / Nature, 2021 to 2036
- Table 34: East Asia Market Value (USD Million) Forecast by Format, 2021 to 2036
- Table 35: East Asia Market Value (USD Million) Forecast by Packaging Format, 2021 to 2036
- Table 36: East Asia Market Value (USD Million) Forecast by Sales Channel, 2021 to 2036
- Table 37: South Asia and Pacific Market Value (USD Million) Forecast by Country, 2021 to 2036
- Table 38: South Asia and Pacific Market Value (USD Million) Forecast by Product Type, 2021 to 2036
- Table 39: South Asia and Pacific Market Value (USD Million) Forecast by Claim / Nature, 2021 to 2036
- Table 40: South Asia and Pacific Market Value (USD Million) Forecast by Format, 2021 to 2036
- Table 41: South Asia and Pacific Market Value (USD Million) Forecast by Packaging Format, 2021 to 2036
- Table 42: South Asia and Pacific Market Value (USD Million) Forecast by Sales Channel, 2021 to 2036
- Table 43: Middle East and Africa Market Value (USD Million) Forecast by Country, 2021 to 2036
- Table 44: Middle East and Africa Market Value (USD Million) Forecast by Product Type, 2021 to 2036
- Table 45: Middle East and Africa Market Value (USD Million) Forecast by Claim / Nature, 2021 to 2036
- Table 46: Middle East and Africa Market Value (USD Million) Forecast by Format, 2021 to 2036
- Table 47: Middle East and Africa Market Value (USD Million) Forecast by Packaging Format, 2021 to 2036
- Table 48: Middle East and Africa Market Value (USD Million) Forecast by Sales Channel, 2021 to 2036
List of Figures
- Figure 1: Global Market Pricing Analysis
- Figure 2: Global Market Value (USD Million) Forecast 2021-2036
- Figure 3: Global Market Value Share and BPS Analysis by Product Type, 2026 and 2036
- Figure 4: Global Market Y-o-Y Growth Comparison by Product Type, 2026-2036
- Figure 5: Global Market Attractiveness Analysis by Product Type
- Figure 6: Global Market Value Share and BPS Analysis by Claim / Nature, 2026 and 2036
- Figure 7: Global Market Y-o-Y Growth Comparison by Claim / Nature, 2026-2036
- Figure 8: Global Market Attractiveness Analysis by Claim / Nature
- Figure 9: Global Market Value Share and BPS Analysis by Format, 2026 and 2036
- Figure 10: Global Market Y-o-Y Growth Comparison by Format, 2026-2036
- Figure 11: Global Market Attractiveness Analysis by Format
- Figure 12: Global Market Value Share and BPS Analysis by Packaging Format, 2026 and 2036
- Figure 13: Global Market Y-o-Y Growth Comparison by Packaging Format, 2026-2036
- Figure 14: Global Market Attractiveness Analysis by Packaging Format
- Figure 15: Global Market Value Share and BPS Analysis by Sales Channel, 2026 and 2036
- Figure 16: Global Market Y-o-Y Growth Comparison by Sales Channel, 2026-2036
- Figure 17: Global Market Attractiveness Analysis by Sales Channel
- Figure 18: Global Market Value (USD Million) Share and BPS Analysis by Region, 2026 and 2036
- Figure 19: Global Market Y-o-Y Growth Comparison by Region, 2026-2036
- Figure 20: Global Market Attractiveness Analysis by Region
- Figure 21: North America Market Incremental Dollar Opportunity, 2026-2036
- Figure 22: Latin America Market Incremental Dollar Opportunity, 2026-2036
- Figure 23: Western Europe Market Incremental Dollar Opportunity, 2026-2036
- Figure 24: Eastern Europe Market Incremental Dollar Opportunity, 2026-2036
- Figure 25: East Asia Market Incremental Dollar Opportunity, 2026-2036
- Figure 26: South Asia and Pacific Market Incremental Dollar Opportunity, 2026-2036
- Figure 27: Middle East and Africa Market Incremental Dollar Opportunity, 2026-2036
- Figure 28: North America Market Value Share and BPS Analysis by Country, 2026 and 2036
- Figure 29: North America Market Value Share and BPS Analysis by Product Type, 2026 and 2036
- Figure 30: North America Market Y-o-Y Growth Comparison by Product Type, 2026-2036
- Figure 31: North America Market Attractiveness Analysis by Product Type
- Figure 32: North America Market Value Share and BPS Analysis by Claim / Nature, 2026 and 2036
- Figure 33: North America Market Y-o-Y Growth Comparison by Claim / Nature, 2026-2036
- Figure 34: North America Market Attractiveness Analysis by Claim / Nature
- Figure 35: North America Market Value Share and BPS Analysis by Format, 2026 and 2036
- Figure 36: North America Market Y-o-Y Growth Comparison by Format, 2026-2036
- Figure 37: North America Market Attractiveness Analysis by Format
- Figure 38: North America Market Value Share and BPS Analysis by Packaging Format, 2026 and 2036
- Figure 39: North America Market Y-o-Y Growth Comparison by Packaging Format, 2026-2036
- Figure 40: North America Market Attractiveness Analysis by Packaging Format
- Figure 41: North America Market Value Share and BPS Analysis by Sales Channel, 2026 and 2036
- Figure 42: North America Market Y-o-Y Growth Comparison by Sales Channel, 2026-2036
- Figure 43: North America Market Attractiveness Analysis by Sales Channel
- Figure 44: Latin America Market Value Share and BPS Analysis by Country, 2026 and 2036
- Figure 45: Latin America Market Value Share and BPS Analysis by Product Type, 2026 and 2036
- Figure 46: Latin America Market Y-o-Y Growth Comparison by Product Type, 2026-2036
- Figure 47: Latin America Market Attractiveness Analysis by Product Type
- Figure 48: Latin America Market Value Share and BPS Analysis by Claim / Nature, 2026 and 2036
- Figure 49: Latin America Market Y-o-Y Growth Comparison by Claim / Nature, 2026-2036
- Figure 50: Latin America Market Attractiveness Analysis by Claim / Nature
- Figure 51: Latin America Market Value Share and BPS Analysis by Format, 2026 and 2036
- Figure 52: Latin America Market Y-o-Y Growth Comparison by Format, 2026-2036
- Figure 53: Latin America Market Attractiveness Analysis by Format
- Figure 54: Latin America Market Value Share and BPS Analysis by Packaging Format, 2026 and 2036
- Figure 55: Latin America Market Y-o-Y Growth Comparison by Packaging Format, 2026-2036
- Figure 56: Latin America Market Attractiveness Analysis by Packaging Format
- Figure 57: Latin America Market Value Share and BPS Analysis by Sales Channel, 2026 and 2036
- Figure 58: Latin America Market Y-o-Y Growth Comparison by Sales Channel, 2026-2036
- Figure 59: Latin America Market Attractiveness Analysis by Sales Channel
- Figure 60: Western Europe Market Value Share and BPS Analysis by Country, 2026 and 2036
- Figure 61: Western Europe Market Value Share and BPS Analysis by Product Type, 2026 and 2036
- Figure 62: Western Europe Market Y-o-Y Growth Comparison by Product Type, 2026-2036
- Figure 63: Western Europe Market Attractiveness Analysis by Product Type
- Figure 64: Western Europe Market Value Share and BPS Analysis by Claim / Nature, 2026 and 2036
- Figure 65: Western Europe Market Y-o-Y Growth Comparison by Claim / Nature, 2026-2036
- Figure 66: Western Europe Market Attractiveness Analysis by Claim / Nature
- Figure 67: Western Europe Market Value Share and BPS Analysis by Format, 2026 and 2036
- Figure 68: Western Europe Market Y-o-Y Growth Comparison by Format, 2026-2036
- Figure 69: Western Europe Market Attractiveness Analysis by Format
- Figure 70: Western Europe Market Value Share and BPS Analysis by Packaging Format, 2026 and 2036
- Figure 71: Western Europe Market Y-o-Y Growth Comparison by Packaging Format, 2026-2036
- Figure 72: Western Europe Market Attractiveness Analysis by Packaging Format
- Figure 73: Western Europe Market Value Share and BPS Analysis by Sales Channel, 2026 and 2036
- Figure 74: Western Europe Market Y-o-Y Growth Comparison by Sales Channel, 2026-2036
- Figure 75: Western Europe Market Attractiveness Analysis by Sales Channel
- Figure 76: Eastern Europe Market Value Share and BPS Analysis by Country, 2026 and 2036
- Figure 77: Eastern Europe Market Value Share and BPS Analysis by Product Type, 2026 and 2036
- Figure 78: Eastern Europe Market Y-o-Y Growth Comparison by Product Type, 2026-2036
- Figure 79: Eastern Europe Market Attractiveness Analysis by Product Type
- Figure 80: Eastern Europe Market Value Share and BPS Analysis by Claim / Nature, 2026 and 2036
- Figure 81: Eastern Europe Market Y-o-Y Growth Comparison by Claim / Nature, 2026-2036
- Figure 82: Eastern Europe Market Attractiveness Analysis by Claim / Nature
- Figure 83: Eastern Europe Market Value Share and BPS Analysis by Format, 2026 and 2036
- Figure 84: Eastern Europe Market Y-o-Y Growth Comparison by Format, 2026-2036
- Figure 85: Eastern Europe Market Attractiveness Analysis by Format
- Figure 86: Eastern Europe Market Value Share and BPS Analysis by Packaging Format, 2026 and 2036
- Figure 87: Eastern Europe Market Y-o-Y Growth Comparison by Packaging Format, 2026-2036
- Figure 88: Eastern Europe Market Attractiveness Analysis by Packaging Format
- Figure 89: Eastern Europe Market Value Share and BPS Analysis by Sales Channel, 2026 and 2036
- Figure 90: Eastern Europe Market Y-o-Y Growth Comparison by Sales Channel, 2026-2036
- Figure 91: Eastern Europe Market Attractiveness Analysis by Sales Channel
- Figure 92: East Asia Market Value Share and BPS Analysis by Country, 2026 and 2036
- Figure 93: East Asia Market Value Share and BPS Analysis by Product Type, 2026 and 2036
- Figure 94: East Asia Market Y-o-Y Growth Comparison by Product Type, 2026-2036
- Figure 95: East Asia Market Attractiveness Analysis by Product Type
- Figure 96: East Asia Market Value Share and BPS Analysis by Claim / Nature, 2026 and 2036
- Figure 97: East Asia Market Y-o-Y Growth Comparison by Claim / Nature, 2026-2036
- Figure 98: East Asia Market Attractiveness Analysis by Claim / Nature
- Figure 99: East Asia Market Value Share and BPS Analysis by Format, 2026 and 2036
- Figure 100: East Asia Market Y-o-Y Growth Comparison by Format, 2026-2036
- Figure 101: East Asia Market Attractiveness Analysis by Format
- Figure 102: East Asia Market Value Share and BPS Analysis by Packaging Format, 2026 and 2036
- Figure 103: East Asia Market Y-o-Y Growth Comparison by Packaging Format, 2026-2036
- Figure 104: East Asia Market Attractiveness Analysis by Packaging Format
- Figure 105: East Asia Market Value Share and BPS Analysis by Sales Channel, 2026 and 2036
- Figure 106: East Asia Market Y-o-Y Growth Comparison by Sales Channel, 2026-2036
- Figure 107: East Asia Market Attractiveness Analysis by Sales Channel
- Figure 108: South Asia and Pacific Market Value Share and BPS Analysis by Country, 2026 and 2036
- Figure 109: South Asia and Pacific Market Value Share and BPS Analysis by Product Type, 2026 and 2036
- Figure 110: South Asia and Pacific Market Y-o-Y Growth Comparison by Product Type, 2026-2036
- Figure 111: South Asia and Pacific Market Attractiveness Analysis by Product Type
- Figure 112: South Asia and Pacific Market Value Share and BPS Analysis by Claim / Nature, 2026 and 2036
- Figure 113: South Asia and Pacific Market Y-o-Y Growth Comparison by Claim / Nature, 2026-2036
- Figure 114: South Asia and Pacific Market Attractiveness Analysis by Claim / Nature
- Figure 115: South Asia and Pacific Market Value Share and BPS Analysis by Format, 2026 and 2036
- Figure 116: South Asia and Pacific Market Y-o-Y Growth Comparison by Format, 2026-2036
- Figure 117: South Asia and Pacific Market Attractiveness Analysis by Format
- Figure 118: South Asia and Pacific Market Value Share and BPS Analysis by Packaging Format, 2026 and 2036
- Figure 119: South Asia and Pacific Market Y-o-Y Growth Comparison by Packaging Format, 2026-2036
- Figure 120: South Asia and Pacific Market Attractiveness Analysis by Packaging Format
- Figure 121: South Asia and Pacific Market Value Share and BPS Analysis by Sales Channel, 2026 and 2036
- Figure 122: South Asia and Pacific Market Y-o-Y Growth Comparison by Sales Channel, 2026-2036
- Figure 123: South Asia and Pacific Market Attractiveness Analysis by Sales Channel
- Figure 124: Middle East and Africa Market Value Share and BPS Analysis by Country, 2026 and 2036
- Figure 125: Middle East and Africa Market Value Share and BPS Analysis by Product Type, 2026 and 2036
- Figure 126: Middle East and Africa Market Y-o-Y Growth Comparison by Product Type, 2026-2036
- Figure 127: Middle East and Africa Market Attractiveness Analysis by Product Type
- Figure 128: Middle East and Africa Market Value Share and BPS Analysis by Claim / Nature, 2026 and 2036
- Figure 129: Middle East and Africa Market Y-o-Y Growth Comparison by Claim / Nature, 2026-2036
- Figure 130: Middle East and Africa Market Attractiveness Analysis by Claim / Nature
- Figure 131: Middle East and Africa Market Value Share and BPS Analysis by Format, 2026 and 2036
- Figure 132: Middle East and Africa Market Y-o-Y Growth Comparison by Format, 2026-2036
- Figure 133: Middle East and Africa Market Attractiveness Analysis by Format
- Figure 134: Middle East and Africa Market Value Share and BPS Analysis by Packaging Format, 2026 and 2036
- Figure 135: Middle East and Africa Market Y-o-Y Growth Comparison by Packaging Format, 2026-2036
- Figure 136: Middle East and Africa Market Attractiveness Analysis by Packaging Format
- Figure 137: Middle East and Africa Market Value Share and BPS Analysis by Sales Channel, 2026 and 2036
- Figure 138: Middle East and Africa Market Y-o-Y Growth Comparison by Sales Channel, 2026-2036
- Figure 139: Middle East and Africa Market Attractiveness Analysis by Sales Channel
- Figure 140: Global Market - Tier Structure Analysis
- Figure 141: Global Market - Company Share Analysis
Frequently Asked Questions
How Big is the Potato Bread & Rolls Market in 2026, and What is Forecast for 2036?
As per FMI, the potato bread & rolls market is valued at USD 252.9 Million in 2026 and will reach USD 502.2 Million by 2036. The 2025 value was USD 236.1 Million. Soft buns for burgers and sandwiches support demand across retail and foodservice buyers.
What is the CAGR of the Potato Bread & Rolls Market from 2026 to 2036?
The potato bread & rolls market will grow at a 7.1% CAGR from 2026 to 2036. Growth depends on bakers keeping buns soft and strong enough for slicing and filling while managing potato-flour dough limits and ingredient cost across retail and restaurant supply routes.
Which Product Type Segment Leads the Potato Bread & Rolls Market?
Classic / original accounts for 38.0% of the potato bread & rolls market by product type in 2026. Its mild taste fits burgers and sandwiches across household and foodservice use. Bakers can focus on crumb softness and bun strength without the added cost of seeds or fillings.
Which Claim / Nature Segment Leads the Potato Bread & Rolls Market?
As per FMI, conventional products hold 52.0% of the potato bread & rolls market by claim and nature in 2026. The recipe serves mainstream buyers without specialist sourcing or certification. Clean label and organic versions need tighter ingredient checks before large accounts add them.
Which Profiled Countries Show Notable Growth in the Potato Bread & Rolls Market?
The potato bread & rolls market is projected to grow at a CAGR of 8.5% in the UAE, 8.2% in Saudi Arabia and 7.9% in South Korea through 2036. Hospitality demand and retail and convenience routes shape adoption of soft buns and rolls in these profiled markets.
Which Companies are Active in the Potato Bread & Rolls Market?
The potato bread & rolls market profiles 10 companies, including Grupo Bimbo and Flowers Foods alongside Aryzta and Lantmannen Unibake. Vandemoortele and Yamazaki Baking are also covered alongside Warburtons and King's Hawaiian. Europastry and St Pierre Groupe complete the group across packaged retail, frozen foodservice and specialty bun routes.
Preview the report firsthand - request a free sample
Get SampleGet the brochure for pricing and purchase details.
Get PDF
