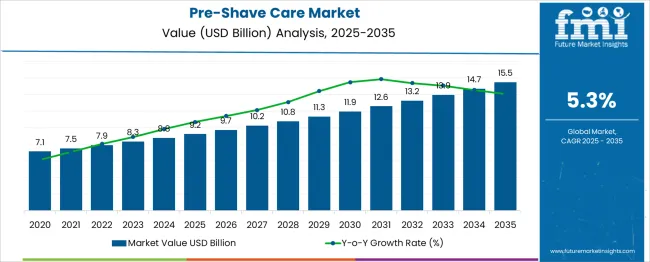
The pre-shave care market is valued at USD 9.2 billion in 2025 and is expected to reach USD 15.5 billion by 2035, expanding at a CAGR of 5.3%. Growth is driven by rising personal grooming awareness, expanding male grooming trends, and increasing consumer preference for skin-preparation products that support cleaner, safer shaves. In-built formats, holding 39.8% share in 2025, continue to dominate as multifunctional devices gain traction among consumers seeking convenience and integrated grooming solutions. The electric operation type, with 73.2% share, leads adoption due to the growing use of electric shavers, rising demand for smoother pre-shave applications, and the shift toward quick-use grooming tools suited for busy lifestyles.
Market expansion is supported by increasing availability of natural, chemical-free formulations, the rise of grooming e-commerce platforms, and rapid growth in male grooming culture across North America, Europe, and emerging Asia Pacific markets. Premiumization trends, salon-driven demand, and the influence of social media on grooming habits are encouraging manufacturers to introduce innovative formats such as organic gels, lightweight foams, and skin-conditioning pre-shave creams. While competition intensifies due to new product launches and international brand expansions, leading companies continue to invest in skin-friendly formulations, fragrance innovation, and online retail strategies to strengthen consumer engagement.
| Metric | Value |
|---|---|
| Pre-Shave Care Market Estimated Value in (2025 E) | USD 9.2 billion |
| Pre-Shave Care Market Forecast Value in (2035 F) | USD 15.5 billion |
| Forecast CAGR (2025 to 2035) | 5.3% |
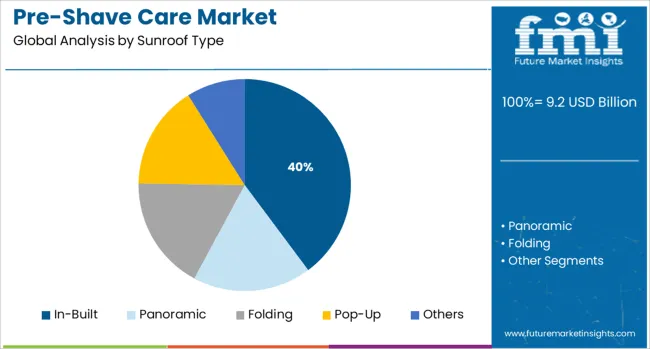
The in-built segment, projected to secure 39.8% share in 2025, leads the market due to rising demand for all-in-one grooming devices that streamline shaving routines. Consumers increasingly prefer multifunctional systems that integrate pre-shave preparation with shaving performance, reducing the need for multiple standalone products. The segment benefits from the growing penetration of electric razors and trimmers that include pre-shave conditioning mechanisms, making grooming more convenient and efficient.
In-built solutions appeal strongly to urban consumers with busy schedules, as they combine cleansing, softening, and lubrication functions in a single step. Manufacturers are enhancing these systems with skin-protective technologies, micro-vibration features, and improved blade compatibility to reduce irritation and improve shave quality. The segment also gains momentum from rising male grooming awareness, expanding product availability across online channels, and increased marketing emphasis on convenience and skin comfort. As grooming devices become more advanced and ergonomic, the in-built category is expected to maintain strong demand across developed and emerging markets.
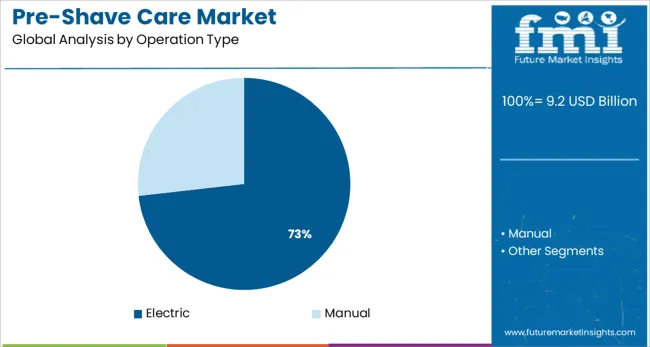
The electric segment, holding 73.2% share in 2025, remains the dominant operation category due to widespread adoption of electric shavers and the growing preference for fast, low-effort grooming solutions. Electric-compatible pre-shave products are designed to enhance glide, minimize friction, and reduce irritation, making them essential for users who prioritize comfort and speed. Rising interest in dry shaving, especially among younger and working consumers, is further propelling demand.
The segment is strengthened by innovations in electric shaver technology, including precision heads, skin-sensor systems, and micro-cutting mechanisms that require specialized pre-shave conditioners. These products help smoothen the skin surface, lift facial hair, and improve shaving outcomes. Growing male grooming trends, increased accessibility of premium electric shavers, and expansion of at-home grooming routines contribute to segment growth. As manufacturers continue to develop advanced pre-shave foams, gels, and lotions tailored for electric use, the segment is expected to retain its strong leadership throughout the forecast period.
Growing emphasis on personal care and grooming is expected to fuel sales of pre-shave products in the market. As per FMI, demand for pre-shave care products is projected to grow at a 5.3% CAGR, in comparison to the 4.2% CAGR registered between 2020 to 2024.
Increasing expenditure on personal care goods across emerging economies will favor the growth in the market. Further, the growing number of salons and barbershops is also expected to boost the global pre-shave care market.
Leading manufacturers have benefited from the evolution of modern distribution channels, which have enabled them to reach out to customers across the globe. Consumers are preferring online channels, as they can choose from a wide range of pre-shave care products available with exciting offers and discounts.
Leading personal care product manufacturers are investing in research and development to launch new products that meet consumer demand, along with focusing on customer-specific product formulations. This is expected to fuel the global pre-shave care market.
Today, consumers are very conscious of their appearance, which leads them to experiment with various cosmetics and personal care products. Taking cues, manufacturers are launching personal care products that are targeted towards both male and female demographics.
When it comes to shaving and beard shaping, preference and choices among consumers keep changing according to ongoing trends and styles. This factor has sparked interest in men's pre-shave care products. Pre-shave products are primarily used to reduce the likelihood of ingrown facial hair. Men's pre-shave products soften the hair, allowing for a smooth shave while avoiding cuts, especially at sharp angles, which can happen while shaving over ingrown hair.
Manufacturers of pre-shave care are developing skin-friendly products with a variety of natural and organic ingredients, which is likely to benefit the pre-shave care market. Shaving gels, creams, and foams with new fragrances and beneficial ingredients such as vitamin E and aloe vera are frequently introduced into the market.
Organic and natural ingredients are becoming more popular in shaving care products to make them safer and chemical-free. The return of traditional wet shaving techniques, which had been gradually encroached on by the popularity of electric shavers, will bode well for the market. As per the report, sales in Asia Pacific and Latin America will gain traction amid growing interest in personal grooming.
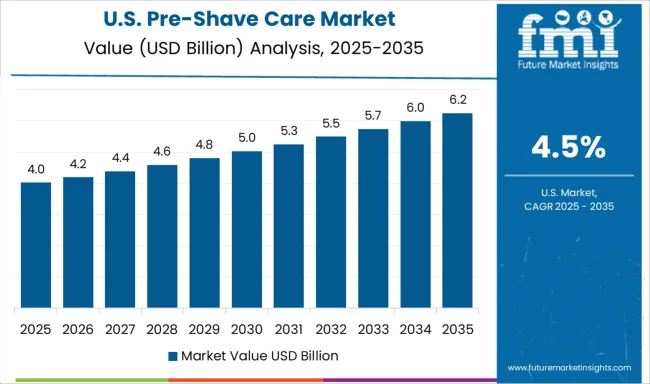
Demand for Organic Pre-Shave Products in the USA Will Fuel Growth
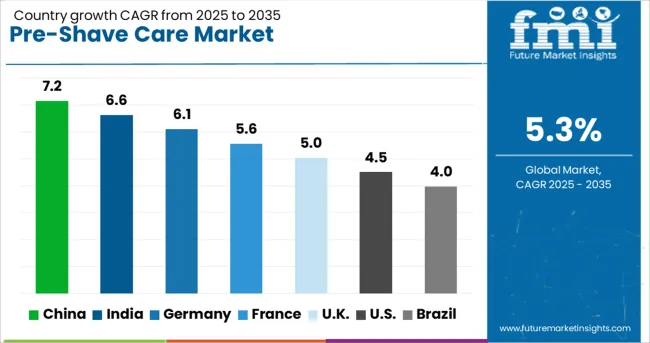
The USA is considered a lucrative market for pre-shave care products, holding 87.9% of the North American pre-shave care market share in 2024. Lifestyle and demographic changes are also influencing demand in the market. The availability of at-home salon services and greater awareness of the benefits of grooming are spurring demand for male grooming services.
Various brands are launching products for men's skincare to accommodate the growing demand. Companies are shifting their focus away from neutral items and toward gender-specific offerings amid greater demand for men's personal care items. This is expected to fuel growth in the USA market over the forecast period.
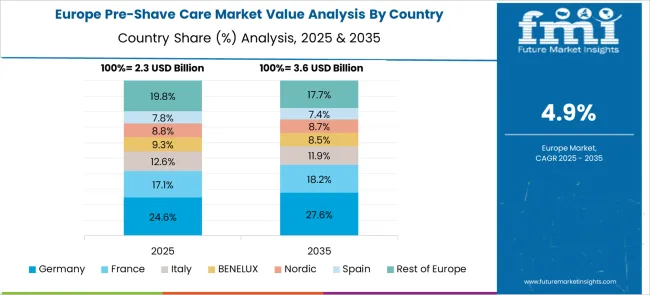
Growing Sales of Pre-Shave Products through Online Channels in Germany Will Boost the Demand
Germany accounted for over 25.7% of Europe's pre-shave care market share in 2024. In Germany, the male grooming market is thriving as more consumers are paying attention to their appearance and skin.
Men's toiletries, which include male-specific shaving products such as pre-shave care products, are expected to outpace skincare and hair care segments. Additionally, shaving products will remain an important category in the country as they serve as the anchor point for male grooming routines, with toiletries marketed as post- or pre-shaving products.
Expansion of International Brands in India Will Boost Sales of Pre-Shave Care Products
In 2024, India held over 37.7% of the South Asia pre-shave care market share. Growth can be attributed to format innovations such as compact packaging and travel kits. India is also a growing market for clean products such as natural, mineral, organic, and skin-nourishing gels, and pre-shaving creams. Further, the presence of several leading and international manufacturers is expected to augment the growth in the market.
Consumers are Preferring Pre-shave Foams over Creams
Over the forecast period, demand in the pre-shave foams segment is predicted to rise at a CAGR of 5.6%. Pre-shave foam is composed of water, oils, and an emulsion of servants or soap.
Rising focus on beauty awareness among consumers, changes in lifestyle, and the growing need for more convenience are driving growth in the pre-shave foam segment. Further, the addition of ingredients in shaving foam to improve the scent and offer skincare benefits is expected to increase demand for the product.
Demand for Natural and Clean-label Products Will Continue Gaining Momentum
In terms of nature, sales in the natural segment are forecast to grow at a 7.9% CAGR over the assessment period. Concerns regarding the harmful effects of chemicals on the skin, such as skin dullness, irritation, and dryness, are spurring demand in this segment. Consumers are becoming aware of the benefits of natural/organic products, prompting them to seek out eco-friendly, sustainable skincare products with greater product ingredient transparency.
Sales of Mid-Range Pre-Shave Care Products to Remain High
Based on the price range, the mid-range segment is expected to account for 55.6% of the total market share in 2025. As players in the market are offering a wide range of products under this range which is affordable to expand their consumer base.
Easy Availability of Pre-Shave Foams and Creams at Retail Stores Will Augment the Demand
By sales channel, store-based channels such as supermarkets and hypermarkets held the largest share of 24.2% in 2024. A wide range of brands and products are available in stores, resulting in most purchases being made.
Online retailers, on the other hand, are expected to witness growth at an 8.3% CAGR over the forecast period. A growing number of online distribution channels, such as Nykaa, Myntra, Amazon, and Walmart, that offer a diverse range of pre-shave care products will fuel growth in this segment.
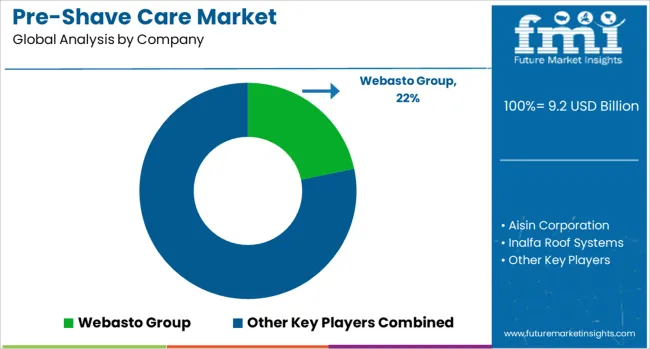
Leading players operating in the pre-shave care market are aiming at strategic collaborations and partnerships with other manufacturers to expand their product portfolios to address the demand from an expanding pool of consumers.
| Attribute | Details |
|---|---|
| Forecast Period | 2025 to 2035 |
| Historical Data Available for | 2020 to 2024 |
| Market Analysis | USD Billion for Value |
| Key Regions Covered | North America; Latin America; Europe; East Asia; South Asia; Oceania & MEA |
| Key Countries Covered | The USA, Canada, Brazil, Mexico, Germany, the UK, France, Spain, Italy, Russia, Benelux, South Africa, Northern Africa GCC Countries, China, Japan, South Korea, India, Thailand, Malaysia, Indonesia, Australia & New Zealand. |
| Key Segments Covered | Product Type, Price Range, Sales Channel, and Region. |
| Key Companies Profiled | Claus Porto; L'Oreal SA; Kiehl; Johnson & Johnson; Bold For Men; Energizer Holdings, Inc.; Malhotra Shaving Products Ltd; Acqua DI Parma; Beiersdorf AG; Edgewell Personal Care Company; Godrej Group; Siemens Healthcare |
| Report Coverage | Market Forecast, Company Share Analysis, Competition Intelligence, Drivers, Restraints, Opportunities and Threats Analysis, Market Dynamics and Challenges, and Strategic Growth Initiatives |
The global pre-shave care market is estimated to be valued at USD 9.2 billion in 2025.
The market size for the pre-shave care market is projected to reach USD 15.5 billion by 2035.
The pre-shave care market is expected to grow at a 5.3% CAGR between 2025 and 2035.
The key product types in pre-shave care market are in-built, panoramic, folding, pop-up and others.
In terms of operation type, electric segment to command 73.2% share in the pre-shave care market in 2025.


Our Research Products

The "Full Research Suite" delivers actionable market intel, deep dives on markets or technologies, so clients act faster, cut risk, and unlock growth.

The Leaderboard benchmarks and ranks top vendors, classifying them as Established Leaders, Leading Challengers, or Disruptors & Challengers.

Locates where complements amplify value and substitutes erode it, forecasting net impact by horizon

We deliver granular, decision-grade intel: market sizing, 5-year forecasts, pricing, adoption, usage, revenue, and operational KPIs—plus competitor tracking, regulation, and value chains—across 60 countries broadly.

Spot the shifts before they hit your P&L. We track inflection points, adoption curves, pricing moves, and ecosystem plays to show where demand is heading, why it is changing, and what to do next across high-growth markets and disruptive tech

Real-time reads of user behavior. We track shifting priorities, perceptions of today’s and next-gen services, and provider experience, then pace how fast tech moves from trial to adoption, blending buyer, consumer, and channel inputs with social signals (#WhySwitch, #UX).

Partner with our analyst team to build a custom report designed around your business priorities. From analysing market trends to assessing competitors or crafting bespoke datasets, we tailor insights to your needs.
Supplier Intelligence
Discovery & Profiling
Capacity & Footprint
Performance & Risk
Compliance & Governance
Commercial Readiness
Who Supplies Whom
Scorecards & Shortlists
Playbooks & Docs
Category Intelligence
Definition & Scope
Demand & Use Cases
Cost Drivers
Market Structure
Supply Chain Map
Trade & Policy
Operating Norms
Deliverables
Buyer Intelligence
Account Basics
Spend & Scope
Procurement Model
Vendor Requirements
Terms & Policies
Entry Strategy
Pain Points & Triggers
Outputs
Pricing Analysis
Benchmarks
Trends
Should-Cost
Indexation
Landed Cost
Commercial Terms
Deliverables
Brand Analysis
Positioning & Value Prop
Share & Presence
Customer Evidence
Go-to-Market
Digital & Reputation
Compliance & Trust
KPIs & Gaps
Outputs
Full Research Suite comprises of:
Market outlook & trends analysis
Interviews & case studies
Strategic recommendations
Vendor profiles & capabilities analysis
5-year forecasts
8 regions and 60+ country-level data splits
Market segment data splits
12 months of continuous data updates
DELIVERED AS:
PDF EXCEL ONLINE
Suncare Products Market Size and Share Forecast Outlook 2025 to 2035
Skincare Supplement Market Size and Share Forecast Outlook 2025 to 2035
Skincare Oil Market Size and Share Forecast Outlook 2025 to 2035
Lip Care Market Analysis - Size and Share Forecast Outlook 2025 to 2035
Skincare Nutritional Serum Market Size and Share Forecast Outlook 2025 to 2035
Haircare Supplement Market - Size, Share, and Forecast Outlook 2025 to 2035
Skincare Products Market Size and Share Forecast Outlook 2025 to 2035
Lip Care Packaging Market Size and Share Forecast Outlook 2025 to 2035
Skincare Market Analysis - Size, Share, and Forecast Outlook 2025 to 2035
Sun Care Products Market Analysis – Growth, Applications & Outlook 2025–2035
Skincare Packaging Market Size, Share & Forecast 2025 to 2035
Pet Care Market Analysis – Demand, Trends & Forecast 2025–2035
Car Care Products Market Trends - Growth, Demand & Analysis 2025 to 2035
Pet Care Packaging Market Insights - Growth & Forecast 2025 to 2035
Eye Care Supplement Analysis by Ingredients, Dosage Form, Route of Administration, Indication, Distribution channel and Region 2025 to 2035
Homecare Medical Devices Market Outlook – Industry Growth & Forecast 2025 to 2035
Skincare Industry in India – Trends & Growth Forecast 2024-2034
Global Skincare Treatment Market Analysis – Size, Share & Forecast 2024-2034
Pet Care Ingredients Market
Homecare Dermatology Energy-based Devices Market Growth – Trends & Forecast 2018-2028

Thank you!
You will receive an email from our Business Development Manager. Please be sure to check your SPAM/JUNK folder too.
Chat With
MaRIA