Preimplantation Genetic Testing Market Size and Share Forecast Outlook 2025 to 2035

The Preimplantation Genetic Testing Market is estimated to be valued at USD 934.5 million in 2025 and is projected to reach USD 2294.8 million by 2035, registering a compound annual growth rate (CAGR) of 9.4% over the forecast period.
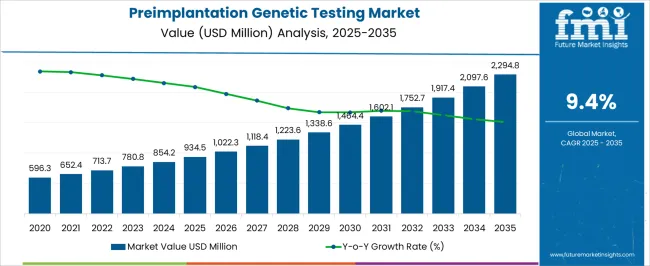
Quick Stats for Preimplantation Genetic Testing Market

  • Preimplantation Genetic Testing Market Value (2025): USD 934.5 million
  • Preimplantation Genetic Testing Market Forecast Value (2035): USD 2294.8 million
  • Preimplantation Genetic Testing Market Forecast CAGR: 9.4%
  • Leading Segment in Preimplantation Genetic Testing Market in 2025: Aneuploidy Screening (26.7%)
  • Key Growth Regions in Preimplantation Genetic Testing Market: North America, Asia-Pacific, Europe
  • Top Key Players in Preimplantation Genetic Testing Market: Agilent Technologies, Fulgent Genetics, Genea BIOMEDX, Illumina, Medicover Genetics, Natera, Revvity, RGI, Takara Bio, Thermo Fisher Scientific, Varinos, Virtus Health, Vitrolife Group (Igenomix)

Preimplantation Genetic Testing Market Market Value Analysis

Preimplantation Genetic Testing Market Key Takeaways

Metric Value
Preimplantation Genetic Testing Market Estimated Value in (2025 E) USD 934.5 million
Preimplantation Genetic Testing Market Forecast Value in (2035 F) USD 2294.8 million
Forecast CAGR (2025 to 2035) 9.4%

Why is the Preimplantation Genetic Testing Market Growing?

The Preimplantation Genetic Testing market is witnessing steady growth, driven by the increasing adoption of assisted reproductive technologies and the rising prevalence of genetic disorders among prospective parents. The demand for accurate and early detection of chromosomal abnormalities is being supported by advancements in molecular diagnostics, next-generation sequencing, and high-throughput screening techniques. Growing awareness among patients and healthcare providers about fertility options and the importance of genetic health is further accelerating market adoption.

Investments in advanced laboratory infrastructure and the integration of automated platforms for high-precision testing are improving efficiency and reliability. Regulatory support and standardized protocols for genetic testing are fostering trust and encouraging adoption in fertility clinics and maternity centers.

Additionally, the expansion of IVF services and personalized reproductive healthcare strategies is contributing to sustained market growth As technology continues to evolve and awareness increases, preimplantation genetic testing is expected to become a standard part of fertility care, providing actionable insights for clinicians and patients while reducing risks associated with genetic abnormalities.

Segmental Analysis

The preimplantation genetic testing market is segmented by application type, product type, end user, and geographic regions. By application type, preimplantation genetic testing market is divided into Aneuploidy Screening, Gender Screening, Chromosomal Aberration Screening, HLA Typing, Single Gene Disorder Screening, and Others. In terms of product type, preimplantation genetic testing market is classified into Reagents, Instruments, Analyzer Software, and Accessories & Consumables. Based on end user, preimplantation genetic testing market is segmented into Fertility Clinics & Maternity Centers, Hospitals, Diagnostic Laboratories, and Academic Institutions. Regionally, the preimplantation genetic testing industry is classified into North America, Latin America, Western Europe, Eastern Europe, Balkan & Baltic Countries, Russia & Belarus, Central Asia, East Asia, South Asia & Pacific, and the Middle East & Africa.
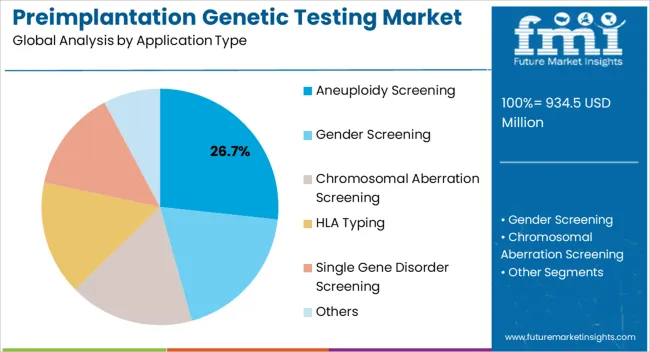
Insights into the Aneuploidy Screening Application Type Segment

Preimplantation Genetic Testing Market Analysis By Application Type

The aneuploidy screening application type is projected to hold 26.7% of the market revenue in 2025, establishing it as the leading application segment. Its growth is being driven by the critical need to identify chromosomal abnormalities in embryos prior to implantation, which improves IVF success rates and reduces the risk of miscarriage. Advanced genetic testing platforms, including high-resolution sequencing and microarray technologies, allow for rapid and accurate detection of aneuploidies.

These capabilities provide clinicians with actionable data to select viable embryos and improve patient outcomes. Integration with laboratory information management systems enhances workflow efficiency and minimizes human error.

Growing awareness among prospective parents regarding the benefits of early genetic screening has further contributed to adoption With increasing investments in fertility centers and expansion of IVF services worldwide, the aneuploidy screening segment is expected to maintain its leadership, driven by its proven clinical value and the ongoing demand for precision reproductive healthcare solutions.
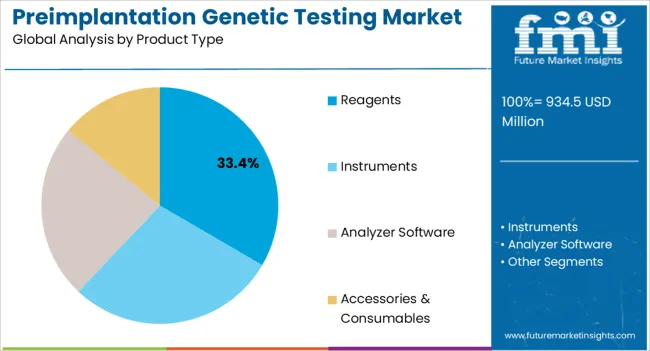
Insights into the Reagents Product Type Segment

Preimplantation Genetic Testing Market Analysis By Product Type

The reagents product type is anticipated to account for 33.4% of the market revenue in 2025, making it the leading product category. Growth in this segment is being driven by the need for high-quality, reliable reagents that support accurate genetic analysis in preimplantation testing. Reagents are essential for DNA amplification, sequencing, and chromosomal assessment, which ensures precise detection of genetic abnormalities.

Manufacturers are focusing on optimizing reagent formulations to improve sensitivity, reduce error rates, and enable high-throughput testing. Standardization of reagents and compatibility with automated platforms enhance laboratory efficiency and reproducibility of results.

The increasing number of IVF procedures, coupled with rising demand for personalized reproductive care, has strengthened the adoption of high-quality reagents in fertility clinics and maternity centers Continuous innovation, regulatory compliance, and focus on reproducibility are expected to support sustained growth in the reagents segment, reinforcing its position as the market leader among product types.
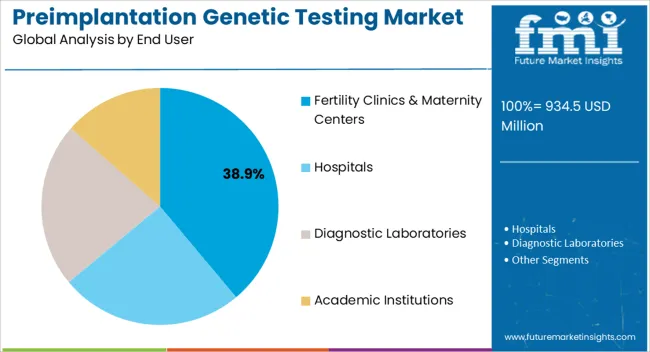
Insights into the Fertility Clinics & Maternity Centers End User Segment

Preimplantation Genetic Testing Market Analysis By End User

The fertility clinics and maternity centers end user segment is projected to hold 38.9% of the market revenue in 2025, making it the largest end-use category. Its growth is being driven by the increasing adoption of IVF and assisted reproductive technologies, which require comprehensive genetic testing for improved success rates. Fertility clinics and maternity centers are investing in advanced laboratory infrastructure and automated platforms to provide reliable and efficient preimplantation genetic testing services.

Clinicians are leveraging these services to enhance embryo selection, reduce miscarriage risk, and provide personalized reproductive care. Rising patient awareness about the benefits of genetic screening and early intervention is further supporting adoption.

Integration with laboratory information management systems, along with standardized testing protocols, ensures accuracy and compliance with regulatory requirements As demand for fertility services continues to rise globally, the segment is expected to maintain its leading position, driven by technological innovation, clinical effectiveness, and increasing patient preference for specialized reproductive healthcare solutions.

Market Overview

Preimplantation Genetic Testing Market Overview

Preimplantation genetic testing or preimplantation genetic diagnosis is a technique in which the embryos prepared through in vitro fertilization are tested for defects before implantation. Preimplantation genetic testing enables physicians and to identify the defects present in the embryos and selectively implant healthy embryos in the uterus which increases the chances of delivering a genetically healthy baby.

Preimplantation genetic testing helps people to avoid the hereditary disorders that prevail in the family to be carried into the baby. The preimplantation techniques involve various steps like the collection of eggs from the mother or egg donor which are later in vitro fertilized. Fertilized eggs are then tested for various genetic conditions through screening processes.

Healthy embryos may be frozen and stored for further use whereas unfit embryos are destroyed. The healthy embryos are implanted to induce pregnancy. Preimplantation genetic testing also serves another purpose like gender selection.

However, this application is currently facing several ethical questions. The preimplantation genetic testing is currently is gaining popularity as a fertility treatment option among carriers of sex-linked genetic disorders, single gene donors, people suffering from chromosomal disorders, older women seeking pregnancy and among women who experience recurring abortions.
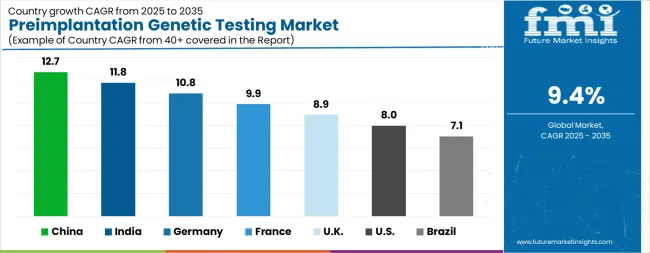
Analysis of Preimplantation Genetic Testing Market By Key Countries

Preimplantation Genetic Testing Market Cagr Analysis By Country

Country CAGR
China 12.7%
India 11.8%
Germany 10.8%
France 9.9%
UK 8.9%
USA 8.0%
Brazil 7.1%

Country-wise Analysis

The Preimplantation Genetic Testing Market is expected to register a CAGR of 9.4% during the forecast period, exhibiting varied country level momentum. China leads with the highest CAGR of 12.7%, followed by India at 11.8%. Developed markets such as Germany, France, and the UK continue to expand steadily, while the USA is likely to grow at consistent rates. Brazil posts the lowest CAGR at 7.1%, yet still underscores a broadly positive trajectory for the global Preimplantation Genetic Testing Market. In 2024, Germany held a dominant revenue in the Western Europe market and is expected to grow with a CAGR of 10.8%. The USA Preimplantation Genetic Testing Market is estimated to be valued at USD 345.5 million in 2025 and is anticipated to reach a valuation of USD 745.2 million by 2035. Sales are projected to rise at a CAGR of 8.0% over the forecast period between 2025 and 2035. While Japan and South Korea markets are estimated to be valued at USD 50.5 million and USD 30.8 million respectively in 2025.
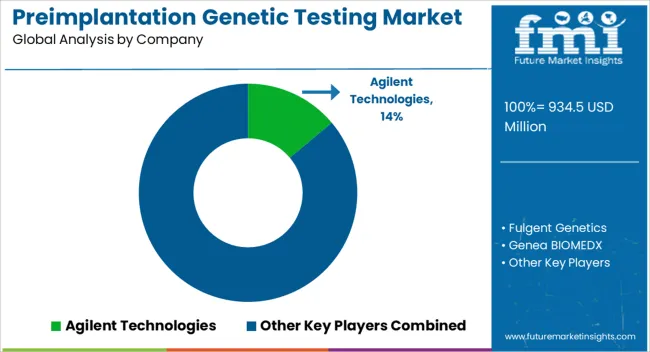
Key Players in the Preimplantation Genetic Testing Market

Preimplantation Genetic Testing Market Analysis By Company

  • Agilent Technologies
  • Fulgent Genetics
  • Genea BIOMEDX
  • Illumina
  • Medicover Genetics
  • Natera
  • Revvity
  • RGI
  • Takara Bio
  • Thermo Fisher Scientific
  • Varinos
  • Virtus Health
  • Vitrolife Group (Igenomix)

Scope of the Report

Item Value
Quantitative Units USD 934.5 Million
Application Type Aneuploidy Screening, Gender Screening, Chromosomal Aberration Screening, HLA Typing, Single Gene Disorder Screening, and Others
Product Type Reagents, Instruments, Analyzer Software, and Accessories & Consumables
End User Fertility Clinics & Maternity Centers, Hospitals, Diagnostic Laboratories, and Academic Institutions
Regions Covered North America, Europe, Asia-Pacific, Latin America, Middle East & Africa
Country Covered United States, Canada, Germany, France, United Kingdom, China, Japan, India, Brazil, South Africa
Key Companies Profiled Agilent Technologies, Fulgent Genetics, Genea BIOMEDX, Illumina, Medicover Genetics, Natera, Revvity, RGI, Takara Bio, Thermo Fisher Scientific, Varinos, Virtus Health, and Vitrolife Group (Igenomix)

Preimplantation Genetic Testing Market by Segments

Application Type:

  • Aneuploidy Screening
  • Gender Screening
  • Chromosomal Aberration Screening
  • HLA Typing
  • Single Gene Disorder Screening
  • Others

Product Type:

  • Reagents
  • Instruments
  • Analyzer Software
  • Accessories & Consumables

End User:

  • Fertility Clinics & Maternity Centers
  • Hospitals
  • Diagnostic Laboratories
  • Academic Institutions

Region:

  • North America
    • USA
    • Canada
    • Mexico
  • Latin America
    • Brazil
    • Chile
    • Rest of Latin America
  • Western Europe
    • Germany
    • UK
    • Italy
    • Spain
    • France
    • Nordic
    • BENELUX
    • Rest of Western Europe
  • Eastern Europe
    • Russia
    • Poland
    • Hungary
    • Balkan & Baltic
    • Rest of Eastern Europe
  • East Asia
    • China
    • Japan
    • South Korea
  • South Asia and Pacific
    • India
    • ASEAN
    • Australia & New Zealand
    • Rest of South Asia and Pacific
  • Middle East & Africa
    • Kingdom of Saudi Arabia
    • Other GCC Countries
    • Turkiye
    • South Africa
    • Other African Union
    • Rest of Middle East & Africa

Table of Content

  1. Executive Summary
    • Global Market Outlook
    • Demand-side Trends
    • Supply-side Trends
    • Technology Roadmap Analysis
    • Analysis and Recommendations
  2. Market Overview
    • Market Coverage / Taxonomy
    • Market Definition / Scope / Limitations
  3. Market Background
    • Market Dynamics
      • Drivers
      • Restraints
      • Opportunity
      • Trends
    • Scenario Forecast
      • Demand in Optimistic Scenario
      • Demand in Likely Scenario
      • Demand in Conservative Scenario
    • Opportunity Map Analysis
    • Product Life Cycle Analysis
    • Supply Chain Analysis
    • Investment Feasibility Matrix
    • Value Chain Analysis
    • PESTLE and Porter’s Analysis
    • Regulatory Landscape
    • Regional Parent Market Outlook
    • Production and Consumption Statistics
    • Import and Export Statistics
  4. Global Market Analysis 2020 to 2024 and Forecast, 2025 to 2035
    • Historical Market Size Value (USD Million) Analysis, 2020 to 2024
    • Current and Future Market Size Value (USD Million) Projections, 2025 to 2035
      • Y-o-Y Growth Trend Analysis
      • Absolute $ Opportunity Analysis
  5. Global Market Pricing Analysis 2020 to 2024 and Forecast 2025 to 2035
  6. Global Market Analysis 2020 to 2024 and Forecast 2025 to 2035, By Application Type
    • Introduction / Key Findings
    • Historical Market Size Value (USD Million) Analysis By Application Type , 2020 to 2024
    • Current and Future Market Size Value (USD Million) Analysis and Forecast By Application Type , 2025 to 2035
      • Aneuploidy Screening
      • Gender Screening
      • Chromosomal Aberration Screening
      • HLA Typing
      • Single Gene Disorder Screening
      • Others
    • Y-o-Y Growth Trend Analysis By Application Type , 2020 to 2024
    • Absolute $ Opportunity Analysis By Application Type , 2025 to 2035
  7. Global Market Analysis 2020 to 2024 and Forecast 2025 to 2035, By Product Type
    • Introduction / Key Findings
    • Historical Market Size Value (USD Million) Analysis By Product Type, 2020 to 2024
    • Current and Future Market Size Value (USD Million) Analysis and Forecast By Product Type, 2025 to 2035
      • Reagents
      • Instruments
      • Analyzer Software
      • Accessories & Consumables
    • Y-o-Y Growth Trend Analysis By Product Type, 2020 to 2024
    • Absolute $ Opportunity Analysis By Product Type, 2025 to 2035
  8. Global Market Analysis 2020 to 2024 and Forecast 2025 to 2035, By End User
    • Introduction / Key Findings
    • Historical Market Size Value (USD Million) Analysis By End User, 2020 to 2024
    • Current and Future Market Size Value (USD Million) Analysis and Forecast By End User, 2025 to 2035
      • Fertility Clinics & Maternity Centers
      • Hospitals
      • Diagnostic Laboratories
      • Academic Institutions
    • Y-o-Y Growth Trend Analysis By End User, 2020 to 2024
    • Absolute $ Opportunity Analysis By End User, 2025 to 2035
  9. Global Market Analysis 2020 to 2024 and Forecast 2025 to 2035, By Region
    • Introduction
    • Historical Market Size Value (USD Million) Analysis By Region, 2020 to 2024
    • Current Market Size Value (USD Million) Analysis and Forecast By Region, 2025 to 2035
      • North America
      • Latin America
      • Western Europe
      • Eastern Europe
      • East Asia
      • South Asia and Pacific
      • Middle East & Africa
    • Market Attractiveness Analysis By Region
  10. North America Market Analysis 2020 to 2024 and Forecast 2025 to 2035, By Country
    • Historical Market Size Value (USD Million) Trend Analysis By Market Taxonomy, 2020 to 2024
    • Market Size Value (USD Million) Forecast By Market Taxonomy, 2025 to 2035
      • By Country
        • USA
        • Canada
        • Mexico
      • By Application Type
      • By Product Type
      • By End User
    • Market Attractiveness Analysis
      • By Country
      • By Application Type
      • By Product Type
      • By End User
    • Key Takeaways
  11. Latin America Market Analysis 2020 to 2024 and Forecast 2025 to 2035, By Country
    • Historical Market Size Value (USD Million) Trend Analysis By Market Taxonomy, 2020 to 2024
    • Market Size Value (USD Million) Forecast By Market Taxonomy, 2025 to 2035
      • By Country
        • Brazil
        • Chile
        • Rest of Latin America
      • By Application Type
      • By Product Type
      • By End User
    • Market Attractiveness Analysis
      • By Country
      • By Application Type
      • By Product Type
      • By End User
    • Key Takeaways
  12. Western Europe Market Analysis 2020 to 2024 and Forecast 2025 to 2035, By Country
    • Historical Market Size Value (USD Million) Trend Analysis By Market Taxonomy, 2020 to 2024
    • Market Size Value (USD Million) Forecast By Market Taxonomy, 2025 to 2035
      • By Country
        • Germany
        • UK
        • Italy
        • Spain
        • France
        • Nordic
        • BENELUX
        • Rest of Western Europe
      • By Application Type
      • By Product Type
      • By End User
    • Market Attractiveness Analysis
      • By Country
      • By Application Type
      • By Product Type
      • By End User
    • Key Takeaways
  13. Eastern Europe Market Analysis 2020 to 2024 and Forecast 2025 to 2035, By Country
    • Historical Market Size Value (USD Million) Trend Analysis By Market Taxonomy, 2020 to 2024
    • Market Size Value (USD Million) Forecast By Market Taxonomy, 2025 to 2035
      • By Country
        • Russia
        • Poland
        • Hungary
        • Balkan & Baltic
        • Rest of Eastern Europe
      • By Application Type
      • By Product Type
      • By End User
    • Market Attractiveness Analysis
      • By Country
      • By Application Type
      • By Product Type
      • By End User
    • Key Takeaways
  14. East Asia Market Analysis 2020 to 2024 and Forecast 2025 to 2035, By Country
    • Historical Market Size Value (USD Million) Trend Analysis By Market Taxonomy, 2020 to 2024
    • Market Size Value (USD Million) Forecast By Market Taxonomy, 2025 to 2035
      • By Country
        • China
        • Japan
        • South Korea
      • By Application Type
      • By Product Type
      • By End User
    • Market Attractiveness Analysis
      • By Country
      • By Application Type
      • By Product Type
      • By End User
    • Key Takeaways
  15. South Asia and Pacific Market Analysis 2020 to 2024 and Forecast 2025 to 2035, By Country
    • Historical Market Size Value (USD Million) Trend Analysis By Market Taxonomy, 2020 to 2024
    • Market Size Value (USD Million) Forecast By Market Taxonomy, 2025 to 2035
      • By Country
        • India
        • ASEAN
        • Australia & New Zealand
        • Rest of South Asia and Pacific
      • By Application Type
      • By Product Type
      • By End User
    • Market Attractiveness Analysis
      • By Country
      • By Application Type
      • By Product Type
      • By End User
    • Key Takeaways
  16. Middle East & Africa Market Analysis 2020 to 2024 and Forecast 2025 to 2035, By Country
    • Historical Market Size Value (USD Million) Trend Analysis By Market Taxonomy, 2020 to 2024
    • Market Size Value (USD Million) Forecast By Market Taxonomy, 2025 to 2035
      • By Country
        • Kingdom of Saudi Arabia
        • Other GCC Countries
        • Turkiye
        • South Africa
        • Other African Union
        • Rest of Middle East & Africa
      • By Application Type
      • By Product Type
      • By End User
    • Market Attractiveness Analysis
      • By Country
      • By Application Type
      • By Product Type
      • By End User
    • Key Takeaways
  17. Key Countries Market Analysis
    • USA
      • Pricing Analysis
      • Market Share Analysis, 2024
        • By Application Type
        • By Product Type
        • By End User
    • Canada
      • Pricing Analysis
      • Market Share Analysis, 2024
        • By Application Type
        • By Product Type
        • By End User
    • Mexico
      • Pricing Analysis
      • Market Share Analysis, 2024
        • By Application Type
        • By Product Type
        • By End User
    • Brazil
      • Pricing Analysis
      • Market Share Analysis, 2024
        • By Application Type
        • By Product Type
        • By End User
    • Chile
      • Pricing Analysis
      • Market Share Analysis, 2024
        • By Application Type
        • By Product Type
        • By End User
    • Germany
      • Pricing Analysis
      • Market Share Analysis, 2024
        • By Application Type
        • By Product Type
        • By End User
    • UK
      • Pricing Analysis
      • Market Share Analysis, 2024
        • By Application Type
        • By Product Type
        • By End User
    • Italy
      • Pricing Analysis
      • Market Share Analysis, 2024
        • By Application Type
        • By Product Type
        • By End User
    • Spain
      • Pricing Analysis
      • Market Share Analysis, 2024
        • By Application Type
        • By Product Type
        • By End User
    • France
      • Pricing Analysis
      • Market Share Analysis, 2024
        • By Application Type
        • By Product Type
        • By End User
    • India
      • Pricing Analysis
      • Market Share Analysis, 2024
        • By Application Type
        • By Product Type
        • By End User
    • ASEAN
      • Pricing Analysis
      • Market Share Analysis, 2024
        • By Application Type
        • By Product Type
        • By End User
    • Australia & New Zealand
      • Pricing Analysis
      • Market Share Analysis, 2024
        • By Application Type
        • By Product Type
        • By End User
    • China
      • Pricing Analysis
      • Market Share Analysis, 2024
        • By Application Type
        • By Product Type
        • By End User
    • Japan
      • Pricing Analysis
      • Market Share Analysis, 2024
        • By Application Type
        • By Product Type
        • By End User
    • South Korea
      • Pricing Analysis
      • Market Share Analysis, 2024
        • By Application Type
        • By Product Type
        • By End User
    • Russia
      • Pricing Analysis
      • Market Share Analysis, 2024
        • By Application Type
        • By Product Type
        • By End User
    • Poland
      • Pricing Analysis
      • Market Share Analysis, 2024
        • By Application Type
        • By Product Type
        • By End User
    • Hungary
      • Pricing Analysis
      • Market Share Analysis, 2024
        • By Application Type
        • By Product Type
        • By End User
    • Kingdom of Saudi Arabia
      • Pricing Analysis
      • Market Share Analysis, 2024
        • By Application Type
        • By Product Type
        • By End User
    • Turkiye
      • Pricing Analysis
      • Market Share Analysis, 2024
        • By Application Type
        • By Product Type
        • By End User
    • South Africa
      • Pricing Analysis
      • Market Share Analysis, 2024
        • By Application Type
        • By Product Type
        • By End User
  18. Market Structure Analysis
    • Competition Dashboard
    • Competition Benchmarking
    • Market Share Analysis of Top Players
      • By Regional
      • By Application Type
      • By Product Type
      • By End User
  19. Competition Analysis
    • Competition Deep Dive
      • Agilent Technologies
        • Overview
        • Product Portfolio
        • Profitability by Market Segments (Product/Age /Sales Channel/Region)
        • Sales Footprint
        • Strategy Overview
          • Marketing Strategy
          • Product Strategy
          • Channel Strategy
      • Fulgent Genetics
      • Genea BIOMEDX
      • Illumina
      • Medicover Genetics
      • Natera
      • Revvity
      • RGI
      • Takara Bio
      • Thermo Fisher Scientific
      • Varinos
      • Virtus Health
      • Vitrolife Group (Igenomix)
  20. Assumptions & Acronyms Used
  21. Research Methodology

List of Tables

  • Table 1: Global Market Value (USD Million) Forecast by Region, 2020 to 2035
  • Table 2: Global Market Value (USD Million) Forecast by Application Type , 2020 to 2035
  • Table 3: Global Market Value (USD Million) Forecast by Product Type, 2020 to 2035
  • Table 4: Global Market Value (USD Million) Forecast by End User, 2020 to 2035
  • Table 5: North America Market Value (USD Million) Forecast by Country, 2020 to 2035
  • Table 6: North America Market Value (USD Million) Forecast by Application Type , 2020 to 2035
  • Table 7: North America Market Value (USD Million) Forecast by Product Type, 2020 to 2035
  • Table 8: North America Market Value (USD Million) Forecast by End User, 2020 to 2035
  • Table 9: Latin America Market Value (USD Million) Forecast by Country, 2020 to 2035
  • Table 10: Latin America Market Value (USD Million) Forecast by Application Type , 2020 to 2035
  • Table 11: Latin America Market Value (USD Million) Forecast by Product Type, 2020 to 2035
  • Table 12: Latin America Market Value (USD Million) Forecast by End User, 2020 to 2035
  • Table 13: Western Europe Market Value (USD Million) Forecast by Country, 2020 to 2035
  • Table 14: Western Europe Market Value (USD Million) Forecast by Application Type , 2020 to 2035
  • Table 15: Western Europe Market Value (USD Million) Forecast by Product Type, 2020 to 2035
  • Table 16: Western Europe Market Value (USD Million) Forecast by End User, 2020 to 2035
  • Table 17: Eastern Europe Market Value (USD Million) Forecast by Country, 2020 to 2035
  • Table 18: Eastern Europe Market Value (USD Million) Forecast by Application Type , 2020 to 2035
  • Table 19: Eastern Europe Market Value (USD Million) Forecast by Product Type, 2020 to 2035
  • Table 20: Eastern Europe Market Value (USD Million) Forecast by End User, 2020 to 2035
  • Table 21: East Asia Market Value (USD Million) Forecast by Country, 2020 to 2035
  • Table 22: East Asia Market Value (USD Million) Forecast by Application Type , 2020 to 2035
  • Table 23: East Asia Market Value (USD Million) Forecast by Product Type, 2020 to 2035
  • Table 24: East Asia Market Value (USD Million) Forecast by End User, 2020 to 2035
  • Table 25: South Asia and Pacific Market Value (USD Million) Forecast by Country, 2020 to 2035
  • Table 26: South Asia and Pacific Market Value (USD Million) Forecast by Application Type , 2020 to 2035
  • Table 27: South Asia and Pacific Market Value (USD Million) Forecast by Product Type, 2020 to 2035
  • Table 28: South Asia and Pacific Market Value (USD Million) Forecast by End User, 2020 to 2035
  • Table 29: Middle East & Africa Market Value (USD Million) Forecast by Country, 2020 to 2035
  • Table 30: Middle East & Africa Market Value (USD Million) Forecast by Application Type , 2020 to 2035
  • Table 31: Middle East & Africa Market Value (USD Million) Forecast by Product Type, 2020 to 2035
  • Table 32: Middle East & Africa Market Value (USD Million) Forecast by End User, 2020 to 2035

List of Figures

  • Figure 1: Global Market Pricing Analysis
  • Figure 2: Global Market Value (USD Million) Forecast 2020-2035
  • Figure 3: Global Market Value Share and BPS Analysis by Application Type , 2025 and 2035
  • Figure 4: Global Market Y-o-Y Growth Comparison by Application Type , 2025-2035
  • Figure 5: Global Market Attractiveness Analysis by Application Type
  • Figure 6: Global Market Value Share and BPS Analysis by Product Type, 2025 and 2035
  • Figure 7: Global Market Y-o-Y Growth Comparison by Product Type, 2025-2035
  • Figure 8: Global Market Attractiveness Analysis by Product Type
  • Figure 9: Global Market Value Share and BPS Analysis by End User, 2025 and 2035
  • Figure 10: Global Market Y-o-Y Growth Comparison by End User, 2025-2035
  • Figure 11: Global Market Attractiveness Analysis by End User
  • Figure 12: Global Market Value (USD Million) Share and BPS Analysis by Region, 2025 and 2035
  • Figure 13: Global Market Y-o-Y Growth Comparison by Region, 2025-2035
  • Figure 14: Global Market Attractiveness Analysis by Region
  • Figure 15: North America Market Incremental Dollar Opportunity, 2025-2035
  • Figure 16: Latin America Market Incremental Dollar Opportunity, 2025-2035
  • Figure 17: Western Europe Market Incremental Dollar Opportunity, 2025-2035
  • Figure 18: Eastern Europe Market Incremental Dollar Opportunity, 2025-2035
  • Figure 19: East Asia Market Incremental Dollar Opportunity, 2025-2035
  • Figure 20: South Asia and Pacific Market Incremental Dollar Opportunity, 2025-2035
  • Figure 21: Middle East & Africa Market Incremental Dollar Opportunity, 2025-2035
  • Figure 22: North America Market Value Share and BPS Analysis by Country, 2025 and 2035
  • Figure 23: North America Market Value Share and BPS Analysis by Application Type , 2025 and 2035
  • Figure 24: North America Market Y-o-Y Growth Comparison by Application Type , 2025-2035
  • Figure 25: North America Market Attractiveness Analysis by Application Type
  • Figure 26: North America Market Value Share and BPS Analysis by Product Type, 2025 and 2035
  • Figure 27: North America Market Y-o-Y Growth Comparison by Product Type, 2025-2035
  • Figure 28: North America Market Attractiveness Analysis by Product Type
  • Figure 29: North America Market Value Share and BPS Analysis by End User, 2025 and 2035
  • Figure 30: North America Market Y-o-Y Growth Comparison by End User, 2025-2035
  • Figure 31: North America Market Attractiveness Analysis by End User
  • Figure 32: Latin America Market Value Share and BPS Analysis by Country, 2025 and 2035
  • Figure 33: Latin America Market Value Share and BPS Analysis by Application Type , 2025 and 2035
  • Figure 34: Latin America Market Y-o-Y Growth Comparison by Application Type , 2025-2035
  • Figure 35: Latin America Market Attractiveness Analysis by Application Type
  • Figure 36: Latin America Market Value Share and BPS Analysis by Product Type, 2025 and 2035
  • Figure 37: Latin America Market Y-o-Y Growth Comparison by Product Type, 2025-2035
  • Figure 38: Latin America Market Attractiveness Analysis by Product Type
  • Figure 39: Latin America Market Value Share and BPS Analysis by End User, 2025 and 2035
  • Figure 40: Latin America Market Y-o-Y Growth Comparison by End User, 2025-2035
  • Figure 41: Latin America Market Attractiveness Analysis by End User
  • Figure 42: Western Europe Market Value Share and BPS Analysis by Country, 2025 and 2035
  • Figure 43: Western Europe Market Value Share and BPS Analysis by Application Type , 2025 and 2035
  • Figure 44: Western Europe Market Y-o-Y Growth Comparison by Application Type , 2025-2035
  • Figure 45: Western Europe Market Attractiveness Analysis by Application Type
  • Figure 46: Western Europe Market Value Share and BPS Analysis by Product Type, 2025 and 2035
  • Figure 47: Western Europe Market Y-o-Y Growth Comparison by Product Type, 2025-2035
  • Figure 48: Western Europe Market Attractiveness Analysis by Product Type
  • Figure 49: Western Europe Market Value Share and BPS Analysis by End User, 2025 and 2035
  • Figure 50: Western Europe Market Y-o-Y Growth Comparison by End User, 2025-2035
  • Figure 51: Western Europe Market Attractiveness Analysis by End User
  • Figure 52: Eastern Europe Market Value Share and BPS Analysis by Country, 2025 and 2035
  • Figure 53: Eastern Europe Market Value Share and BPS Analysis by Application Type , 2025 and 2035
  • Figure 54: Eastern Europe Market Y-o-Y Growth Comparison by Application Type , 2025-2035
  • Figure 55: Eastern Europe Market Attractiveness Analysis by Application Type
  • Figure 56: Eastern Europe Market Value Share and BPS Analysis by Product Type, 2025 and 2035
  • Figure 57: Eastern Europe Market Y-o-Y Growth Comparison by Product Type, 2025-2035
  • Figure 58: Eastern Europe Market Attractiveness Analysis by Product Type
  • Figure 59: Eastern Europe Market Value Share and BPS Analysis by End User, 2025 and 2035
  • Figure 60: Eastern Europe Market Y-o-Y Growth Comparison by End User, 2025-2035
  • Figure 61: Eastern Europe Market Attractiveness Analysis by End User
  • Figure 62: East Asia Market Value Share and BPS Analysis by Country, 2025 and 2035
  • Figure 63: East Asia Market Value Share and BPS Analysis by Application Type , 2025 and 2035
  • Figure 64: East Asia Market Y-o-Y Growth Comparison by Application Type , 2025-2035
  • Figure 65: East Asia Market Attractiveness Analysis by Application Type
  • Figure 66: East Asia Market Value Share and BPS Analysis by Product Type, 2025 and 2035
  • Figure 67: East Asia Market Y-o-Y Growth Comparison by Product Type, 2025-2035
  • Figure 68: East Asia Market Attractiveness Analysis by Product Type
  • Figure 69: East Asia Market Value Share and BPS Analysis by End User, 2025 and 2035
  • Figure 70: East Asia Market Y-o-Y Growth Comparison by End User, 2025-2035
  • Figure 71: East Asia Market Attractiveness Analysis by End User
  • Figure 72: South Asia and Pacific Market Value Share and BPS Analysis by Country, 2025 and 2035
  • Figure 73: South Asia and Pacific Market Value Share and BPS Analysis by Application Type , 2025 and 2035
  • Figure 74: South Asia and Pacific Market Y-o-Y Growth Comparison by Application Type , 2025-2035
  • Figure 75: South Asia and Pacific Market Attractiveness Analysis by Application Type
  • Figure 76: South Asia and Pacific Market Value Share and BPS Analysis by Product Type, 2025 and 2035
  • Figure 77: South Asia and Pacific Market Y-o-Y Growth Comparison by Product Type, 2025-2035
  • Figure 78: South Asia and Pacific Market Attractiveness Analysis by Product Type
  • Figure 79: South Asia and Pacific Market Value Share and BPS Analysis by End User, 2025 and 2035
  • Figure 80: South Asia and Pacific Market Y-o-Y Growth Comparison by End User, 2025-2035
  • Figure 81: South Asia and Pacific Market Attractiveness Analysis by End User
  • Figure 82: Middle East & Africa Market Value Share and BPS Analysis by Country, 2025 and 2035
  • Figure 83: Middle East & Africa Market Value Share and BPS Analysis by Application Type , 2025 and 2035
  • Figure 84: Middle East & Africa Market Y-o-Y Growth Comparison by Application Type , 2025-2035
  • Figure 85: Middle East & Africa Market Attractiveness Analysis by Application Type
  • Figure 86: Middle East & Africa Market Value Share and BPS Analysis by Product Type, 2025 and 2035
  • Figure 87: Middle East & Africa Market Y-o-Y Growth Comparison by Product Type, 2025-2035
  • Figure 88: Middle East & Africa Market Attractiveness Analysis by Product Type
  • Figure 89: Middle East & Africa Market Value Share and BPS Analysis by End User, 2025 and 2035
  • Figure 90: Middle East & Africa Market Y-o-Y Growth Comparison by End User, 2025-2035
  • Figure 91: Middle East & Africa Market Attractiveness Analysis by End User
  • Figure 92: Global Market - Tier Structure Analysis
  • Figure 93: Global Market - Company Share Analysis

Frequently Asked Questions

How big is the preimplantation genetic testing market in 2025?

The global preimplantation genetic testing market is estimated to be valued at USD 934.5 million in 2025.

What will be the size of preimplantation genetic testing market in 2035?

The market size for the preimplantation genetic testing market is projected to reach USD 2,294.8 million by 2035.

How much will be the preimplantation genetic testing market growth between 2025 and 2035?

The preimplantation genetic testing market is expected to grow at a 9.4% CAGR between 2025 and 2035.

What are the key product types in the preimplantation genetic testing market?

The key product types in preimplantation genetic testing market are aneuploidy screening, gender screening, chromosomal aberration screening, hla typing, single gene disorder screening and others.

Which product type segment to contribute significant share in the preimplantation genetic testing market in 2025?

In terms of product type, reagents segment to command 33.4% share in the preimplantation genetic testing market in 2025.

Explore Similar Insights

Future Market Insights

Preimplantation Genetic Testing Market

Chat With

MaRIA

Hi There, I am MaRIA, Your Market Research Intelligence Assistant. How may I help you?