

- Market Size (2026)
- USD 1.33 Bn
- Forecast (2036)
- USD 2.67 Bn
- CAGR (2026 to 2036)
- 41.0%
Premium Leisure Cabin Interior Configuration Kits Market Size, Market Forecast and Outlook By FMI
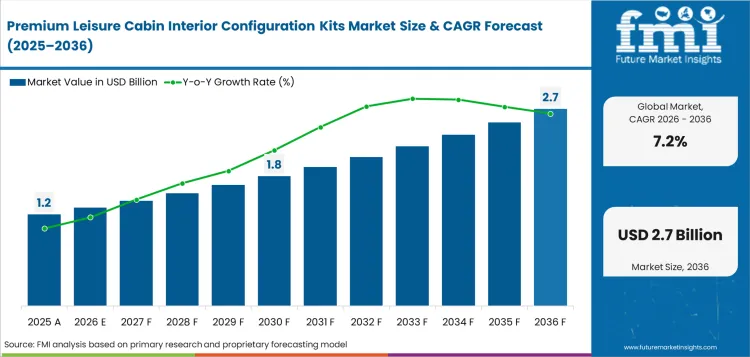
Premium leisure cabin interior configuration kits market was valued at USD 1.24 billion in 2025 and is projected to reach USD 1.33 billion in 2026. It is forecast to reach USD 2.67 billion by 2036 at 7.2% CAGR. Seat-centric kits are projected to lead kit type demand with 41.0% share, while retrofit programs are expected to hold 54.0% share by sales model in 2026.
Summary of the Premium Leisure Cabin Interior Configuration Kits Market
- Demand and Growth Drivers
- Premium leisure cabin demand is forecast to rise as airlines convert long-haul aircraft into cabins with more paid comfort zones.
- Market value is supported by airline retrofit cycles that bundle seats with privacy trims and cabin finish kits.
- Passenger mix is changing as premium economy and business leisure travelers create demand beyond corporate routes.
- Configuration kits are receiving more attention as packaged parts reduce engineering work during heavy maintenance checks.
- Product and Segment View
- Seat-centric kits are projected to account for 41.0% share in 2026 as seat count and cabin class layout drive most retrofit value.
- Suite modules are expected to account for 25.0% share in 2026 as privacy doors and console upgrades move into more business cabins.
- Widebody retrofit platforms are forecast to account for 46.0% share in 2026 because long-haul layouts carry higher premium content.
- Geography and Competitive Outlook
- India is projected to reach 8.6% CAGR through 2036 as fleet expansion and premium economy cabins lift kit demand.
- The United Arab Emirates is expected to post 8.1% CAGR through 2036 as hub carriers expand premium cabin refurbishments.
- Companies such as Safran Seats, Collins Aerospace and Recaro Aircraft Seating shape the seat and suite kit supply base.
- Lufthansa Technik and Diehl Aviation influence retrofit engineering. JAMCO Corporation adds strength in monuments and cabin integration work.
- Analyst Opinion
- Nikhil Kaitwade,Principal Consultant at Future Market Insights says, “The next premium leisure cabin cycle will not be won by seat design alone. Airlines need certified kits that protect aircraft time on the ground. Suppliers that combine comfort features with faster installation evidence will gain preference in long-haul retrofit programs.”
- Premium Leisure Cabin Interior Configuration Kits Market Value Analysis
- Market value is rising as airlines are treating premium leisure cabins as revenue hardware. International Air Transport Association data showed international premium travel grew 11.8% in 2024. That rate slightly exceeded economy passenger growth in the same year.
- Premium seating and privacy kits support revenue per aircraft over cabin styling alone. Kit pricing varies with how much certification work is already embedded in the package.
- Seat shipsets and monument modules carry more value when they arrive with approved drawings. Lighting scenes add value when installation data is ready.
- Airlines are likely to pay more for kits that shorten test time and avoid repeated engineering changes.
Key Takeaways, Market Size, and Forecast
- The premium leisure cabin interior configuration kits market was valued at USD 1.24 billion in 2025.
- By 2036, the premium leisure cabin interior configuration kits market is expected to be worth USD 2.67 billion.
- From 2026 to 2036, the market is projected to expand at 7.2% CAGR.
- The market is projected to create an incremental opportunity of USD 1.34 billion between 2026 and 2036.
- Seat-centric kits are projected to account for 41.0% share of kit type demand in 2026.
- Retrofit programs are expected to account for 54.0% share of sales model demand in 2026.
- India at 8.6% CAGR and the United Arab Emirates at 8.1% CAGR are expected to record above-global country outlooks.
Premium cabin upgrades are moving beyond brand projects into planned aircraft lifecycle work. International Air Transport Association data released in August 2025 showed 116.9 million international premium-class travelers in 2024. The same source placed premium travelers at 6.0% of international passengers. This gives airlines a clear revenue reason to refresh cabins where leisure passengers pay for space and privacy. These kits fit within the wider aircraft cabin interior value chain.
Airline retrofit plans are becoming more modular as carriers seek to reduce aircraft downtime. Safran signed a memorandum of understanding with Emirates in November 2025 to support seat manufacturing and assembly in Dubai. Lufthansa Technik completed its first Boeing 787 cabin modification in March 2026. Supplier actions show how kit suppliers are being judged on certification readiness and install speed. Airlines are anticipated to favor suppliers that can package seats and soft goods into fit-ready kits.
Premium Leisure Cabin Interior Configuration Kits Market Definition
The market covers certified parts and packaged upgrade sets used to create premium leisure cabins in commercial and business aircraft. Scope includes seating packages and privacy suites along with lighting trim and premium economy conversion kits. Revenue covers kit sales, engineering packs and component bundles sold for linefit or retrofit installation. The scope excludes airport lounges and standard economy-only seating work. Structural aircraft work and labor revenue are excluded when no cabin kit value is identified.
Premium Leisure Cabin Interior Configuration Kits Market Inclusions
Market scope covers seat-centric kits and suite modules. Lounge and storage kits are covered with ambience kits. Aircraft platform includes widebody retrofit and narrowbody premium programs. Business jet cabin and regional premium programs are included. Cabin class covers business class and premium economy. First class and leisure lounge zones are included. Sales model includes retrofit programs and linefit packages. Component upgrades are included as a smaller route. Installation channel covers maintenance repair and overhaul led installation. Airline engineering and original equipment manufacturer integration are included.
Premium Leisure Cabin Interior Configuration Kits Market Exclusions
Scope does not include aircraft structural repair or airport interiors. Crew-only rest compartments and standard economy cabin refresh work are excluded when premium content is absent. Connectivity hardware is excluded unless it is supplied as part of a seat or suite configuration kit. Full maintenance labor is excluded unless the kit value is separately identified in the contract.
Premium Leisure Cabin Interior Configuration Kits Market Research Methodology
- Primary Research: Future Market Insights analysts reviewed airline retrofit needs and supplier kit portfolios. They checked engineering approval needs and maintenance planning factors across major aviation markets.
- Desk Research: The study used public data from aviation bodies and national transport agencies. Supplier newsrooms and official airport statistics were reviewed for developments.
- Market sizing and forecasting: Market size was estimated through bottom-up supplier revenue mapping and top-down checks against premium-class traffic and cabin retrofit activity.
- Data validation: Forecast checks compared aircraft delivery outlooks and passenger traffic. Premium cabin programs and country aviation activity were reviewed through 2026.
Why is the Premium Leisure Cabin Interior Configuration Kits Market Growing?
- Airlines are refreshing premium cabins so that leisure passengers can choose space and privacy on long-haul routes.
- Retrofit airlines prefer bundled kits as fewer open engineering decisions reduce aircraft time outside service.
- Premium economy is widening the addressable base as leisure travelers can upgrade before paying for full business class.
Premium leisure cabin investment is rising as airlines connect comfort to fare mix. International Air Transport Association reported that full-year 2024 air traffic rose 10.4% compared with 2023. Load factor reached 83.5% in the same year. Higher aircraft use makes downtime expensive, which raises interest in pre-engineered kits that can be installed during planned maintenance windows.
Aircraft delivery growth extends the order path for premium cabin kits. Airbus said in June 2025 that around 43,400 passenger and freighter aircraft would be needed over the next 20 years. Replacement aircraft account for 44% of that forecast. Fleet renewal supports line fit demand for commercial aircraft cabin interior packages with premium leisure layouts already planned at delivery.
Market Segmentation Analysis
- Seat-centric kits are projected to reach 41.0% share in 2026 as seating drives cabin density and premium revenue design.
- Widebody retrofit platforms are expected to represent 46.0% share in 2026 as long-haul cabins carry more premium modules.
- Business class is forecast to account for 45.0% share in 2026 as suite privacy and direct aisle access upgrades raise kit value.
- Retrofit programs are projected to capture 54.0% share in 2026 as airlines refresh aircraft before full replacement.
- Maintenance/repair and overhaul led installation is estimated to account for 44.0% share in 2026 as cabin work is usually tied to heavy checks.
The market is divided into five primary segment groups based on kit type and aircraft platform. Cabin class and sales model explain how airlines define premium upgrades. Kit type covers seat-centric kits and suite modules. Lounge and storage kits form a smaller premium zone. Aircraft platform covers widebody retrofit and narrowbody premium. Business jet cabin and regional premium programs complete the platform scope.
Insights into the Seat-Centric Kits Type Segment
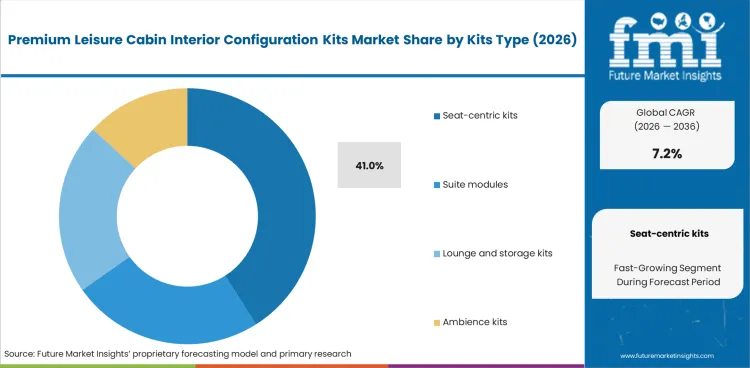
- Seat-centric kits are projected to account for 41.0% share of kit type demand in 2026. Airlines begin most premium cabin projects with seat count and seat pitch. That makes the aircraft seat platform the main design anchor before lighting or trim is finalized. Suppliers with certified shells and fast monument matching can reduce cabin planning risk.
- Suite modules and lounge kits add value after the seat layout is approved. Their adoption depends on available floor area and airline brand goals. Seat-centric kits keep a larger share as every premium leisure upgrade must first protect passenger comfort and aircraft capacity.
Insights into the Widebody Retrofit Aircraft Platform Segment
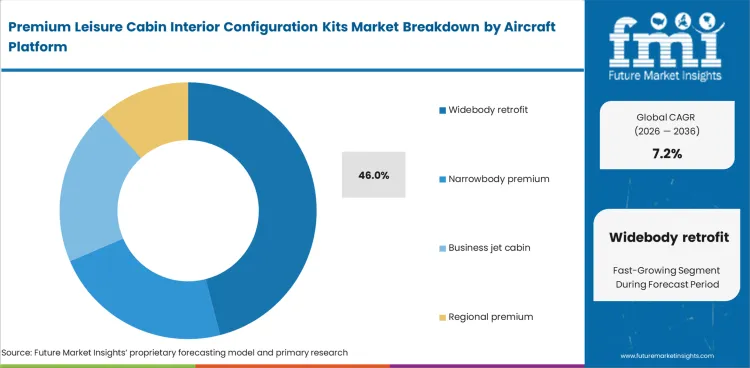
- Widebody retrofit platforms are expected to represent 46.0% share of aircraft platform demand in 2026. Long-haul aircraft carry more premium zones and larger cabin monuments than narrowbody fleets. The revenue case is clearer when suites and lounge storage can be refreshed in one shop visit.
- Narrowbody premium cabins are growing on medium-haul routes. These cabins carry fewer monuments per aircraft. Business jet cabin projects remain high value. Fleet volume is lower than commercial airline retrofits. Widebody retrofit retains the main role as cabin reconfiguration and retrofit maintenance services become a planned path for leisure-focused airlines.
Insights into the Business Class Cabin Class Segment
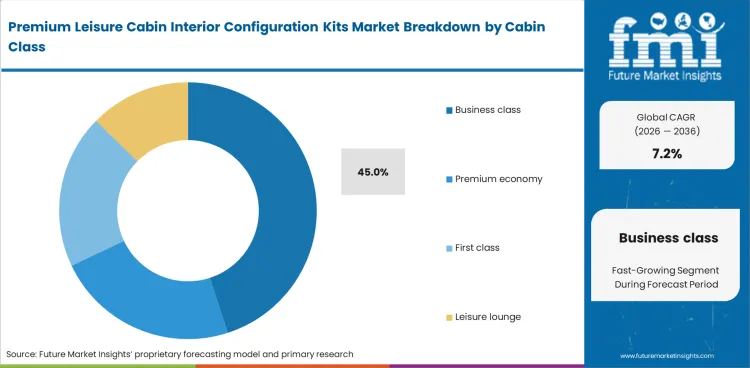
- Business class is forecast to account for 45.0% share of cabin class demand in 2026. The segment receives more configuration value per seat as doors and stowage features raise kit content. Leisure travelers choosing long-haul upgrades make privacy a visible product feature.
- Premium economy is expected to widen as airlines add a middle cabin between economy and business class. First class remains selective since many carriers now prefer business suites. Leisure lounge concepts appear mainly on widebody flag carrier programs and business aviation aircraft.
Insights into the Retrofit Programs Sales Model Segment
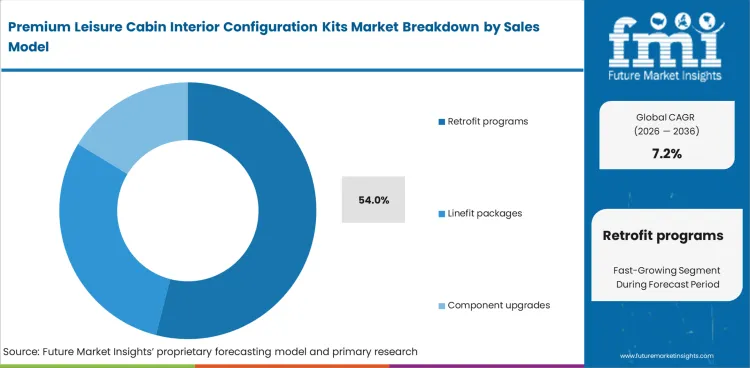
- Retrofit programs are projected to account for 54.0% share of sales model demand in 2026. Airlines can raise cabin value before new aircraft arrive by upgrading seats and surfaces on existing aircraft. Timing advantage makes retrofit kits important during delivery delays.
- Linefit packages remain important for new widebody deliveries and cabin standardization. Component upgrades serve smaller refresh needs such as curtains or seat covers. Retrofit programs hold the main share because they can update passenger experience without waiting for fleet renewal.
Insights into the MRO-Led Installation Channel Segment
- Maintenance, repair and overhaul led installation is estimated to account for 44.0% share of installation channel demand in 2026. Cabin kits often move during heavy checks when the aircraft is already out of service. This makes aircraft maintenance repair and overhaul capacity a direct part of the kit buying decision.
- Airline engineering teams remain involved because each cabin layout must match brand and safety files. Original equipment manufacturer integration works best for new aircraft.
Premium Leisure Cabin Interior Configuration Kits Market Drivers, Restraints, and Opportunities
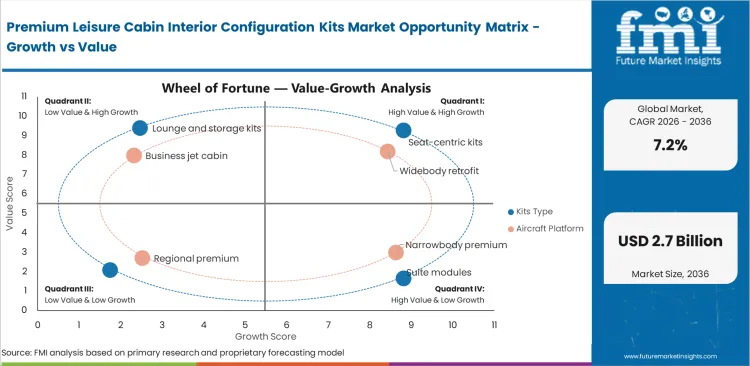
- Premium cabin retrofit demand is rising as leisure travelers pay for privacy and rest on long-haul flights.
- Certification cost slows smaller kit suppliers as each cabin change needs safety evidence and fit checks.
- Modular upgrade packs create opportunity as airlines seek faster aircraft return during scheduled maintenance.
Premium cabin planning has shifted from single seat choice into full zone packaging. Airlines want lighting trim and soft barriers to arrive as coordinated kits. That pattern supports demand for aircraft lighting features that improve cabin mood during long leisure flights. Suppliers that can combine visual comfort with certified installation drawings can secure repeat retrofit work.
Certification Cost Is Slowing Smaller Suppliers
The main restraint is the cost and time required to prove that every cabin part meets aviation safety rules. Interior kits must satisfy flammability and installation evidence before airline use. Smaller suppliers can lose projects when they cannot provide documentation quickly. This keeps large certified suppliers in a stronger position.
Soft Divider Kits Create Upgrade Value
The clearest opportunity is flexible privacy upgrades that avoid major cabin structure changes. Premium leisure cabins can use curtains and trim kits to create better zone separation. Privacy kit demand connects with aircraft curtains where material finish and fire performance shape airline decisions.
Analysis of Premium Leisure Cabin Interior Configuration Kits Market by Key Countries
.webp "Top Country Growth Comparison Premium Leisure Cabin Interior Configuration Kits Market Cagr (2026 2036)")
| Country | CAGR |
|---|---|
| United States | 6.8% CAGR |
| China | 7.7% CAGR |
| India | 8.6% CAGR |
| Germany | 6.5% CAGR |
| Japan | 6.9% CAGR |
| United Kingdom | 6.7% CAGR |
| United Arab Emirates | 8.1% CAGR |
Source: Future Market Insights, 2026.
Premium Leisure Cabin Interior Configuration Kits Market CAGR Analysis by Country
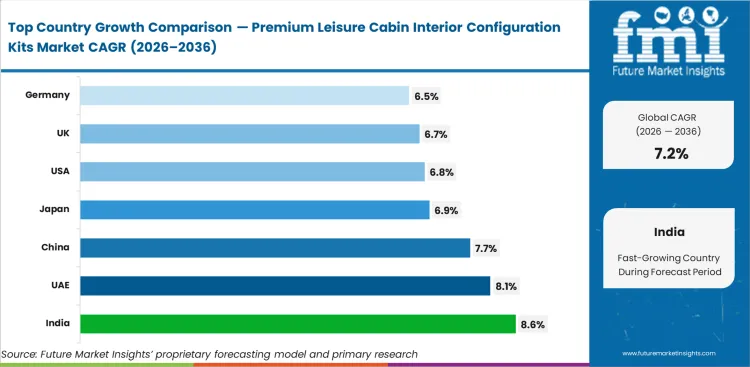
- India is projected to record 8.6% CAGR by 2036 as domestic fleet growth creates more premium cabin trials.
- The United Arab Emirates is expected to post 8.1% CAGR by 2036 as hub carriers keep large retrofit programs active.
- China is forecast at 7.7% CAGR by 2036 as airline traffic recovery supports cabin refresh planning.
- Japan and the United Kingdom are expected to track near the global rate through premium long-haul upgrades.
- The United States and Germany remain large but mature markets with steady retrofit demand and strict approval needs.
Demand for premium leisure cabin interior configuration kits is forecast to rise at 7.2% CAGR from 2026 to 2036. Country analysis covers traffic scale and premium passenger mix. Retrofit activity and supplier depth decide where commercial kit demand is strongest.
Demand Outlook for Premium Leisure Cabin Interior Configuration Kits Market in the United States
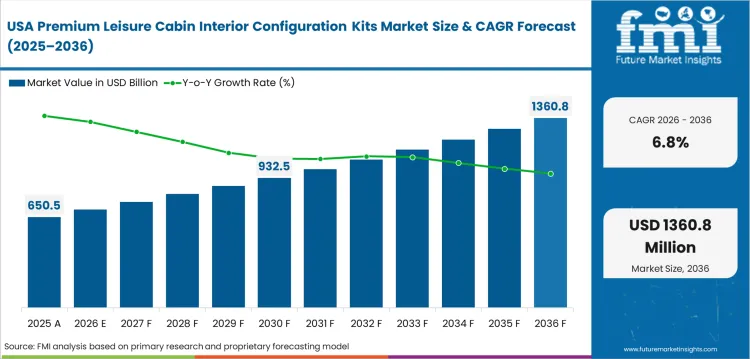
The United States is projected to record 6.8% CAGR through 2036 as retrofit work serves a mature but large airline fleet. The United States Bureau of Transportation Statistics reported 83.6 million scheduled service passengers for U.S. airlines in March 2025. Passenger base supports regular cabin refresh cycles in premium routes from New York and Miami.
- New York transatlantic routes keep demand active for business class and premium economy refresh kits.
- Los Angeles supports premium leisure upgrades linked to Asia-Pacific and Pacific island traffic.
- Miami creates demand for leisure-led cabin products on Caribbean and Latin American routes.
Sales Analysis of Premium Leisure Cabin Interior Configuration Kits Market in China
China is expected to expand at 7.7% CAGR through 2036 as air travel recovery and domestic fleet scale improve kit demand. The Civil Aviation Administration of China reported that Chinese airlines carried more than 700 million passengers by mid-December 2024. Traffic volume gives airlines a broad aircraft base for cabin class testing.
- Shanghai carriers can test premium layouts for long-haul and high-yield regional services.
- Beijing aviation planners need certified kits that match large carrier route restoration plans.
- Guangzhou creates demand for widebody interior upgrades tied to Southeast Asia and Oceania routes.
Demand Outlook for Premium Leisure Cabin Interior Configuration Kits Market in India
India is forecast to grow at 8.6% CAGR through 2036 as airline expansion creates more space for premium cabin formats. The Press Information Bureau of India reported 146.4 million domestic scheduled passengers from January to November 2024. Rising passenger depth supports premium economy and business cabin trials beyond metro routes.
- Delhi supports premium cabin trials because full-service carriers use the hub for long-haul growth.
- Mumbai routes create leisure and visiting-friends-and-relatives demand for comfort-focused cabin refresh work.
- Bengaluru supports premium economy adoption as international technology travel mixes with leisure demand.
Opportunity Analysis of Premium Leisure Cabin Interior Configuration Kits Market in Germany
Germany is expected to advance at 6.5% CAGR through 2036 as cabin suppliers and maintenance groups serve European retrofit projects. The Federal Statistical Office of Germany reported about 199.5 million passengers at major German airports in 2024. Passenger scale supports steady interior refurbishment needs across Frankfurt, Munich and Hamburg. Supplier opportunity is clearest where retrofit engineering and certification work are bundled.
- Frankfurt supports widebody cabin upgrades tied to intercontinental premium traffic.
- Munich creates demand for premium cabin refresh work on leisure and business long-haul services.
- Hamburg remains important because aircraft interior supply and engineering talent are concentrated there.
Future Outlook for Premium Leisure Cabin Interior Configuration Kits Market in Japan
Japan is forecast at 6.9% CAGR through 2036 as long-haul premium service standards support selective cabin upgrades. The Ministry of Land Infrastructure Transport and Tourism of Japan reported 108.76 million domestic scheduled passengers in fiscal year 2024. International passenger growth on Japanese carriers gives premium retrofit programs a clearer use case. Tokyo and Osaka can support kit demand through airline renewal work.
- Tokyo remains central for premium cabin planning linked to international network restoration.
- Osaka can support leisure premium demand as long-haul inbound tourism continues to recover.
- Nagoya creates opportunity for certified cabin kits tied to regional aerospace supply links.
Sales Analysis of Premium Leisure Cabin Interior Configuration Kits Market in the United Kingdom
The United Kingdom is projected to record 6.7% CAGR through 2036 as long-haul leisure routes support cabin refresh spending. The United Kingdom Civil Aviation Authority reported 302 million passengers across United Kingdom airports in 2025. Passenger flow supports premium economy and business cabin upgrades from London and Edinburgh. Suppliers need proven flammability files and short shop schedules to win projects.
- London long-haul routes create the clearest opportunity for business class suite refresh kits.
- Manchester supports premium leisure traffic on transatlantic and Gulf carrier services.
- Edinburgh can create selective premium economy demand on hub-linked international routes.
Future Outlook for Premium Leisure Cabin Interior Configuration Kits Market in the United Arab Emirates
The United Arab Emirates is expected to post 8.1% CAGR through 2036 as hub carriers keep premium cabin investment visible. Dubai International welcomed 92.3 million guests in 2024 according to the Government of Dubai Public Debt Management Office. Traffic base supports widebody cabin refresh programs with premium leisure content.
- Dubai supports premium suite and lounge kits through large widebody retrofit programs.
- Abu Dhabi creates demand for high-value cabin kits tied to long-haul leisure and transfer traffic.
- Local seat assembly plans improve the case for faster kit supply and regional installation support.
Competitive Landscape and Strategic Positioning
- Seat and suite suppliers are focusing on certified platform depth and the ability to match airline cabin branding.
- Maintenance groups compete by shortening aircraft downtime during premium cabin retrofit programs.
- Monument and lighting specialists gain value when they help airlines refresh cabins without full structural change.
- Supplier selection depends on kit readiness and crashworthiness evidence. Flammability files and installation support decide final program confidence.
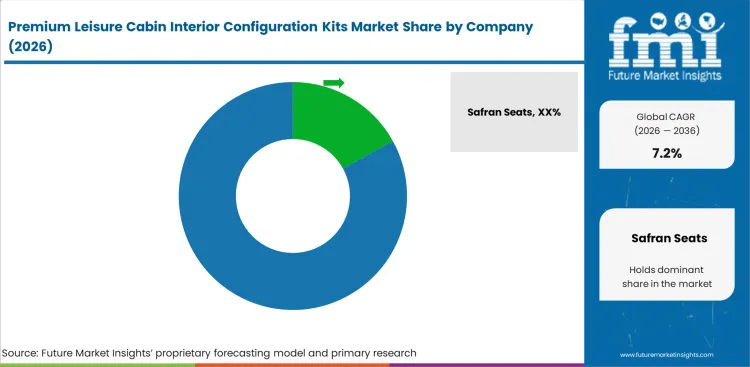
Competition is concentrated among companies that can combine product design with certification evidence. Companies such as Safran Seats, Collins Aerospace and Recaro Aircraft Seating have clear capability in premium seating platforms. Thompson Aero Seating competes through long-haul business seat designs. These suppliers compete well when airlines need comfort upgrades without repeated approval delays.
Integration specialists compete from a different position. Lufthansa Technik can turn approved cabin concepts into aircraft modification programs. Diehl Aviation and JAMCO Corporation add monuments and cabin systems. The practical result is a market where kit suppliers need both design appeal and install proof. Window-zone upgrades may draw from aircraft windows and windshields when premium passengers expect better light control.
Key Companies in the Premium Leisure Cabin Interior Configuration Kits Market
Competition is best read by role because seat makers, cabin systems suppliers and retrofit integrators create value in different parts of the upgrade path.
- Seat and Suite Leaders: Safran Seats and Collins Aerospace hold established positions through premium seat platforms. Recaro Aircraft Seating and Thompson Aero Seating compete through suite design and retrofit references. Safran Seats is estimated to account for 18.0% share of the addressable premium kit supplier base in 2026.
- Cabin Systems and Integration Specialists: Diehl Aviation and Lufthansa Technik serve the market through monuments and engineering packages. JAMCO Corporation adds lavatory items and interior component depth. Their role is clearest when the kit extends beyond the seat into the full cabin zone.
Competitive Benchmarking: Premium Leisure Cabin Interior Configuration Kits Market
| Company | Certified Suite Integration | Retrofit Kit Readiness | Cabin Systems Depth | Geographic Footprint |
|---|---|---|---|---|
| Safran Seats | High | High | Strong | Global with Europe and Middle East retrofit depth |
| Collins Aerospace | High | High | Strong | Global with North America and Asia production depth |
| Recaro Aircraft Seating | High | Medium | Strong | Global with strong narrowbody and premium economy exposure |
| Thompson Aero Seating | High | Medium | Medium | United Kingdom centered with long-haul premium seat focus |
| Diehl Aviation | Medium | High | Strong | Europe centered with cabin monument and systems depth |
| Lufthansa Technik | Medium | High | Strong | Global modification network with widebody retrofit capability |
| JAMCO Corporation | Medium | High | Medium | Japan centered with lavatory, galley and interior component depth |
Source: Future Market Insights competitive analysis, 2026.
Key Developments in Premium Leisure Cabin Interior Configuration Kits Market
In March 2025 Lufthansa Technik Malta announced a 6,400 square-meter hangar for Boeing 787 Dreamliner cabin modifications from autumn 2026.
- In June 2025, Thompson Aero Seating reported a 47% revenue increase and launched VantageNOVA First and VantageXL+ during Aircraft Interiors Expo 2025.
- In November 2025, Safran and Emirates signed a memorandum of understanding to establish a seat manufacturing and assembly facility in Dubai.
- In January 2026, JAMCO Corporation announced the planned acquisition of Schüschke GmbH to strengthen lavatory and customized cabin interior component capability.
- In April 2026, Thompson Aero Seating announced Delta Air Lines as launch customer for the VantageNOVA premium angled seat for twin-aisle aircraft.
- In May 2026, Emirates operated its first retrofitted two-class Airbus A380 with 76 Business Class seats and 56 Premium Economy seats.
Key Players in the Premium Leisure Cabin Interior Configuration Kits Market
- Safran Seats
- Collins Aerospace
- Recaro Aircraft Seating
- Diehl Aviation
- Lufthansa Technik
- Thompson Aero Seating
- JAMCO Corporation
Report Scope and Coverage
| Item | Value |
|---|---|
| Quantitative Units | USD Billion |
| Market Definition | Certified premium cabin kits for leisure-focused commercial and business aircraft interiors |
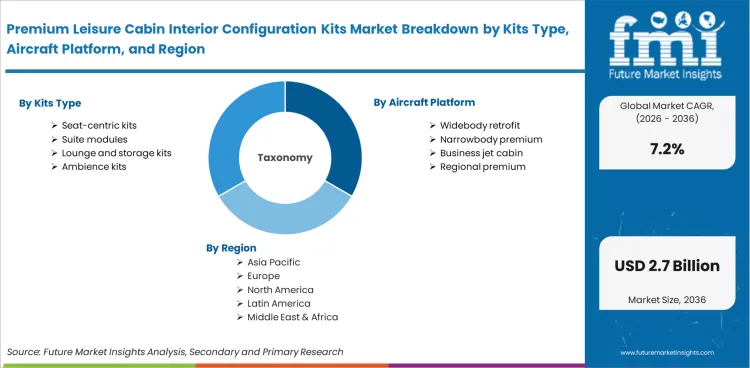
| Kit Type Segmentation | Seat-centric kits, Suite modules, Lounge and storage kits, Ambience kits |
| Aircraft Platform Segmentation | Widebody retrofit, Narrowbody premium, Business jet cabin, Regional premium |
| Cabin Class Segmentation | Business class, Premium economy, First class, Leisure lounge |
| Sales Model Segmentation | Retrofit programs, Linefit packages, Component upgrades |
| Installation Channel Segmentation | MRO-led installation, Airline engineering, OEM integration |
| Regions Covered | North America, Europe, East Asia, South Asia, Middle East, Rest of World |
| Countries Covered | United States, China, India, Germany, Japan, United Kingdom, United Arab Emirates |
| Key Companies Profiled | Safran Seats, Collins Aerospace, Recaro Aircraft Seating, Diehl Aviation, Lufthansa Technik, Thompson Aero Seating, JAMCO Corporation |
| Forecast Period | 2026 to 2036 |
| Approach | Hybrid bottom-up supplier mapping with top-down validation from aviation traffic and retrofit indicators |
Source: Future Market Insights, 2026.
Premium Leisure Cabin Interior Configuration Kits Market Breakdown by Kit Type, Aircraft Platform, Cabin Class, Sales Model, Installation Channel, and Region
Premium Leisure Cabin Interior Configuration Kits Market Segmented by Kit Type:
- Seat-centric kits
- Suite modules
- Lounge and storage kits
- Ambience kits
Premium Leisure Cabin Interior Configuration Kits Market Segmented by Aircraft Platform:
- Widebody retrofit
- Narrowbody premium
- Business jet cabin
- Regional premium
Premium Leisure Cabin Interior Configuration Kits Market Segmented by Cabin Class:
- Business class
- Premium economy
- First class
- Leisure lounge
Premium Leisure Cabin Interior Configuration Kits Market Segmented by Sales Model:
- Retrofit programs
- Linefit packages
- Component upgrades
Premium Leisure Cabin Interior Configuration Kits Market Segmented by Installation Channel:
- MRO-led installation
- Airline engineering
- OEM integration
Premium Leisure Cabin Interior Configuration Kits Market by Region:
- North America
- Europe
- East Asia
- South Asia
- Middle East
- Rest of World
Research Sources and Bibliography
- 1. International Air Transport Association. (2025, August). IATA launches 2024 World Air Transport Statistics report.
- 2. International Air Transport Association. (2025, January). Global air passenger demand reaches record high in 2024.
- 3. Airbus. (2025, June). Global Market Forecast 2025: People and commerce driving air traffic growth.
- 4. The Boeing Company. (2025). Commercial Market Outlook 2025 to 2044.
- 5. Federal Aviation Administration. (2026, May). FAA Aerospace Forecast Fiscal Years 2026 to 2046.
- 6. United States Bureau of Transportation Statistics. (2025, June). March 2025 U.S. airline traffic data.
- 7. Civil Aviation Administration of China. (2024, December). Passenger transport completed by Chinese airlines exceeds 700 million.
- 8. Press Information Bureau, Government of India. (2025, January). Year End Review 2024: Ministry of Civil Aviation.
- 9. Federal Statistical Office of Germany. (2025, March). 7.7% more air passengers in 2024.
- 10. Ministry of Land, Infrastructure, Transport and Tourism, Japan. (2025, June). Air transport statistics annual report 2024.
- 11. United Kingdom Civil Aviation Authority. (2026, February). UK aviation breaks records with over 300 million passenger journeys.
- 12. Government of Dubai Public Debt Management Office. (2025, January). Dubai International records annual traffic peak in 2024.
- 13. Recaro Aircraft Seating GmbH & Co. KG. (2024, August). Recaro Aircraft Seating R5 selected for IndiGo business class.
- 14. Collins Aerospace. (2024, October). Collins Aerospace opens expanded executive aircraft seating facility in Florida.
- 15. Safran Seats. (2025, November). Emirates and Safran sign MoU to bring manufacturing and seat assembly unit to Dubai.
- 16. Lufthansa Technik AG. (2026, March). Lufthansa Technik Malta completes first Boeing 787 cabin modification.
- 17. Thompson Aero Seating Limited. (2026, April). Delta Air Lines becomes launch customer for VantageNOVA.
- 18. JAMCO Corporation. (2026, January). JAMCO to acquire Schueschke GmbH.
The bibliography is provided for reader reference and uses aviation bodies, company sources and government data relevant to cabin retrofit demand signals.
This Report Answers
- What is the current and forecast value of the premium leisure cabin interior configuration kits market?
- Which kit type is expected to account for the leading share in 2026?
- How do retrofit programs shape supplier demand and aircraft downtime planning?
- Which countries show stronger outlook and what aviation signals support that view?
- Which companies are best placed across seats, monuments and retrofit integration?
- What restraints limit smaller suppliers in certified premium cabin kit programs?
Frequently Asked Questions
How big is the premium leisure cabin interior configuration kits market in 2026?
The market is projected to reach USD 1.33 billion in 2026 and advance at 7.2% CAGR through 2036.
What will the premium leisure cabin interior configuration kits market be worth by 2036?
The market is expected to reach USD 2.67 billion by 2036 as retrofit and premium cabin programs expand.
Which kit type leads the premium leisure cabin interior configuration kits market?
Seat-centric kits are projected to account for 41.0% share in 2026 due to their central role in cabin layout.
Which sales model leads the premium leisure cabin interior configuration kits market?
Retrofit programs are expected to hold 54.0% share in 2026 as airlines refresh cabins before new aircraft delivery.
Which country records the stronger premium leisure cabin interior configuration kits market outlook?
India is projected at 8.6% CAGR through 2036 as fleet growth and premium cabin trials increase.
Who are the key companies in the premium leisure cabin interior configuration kits market?
The profiled companies include Safran Seats and Collins Aerospace with five other certified cabin suppliers.
Preview the report firsthand - request a free sample
Get SampleGet the brochure for pricing and purchase details.
Get PDFTable of Content
- Key Takeaways
- Market Size and CAGR
- Top Growth Driver
- Fastest Growing Segment
- Leading Region
- Key Companies
- Emerging Opportunities
- Executive Summary
- Global Market Outlook
- Demand-side Trends
- Supply-side Trends
- Technology Roadmap Analysis
- Analysis and Recommendations
- Analyst Perspective (What is happening? Why now? What should investors know?)
- Key Questions Answered
- How large is the market?
- What is the CAGR?
- What are key trends?
- Which region dominates?
- Who are the leaders?
- Market Overview
- Market Coverage / Taxonomy
- Market Definition / Scope / Limitations
- Research Methodology
- Chapter Orientation
- Analytical Lens and Working Hypotheses
- Market Structure, Signals, and Trend Drivers
- Benchmarking and Cross-market Comparability
- Market Sizing, Forecasting, and Opportunity Mapping
- Research Design and Evidence Framework
- Desk Research Programme (Secondary Evidence)
- Expert Input and Fieldwork (Primary Evidence)
- Tooling, Models, and Reference Databases
- Data Engineering and Model Build
- Quality Assurance and Audit Trail
- Market Background
- Market Dynamics (Drivers, Restraints, Opportunity, Trends)
- Scenario Forecast (Optimistic, Likely, Conservative)
- Impact Analysis
- AI Impact
- Sustainability Impact
- Regulatory Impact
- Technology Impact
- Consumer / Buyer Analysis
- Purchase Drivers
- Adoption Barriers
- Buyer Journey
- Opportunity Map Analysis
- Product Life Cycle Analysis
- Supply Chain Analysis
- Investment Feasibility Matrix
- Value Chain Analysis
- PESTLE and Porter's Analysis
- Regulatory Landscape
- Regional Parent Market Outlook
- Production and Consumption Statistics
- Import and Export Statistics
- Global Market Analysis and Forecast, 2021 to 2036
- Historical Market Size Value (USD Billion) & Volume (Unit) Analysis, 2021 to 2025
- Current and Future Market Size Value (USD Billion) & Volume (Unit) Projections, 2026 to 2036
- Y-o-Y Growth Trend Analysis
- Absolute $ Opportunity Analysis
- Global Market Pricing Analysis, 2021 to 2036
- Global Market Analysis and Forecast, By Kit Type, 2021 to 2036
- Introduction / Key Findings
- Historical Market Size Value (USD Billion) & Volume (Unit) Analysis By Kit Type, 2021 to 2025
- Current and Future Market Size Value (USD Billion) & Volume (Unit) Analysis and Forecast By Kit Type, 2026 to 2036
- Seat-centric kits
- Suite modules
- Lounge and storage kits
- Ambience kits
- Seat-centric kits
- Y-o-Y Growth Trend Analysis By Kit Type, 2021 to 2025
- Absolute $ Opportunity Analysis By Kit Type, 2026 to 2036
- Global Market Analysis and Forecast, By Aircraft Platform, 2021 to 2036
- Introduction / Key Findings
- Historical Market Size Value (USD Billion) & Volume (Unit) Analysis By Aircraft Platform, 2021 to 2025
- Current and Future Market Size Value (USD Billion) & Volume (Unit) Analysis and Forecast By Aircraft Platform, 2026 to 2036
- Widebody retrofit
- Narrowbody premium
- Business jet cabin
- Regional premium
- Widebody retrofit
- Y-o-Y Growth Trend Analysis By Aircraft Platform, 2021 to 2025
- Absolute $ Opportunity Analysis By Aircraft Platform, 2026 to 2036
- Global Market Analysis and Forecast, By Cabin Class, 2021 to 2036
- Introduction / Key Findings
- Historical Market Size Value (USD Billion) & Volume (Unit) Analysis By Cabin Class, 2021 to 2025
- Current and Future Market Size Value (USD Billion) & Volume (Unit) Analysis and Forecast By Cabin Class, 2026 to 2036
- Business class
- Premium economy
- First class
- Leisure lounge
- Business class
- Y-o-Y Growth Trend Analysis By Cabin Class, 2021 to 2025
- Absolute $ Opportunity Analysis By Cabin Class, 2026 to 2036
- Global Market Analysis and Forecast, By Sales Model, 2021 to 2036
- Introduction / Key Findings
- Historical Market Size Value (USD Billion) & Volume (Unit) Analysis By Sales Model, 2021 to 2025
- Current and Future Market Size Value (USD Billion) & Volume (Unit) Analysis and Forecast By Sales Model, 2026 to 2036
- Retrofit programs
- Linefit packages
- Component upgrades
- Retrofit programs
- Y-o-Y Growth Trend Analysis By Sales Model, 2021 to 2025
- Absolute $ Opportunity Analysis By Sales Model, 2026 to 2036
- Global Market Analysis and Forecast, By Installation Channel, 2021 to 2036
- Introduction / Key Findings
- Historical Market Size Value (USD Billion) & Volume (Unit) Analysis By Installation Channel, 2021 to 2025
- Current and Future Market Size Value (USD Billion) & Volume (Unit) Analysis and Forecast By Installation Channel, 2026 to 2036
- MRO-led installation
- Airline engineering
- OEM integration
- MRO-led installation
- Y-o-Y Growth Trend Analysis By Installation Channel, 2021 to 2025
- Absolute $ Opportunity Analysis By Installation Channel, 2026 to 2036
- Global Market Analysis and Forecast, By Region, 2021 to 2036
- Introduction
- Historical Market Size Value (USD Billion) & Volume (Unit) Analysis By Region, 2021 to 2025
- Current Market Size Value (USD Billion) & Volume (Unit) Analysis and Forecast By Region, 2026 to 2036
- North America
- Latin America
- Western Europe
- Eastern Europe
- East Asia
- South Asia and Pacific
- Middle East & Africa
- Market Attractiveness Analysis By Region
- North America Market Analysis and Forecast, By Country, 2021 to 2036
- Historical Market Size Value (USD Billion) & Volume (Unit) Trend Analysis By Market Taxonomy, 2021 to 2025
- Market Size Value (USD Billion) & Volume (Unit) Forecast By Market Taxonomy, 2026 to 2036
- By Country
- USA
- Canada
- Mexico
- By Kit Type
- By Aircraft Platform
- By Cabin Class
- By Sales Model
- By Installation Channel
- By Country
- Market Attractiveness Analysis
- By Country
- By Kit Type
- By Aircraft Platform
- By Cabin Class
- By Sales Model
- By Installation Channel
- Key Takeaways
- Latin America Market Analysis and Forecast, By Country
- Historical Market Size Value (USD Billion) & Volume (Unit) Trend Analysis By Market Taxonomy, 2021 to 2025
- Market Size Value (USD Billion) & Volume (Unit) Forecast By Market Taxonomy, 2026 to 2036
- By Country
- Brazil
- Chile
- Rest of Latin America
- By Kit Type
- By Aircraft Platform
- By Cabin Class
- By Sales Model
- By Installation Channel
- By Country
- Market Attractiveness Analysis
- By Country
- By Kit Type
- By Aircraft Platform
- By Cabin Class
- By Sales Model
- By Installation Channel
- Key Takeaways
- Western Europe Market Analysis and Forecast, By Country
- Historical Market Size Value (USD Billion) & Volume (Unit) Trend Analysis By Market Taxonomy, 2021 to 2025
- Market Size Value (USD Billion) & Volume (Unit) Forecast By Market Taxonomy, 2026 to 2036
- By Country
- Germany
- UK
- Italy
- Spain
- France
- Nordic
- BENELUX
- Rest of Western Europe
- By Kit Type
- By Aircraft Platform
- By Cabin Class
- By Sales Model
- By Installation Channel
- By Country
- Market Attractiveness Analysis
- By Country
- By Kit Type
- By Aircraft Platform
- By Cabin Class
- By Sales Model
- By Installation Channel
- Key Takeaways
- Eastern Europe Market Analysis and Forecast, By Country
- Historical Market Size Value (USD Billion) & Volume (Unit) Trend Analysis By Market Taxonomy, 2021 to 2025
- Market Size Value (USD Billion) & Volume (Unit) Forecast By Market Taxonomy, 2026 to 2036
- By Country
- Russia
- Poland
- Hungary
- Balkan & Baltic
- Rest of Eastern Europe
- By Kit Type
- By Aircraft Platform
- By Cabin Class
- By Sales Model
- By Installation Channel
- By Country
- Market Attractiveness Analysis
- By Country
- By Kit Type
- By Aircraft Platform
- By Cabin Class
- By Sales Model
- By Installation Channel
- Key Takeaways
- East Asia Market Analysis and Forecast, By Country
- Historical Market Size Value (USD Billion) & Volume (Unit) Trend Analysis By Market Taxonomy, 2021 to 2025
- Market Size Value (USD Billion) & Volume (Unit) Forecast By Market Taxonomy, 2026 to 2036
- By Country
- China
- Japan
- South Korea
- By Kit Type
- By Aircraft Platform
- By Cabin Class
- By Sales Model
- By Installation Channel
- By Country
- Market Attractiveness Analysis
- By Country
- By Kit Type
- By Aircraft Platform
- By Cabin Class
- By Sales Model
- By Installation Channel
- Key Takeaways
- South Asia and Pacific Market Analysis and Forecast, By Country
- Historical Market Size Value (USD Billion) & Volume (Unit) Trend Analysis By Market Taxonomy, 2021 to 2025
- Market Size Value (USD Billion) & Volume (Unit) Forecast By Market Taxonomy, 2026 to 2036
- By Country
- India
- ASEAN
- Australia & New Zealand
- Rest of South Asia and Pacific
- By Kit Type
- By Aircraft Platform
- By Cabin Class
- By Sales Model
- By Installation Channel
- By Country
- Market Attractiveness Analysis
- By Country
- By Kit Type
- By Aircraft Platform
- By Cabin Class
- By Sales Model
- By Installation Channel
- Key Takeaways
- Middle East & Africa Market Analysis and Forecast, By Country
- Historical Market Size Value (USD Billion) & Volume (Unit) Trend Analysis By Market Taxonomy, 2021 to 2025
- Market Size Value (USD Billion) & Volume (Unit) Forecast By Market Taxonomy, 2026 to 2036
- By Country
- Kingdom of Saudi Arabia
- Other GCC Countries
- Türkiye
- South Africa
- Other African Union
- Rest of Middle East & Africa
- By Kit Type
- By Aircraft Platform
- By Cabin Class
- By Sales Model
- By Installation Channel
- By Country
- Market Attractiveness Analysis
- By Country
- By Kit Type
- By Aircraft Platform
- By Cabin Class
- By Sales Model
- By Installation Channel
- Key Takeaways
- Key Countries Market Analysis
- USA
- Pricing Analysis
- Market Share Analysis, 2025
- By Kit Type
- By Aircraft Platform
- By Cabin Class
- By Sales Model
- By Installation Channel
- Canada
- Pricing Analysis
- Market Share Analysis, 2025
- By Kit Type
- By Aircraft Platform
- By Cabin Class
- By Sales Model
- By Installation Channel
- Mexico
- Pricing Analysis
- Market Share Analysis, 2025
- By Kit Type
- By Aircraft Platform
- By Cabin Class
- By Sales Model
- By Installation Channel
- Brazil
- Pricing Analysis
- Market Share Analysis, 2025
- By Kit Type
- By Aircraft Platform
- By Cabin Class
- By Sales Model
- By Installation Channel
- Chile
- Pricing Analysis
- Market Share Analysis, 2025
- By Kit Type
- By Aircraft Platform
- By Cabin Class
- By Sales Model
- By Installation Channel
- Germany
- Pricing Analysis
- Market Share Analysis, 2025
- By Kit Type
- By Aircraft Platform
- By Cabin Class
- By Sales Model
- By Installation Channel
- UK
- Pricing Analysis
- Market Share Analysis, 2025
- By Kit Type
- By Aircraft Platform
- By Cabin Class
- By Sales Model
- By Installation Channel
- Italy
- Pricing Analysis
- Market Share Analysis, 2025
- By Kit Type
- By Aircraft Platform
- By Cabin Class
- By Sales Model
- By Installation Channel
- Spain
- Pricing Analysis
- Market Share Analysis, 2025
- By Kit Type
- By Aircraft Platform
- By Cabin Class
- By Sales Model
- By Installation Channel
- France
- Pricing Analysis
- Market Share Analysis, 2025
- By Kit Type
- By Aircraft Platform
- By Cabin Class
- By Sales Model
- By Installation Channel
- India
- Pricing Analysis
- Market Share Analysis, 2025
- By Kit Type
- By Aircraft Platform
- By Cabin Class
- By Sales Model
- By Installation Channel
- ASEAN
- Pricing Analysis
- Market Share Analysis, 2025
- By Kit Type
- By Aircraft Platform
- By Cabin Class
- By Sales Model
- By Installation Channel
- Australia & New Zealand
- Pricing Analysis
- Market Share Analysis, 2025
- By Kit Type
- By Aircraft Platform
- By Cabin Class
- By Sales Model
- By Installation Channel
- China
- Pricing Analysis
- Market Share Analysis, 2025
- By Kit Type
- By Aircraft Platform
- By Cabin Class
- By Sales Model
- By Installation Channel
- Japan
- Pricing Analysis
- Market Share Analysis, 2025
- By Kit Type
- By Aircraft Platform
- By Cabin Class
- By Sales Model
- By Installation Channel
- South Korea
- Pricing Analysis
- Market Share Analysis, 2025
- By Kit Type
- By Aircraft Platform
- By Cabin Class
- By Sales Model
- By Installation Channel
- Russia
- Pricing Analysis
- Market Share Analysis, 2025
- By Kit Type
- By Aircraft Platform
- By Cabin Class
- By Sales Model
- By Installation Channel
- Poland
- Pricing Analysis
- Market Share Analysis, 2025
- By Kit Type
- By Aircraft Platform
- By Cabin Class
- By Sales Model
- By Installation Channel
- Hungary
- Pricing Analysis
- Market Share Analysis, 2025
- By Kit Type
- By Aircraft Platform
- By Cabin Class
- By Sales Model
- By Installation Channel
- Kingdom of Saudi Arabia
- Pricing Analysis
- Market Share Analysis, 2025
- By Kit Type
- By Aircraft Platform
- By Cabin Class
- By Sales Model
- By Installation Channel
- Türkiye
- Pricing Analysis
- Market Share Analysis, 2025
- By Kit Type
- By Aircraft Platform
- By Cabin Class
- By Sales Model
- By Installation Channel
- South Africa
- Pricing Analysis
- Market Share Analysis, 2025
- By Kit Type
- By Aircraft Platform
- By Cabin Class
- By Sales Model
- By Installation Channel
- USA
- Market Structure Analysis
- Competition Dashboard
- Competition Benchmarking
- Market Share Analysis of Top Players
- By Regional
- By Kit Type
- By Aircraft Platform
- By Cabin Class
- By Sales Model
- By Installation Channel
- Emerging Startups
- Innovation Benchmarking
- Competition Analysis
- Competition Deep Dive
- Safran Seats
- Overview
- Product Portfolio
- Profitability by Market Segments (Product/Region/Sales Channel)
- Sales Footprint
- Strategy Overview
- Marketing Strategy
- Product Strategy
- Channel Strategy
- Collins Aerospace
- Recaro Aircraft Seating
- Diehl Aviation
- Lufthansa Technik
- Thompson Aero Seating
- JAMCO Corporation
- Safran Seats
- Case Studies
- Success Stories
- Recent Developments
- Competition Deep Dive
- Assumptions & Acronyms Used


