

- Market Size (2026)
- USD 0.65 Bn
- Forecast (2036)
- USD 1.22 Bn
- CAGR (2026 to 2036)
- 6.5%
Pressure Bulkhead Inspection and Repair Services Market Size, Forecast, and Outlook By FMI
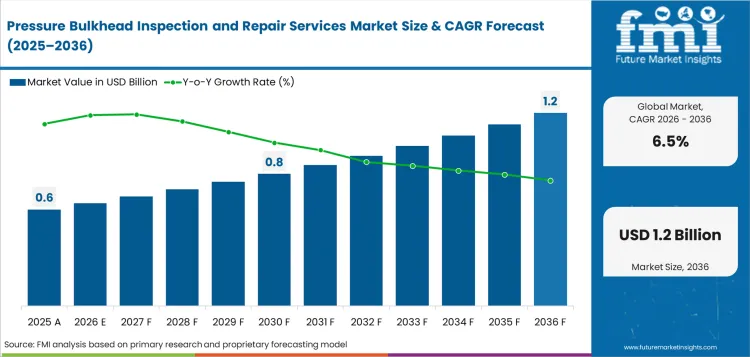
The pressure bulkhead inspection and repair services market was valued at USD 0.61 billion in 2025 and is projected to reach USD 0.65 billion in 2026. It is forecast to reach USD 1.22 billion by 2036 at 6.5% CAGR.
Summary of the Pressure Bulkhead Inspection and Repair Services Market
- Demand and Growth Drivers
- Airlines are giving more attention to pressure shell areas as aircraft stay active for longer operating cycles.
- Detailed inspections are gaining demand as pressure bulkhead access remains the first step in structural review.
- Wide-body aircraft are supporting service adoption as long-range jets need deeper fuselage inspection work.
- OEM-authorized maintenance providers are gaining share as airlines prefer approved repair data and release papers.
- Product and Segment View
- Detailed inspections are projected to account for 38.0% share in 2026 as access checks remain the first work step.
- Structural repairs are forecast to account for 31.0% share in 2026 as findings need approved doublers and fastener work.
- Ultrasonic testing is expected to hold 28.0% share of inspection method demand in 2026 as hidden flaws need checks without cutting.
- The service category connects with aircraft automated inspection and monitoring as airlines seek digital records for repeated structural checks.
- Geography and Competitive Outlook
- India is expected to post 8.1% CAGR through 2036 as local MRO capacity builds around fast fleet growth.
- China is projected at 7.4% CAGR through 2036 as domestic fleet scale increases pressure on local structural shops.
- Lufthansa Technik and ST Engineering define global service depth through heavy maintenance and airframe repair capacity.
- AAR and HAECO increase exposure in North America and Asia as heavy check capacity is expanded around airline contracts.
- Analyst Opinion
- Nikhil Kaitwade of FMI says "Pressure bulkhead services are not a routine inspection line. They operate where fuselage safety, access time and approved repair data meet. Airlines will favor providers that can combine nondestructive testing, structural repair approval and clean release paperwork. Preferred service shops will reduce aircraft downtime and help operators avoid weak documentation risk."
- Pressure Bulkhead Inspection and Repair Services Market Value Analysis
- Market value is rising as structural findings often convert inspection work into higher-value repair packages.
- Heavy maintenance visits raise service value because bulkhead access can be planned with other airframe work.
- Compliance packages support premium pricing as airlines need clean documentation after every approved repair.
- Non destructive testing adds value as hidden fatigue issues require skilled inspection before repair approval.
Key Takeaways, Market Size, and Forecast
- The pressure bulkhead inspection and repair services market was valued at USD 0.61 billion in 2025.
- By 2036, the pressure bulkhead inspection and repair services market is forecast to reach USD 1.22 billion.
- From 2026 to 2036, the market is set to expand at 6.5% CAGR.
- The market is forecast to create an incremental opportunity of USD 0.57 billion between 2026 and 2036.
- Detailed inspections are projected to account for 38.0% share of service type demand in 2026.
- Commercial airlines are estimated to account for 55.0% share of end user demand in 2026.
- India at 8.1% CAGR and China at 7.4% CAGR are the some of the lucrative growth markets.
Pressure bulkhead inspection and repair service demand is moving into scheduled maintenance planning as regulators continue to identify fuselage and bulkhead risks. In December 2025, the FAA adopted a rule for certain Boeing 787 aircraft after reports of forward pressure bulkhead nonconformances. The directive requires internal and external detailed inspections of the forward pressure bulkhead and on-condition actions.
EASA issued a separate April 2025 directive for Airbus A320 family aircraft covering centre fuselage skin and forward pressure bulkhead inspection. These actions show that airlines need trained inspection teams and approved structural repair capability near pressurized fuselage sections. MRO providers with nondestructive inspection capacity and OEM-approved repair procedures can capture more work as fleets age and compliance windows tighten.
Pressure Bulkhead Inspection and Repair Services Market Definition
The pressure bulkhead inspection and repair services market covers paid inspection and repair work on forward or aft bulkhead structures that seal the pressurized cabin. Scope includes access preparation and visual checks. Scope includes nondestructive testing and approved repair actions. Revenue covers labor and engineering review. Revenue includes fastener work and release documentation. The category is a focused part of air transport MRO and airframe heavy maintenance.
Pressure Bulkhead Inspection and Repair Services Market Inclusions
Market scope includes inspections of forward pressure bulkheads and aft pressure bulkheads on commercial aircraft. Service type includes detailed inspections and structural repairs. Compliance packages and documentation support complete the service scope. Inspection method includes visual inspection and ultrasonic testing. Eddy current testing and digital imaging are used when findings need closer review. Provider type includes OEM-authorized MROs and independent MROs. Airline engineering shops support selected work packages. End users include commercial airlines and cargo operators. Lessors and business aviation fleets are included when work is sold as a paid service.
Pressure Bulkhead Inspection and Repair Services Market Exclusions
Scope does not include general fuselage painting, cabin trim work or nonpressurized bulkhead panels. Engine repair, landing gear overhaul and avionics bench repair are excluded unless the contract directly includes pressure bulkhead access or release work. New aircraft production bulkhead assembly is excluded unless a service provider is paid to inspect or repair an in-service aircraft.
Pressure Bulkhead Inspection and Repair Services Market Research Methodology
- Primary Research: FMI analysts reviewed airline maintenance planning and airframe shop capability. They reviewed structural engineering workflows and release documentation needs in major aviation countries.
- Desk Research: The study used public information from aviation regulators and airport bodies. Aircraft manufacturer material and official MRO company releases were used for service capacity signals.
- Market sizing and forecasting: Market size was estimated through a hybrid bottom-up and top-down method. Heavy maintenance volume, aircraft type mix and pressure bulkhead access frequency were used to establish the forecast.
- Data validation: Forecast checks compared air traffic recovery and commercial fleet outlooks. Airworthiness directives and airframe MRO capacity announcements were used for repair need validation.
Why is the Pressure Bulkhead Inspection and Repair Services Market Growing?
- Longer aircraft use is raising demand for fuselage pressure shell checks during planned heavy maintenance.
- Wide-body aircraft need deeper access work as pressure bulkheads are harder to inspect during short line checks.
- Approved structural repair data has value as regulators ask operators to show tighter compliance records.
Pressure bulkhead work gains from the same airline maintenance factors affecting commercial aircraft MRO across airline networks. The International Air Transport Association reported that full-year 2024 passenger traffic rose 10.4% versus 2023. Higher aircraft use increases cabin pressurization cycles and gives operators fewer spare days for deep structural access. Service providers that can plan work inside heavy checks will gain from this time pressure.
Supply chain delays are keeping older aircraft active across many fleets. The International Air Transport Association estimated that aircraft and parts bottlenecks could cost airlines more than USD 11 billion in 2025. That includes higher maintenance costs as older fleets need more work. Pressure bulkhead repair providers benefit when operators keep aircraft flying and must manage structural findings without long grounding periods.
Market Segmentation Analysis
- Detailed inspections are projected to reach 38.0% share in 2026 as first-stage access checks drive work orders.
- Wide-body aircraft are expected to represent 46.0% share in 2026 as long-haul fleets need deeper fuselage access.
- Visual inspection is forecast to account for 34.0% share in 2026 as documented surface checks start most workflows.
- OEM-authorized MROs are projected to capture 42.0% share in 2026 as release paperwork drives provider choice.
- Commercial airlines are estimated to account for 55.0% share of end user demand in 2026 as utilization stays high.
The market is divided into five segment groups based on service type and aircraft type. Inspection method, provider type and end user complete the view. Service type explains whether the order is inspection first or repair led. Aircraft type separates wide-body pressure shell work from narrow-body programs. Inspection method reflects the choice between visual checks and non destructive testing inspection service work. Provider type explains who carries the repair approval burden.
Insights into the Detailed Inspections Service Type Segment
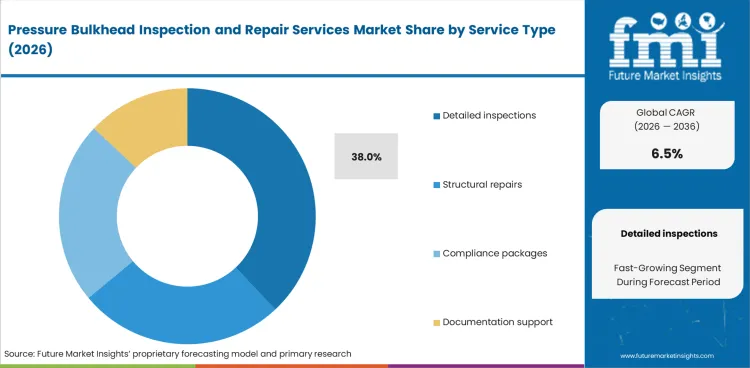
- Detailed inspections are projected to account for 38.0% share of service type demand in 2026. This service remains the first work step when operators need access panels removed and bulkhead surfaces checked.
- Repair orders depend on what the inspection finds. That keeps detailed inspection packages central to work planning and job card sequencing.
Insights into the Wide-Body Aircraft Segment
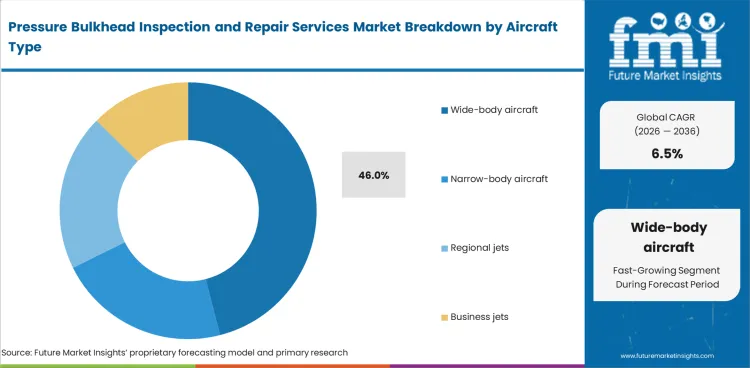
- Wide-body aircraft are expected to represent 46.0% share in 2026. Long-range jets have larger pressure structures and tighter downtime costs.
- Narrow-body aircraft still create frequent work volumes. Wide-body checks carry higher value as access work and release documents take more engineering time.
Insights into the Visual Inspection Method Segment
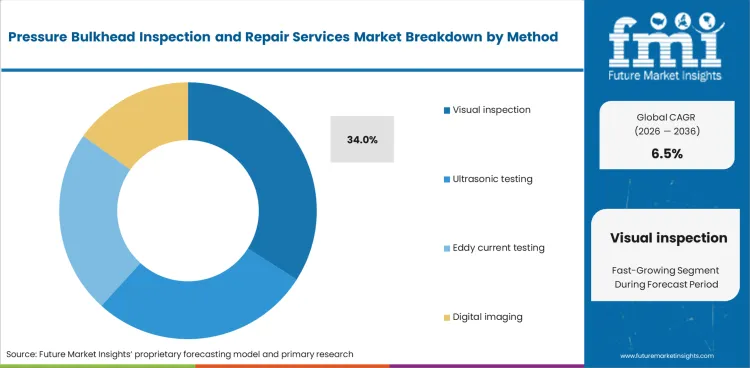
- Visual inspection is forecast to account for 34.0% share of inspection method demand in 2026. Detailed surface checks are needed before deeper testing is selected.
- Ultrasonic and eddy current methods are used when hidden flaws or fastener row concerns need confirmation. This keeps visual inspection as the entry point.
Insights into the OEM-Authorized MRO Provider Segment
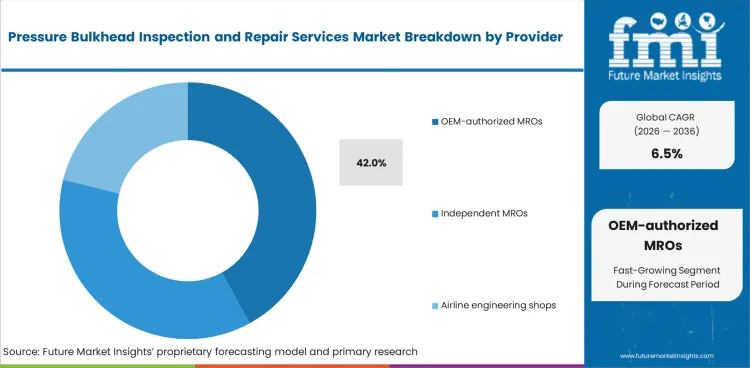
- OEM-authorized MROs are projected to account for 42.0% share of provider type demand in 2026. Operators value approved repair routes and clean release documents.
- Independent MROs compete well on turnaround and cost. OEM-backed providers hold ground when complex structural repairs need engineering sign-off.
Insights into the Commercial Airlines End User Segment
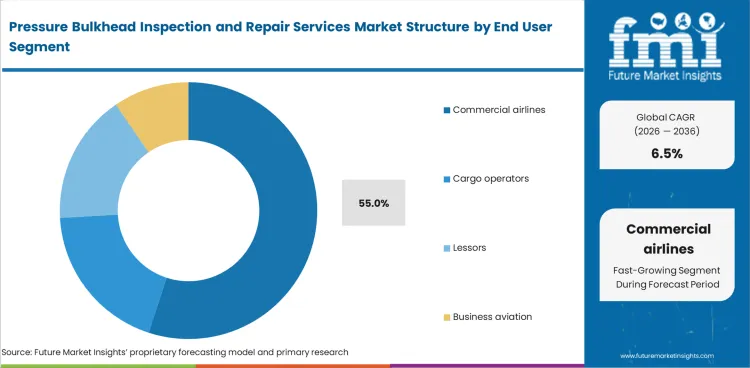
- Commercial airlines are estimated to account for 55.0% share of end user demand in 2026. High aircraft use makes planned bulkhead checks necessary during heavy maintenance.
- Cargo operators create steady demand as freighters often use older airframes. Lessors focus on transfer checks before aircraft move between operators.
Pressure Bulkhead Inspection and Repair Services Market Drivers Restraints and Opportunities
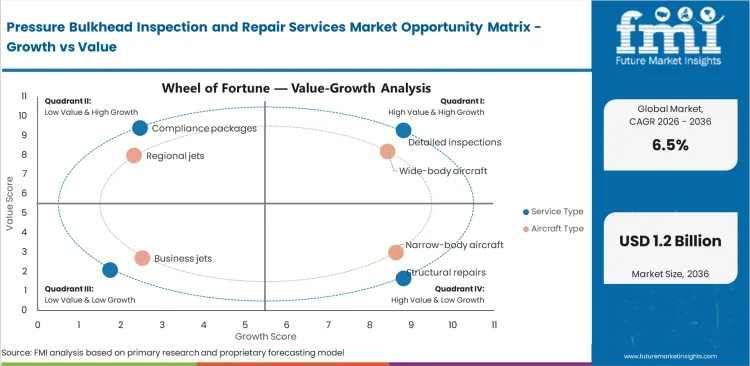
- Fleet age is raising demand for pressure shell checks during scheduled heavy maintenance.
- Access time slows service scale as bulkhead work can remove aircraft from service for longer periods.
- Digital inspection records create opportunity for providers that can link findings with approved repairs.
Fleet age is one of the primary driver behind pressure bulkhead inspection services. Airbus projected in October 2025 that the global commercial fleet would expand to over 49,000 aircraft by 2044. Older and larger fleets create more scheduled heavy checks and more structural review points. This raises demand for service shops with fuselage access skill and repair paperwork depth.
Access Time Limits Shop Throughput
Pressure bulkhead work is difficult to scale as access panels, insulation and nearby systems must be protected before inspection starts. A finding can turn a planned check into a repair visit with extra engineering review. This makes labor planning and hangar slots more important than the inspection method alone. Operators will favor providers that can control access time and avoid repeat openings.
Digital Records Create Repair Value
The strongest opportunity sits in inspection records that can be tied to repair history and release documents. Providers using aviation test equipment can reduce uncertainty during follow-up checks. Better records help airlines show regulators when a repair was performed and what limits apply. This shifts value toward shops that combine test equipment, engineering review and record control.
Analysis of Pressure Bulkhead Inspection and Repair Services Market by Key Countries
.webp "Top Country Growth Comparison Pressure Bulkhead Inspection And Repair Services Market Cagr (2026 2036)")
| Country | CAGR |
|---|---|
| United States | 5.9% |
| China | 7.4% |
| India | 8.1% |
| Germany | 5.4% |
| Singapore | 6.9% |
| United Kingdom | 5.8% |
| United Arab Emirates | 6.8% |
Source: Future Market Insights, 2026.
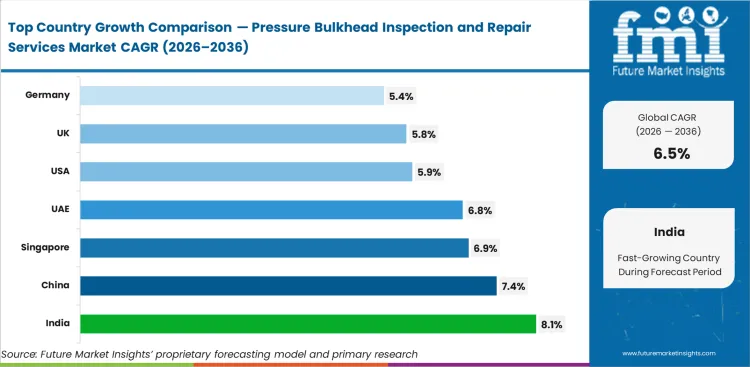
Pressure Bulkhead Inspection and Repair Services Market CAGR Analysis by Country
- India is expected to post 8.1% CAGR by 2036 as local heavy maintenance capacity expands around fleet growth.
- China is projected to record 7.4% CAGR by 2036 as domestic aircraft scale raises local inspection demand.
- Singapore is forecast at 6.9% CAGR by 2036 as regional fleets use the country for airframe work.
- The United Arab Emirates is set to advance at 6.8% CAGR by 2036 as wide-body airline hubs increase structural workloads.
- The United States and Germany show steadier expansion at 5.9% CAGR and 5.4% CAGR as mature shop networks already cover much demand.
Demand for pressure bulkhead inspection and repair services is forecast to rise at 6.5% CAGR from 2026 to 2036. Country-level analysis covers major aviation markets with large commercial fleets, airframe MRO capacity and regulatory pressure on structural records.
Demand Outlook for Pressure Bulkhead Inspection and Repair Services in the United States
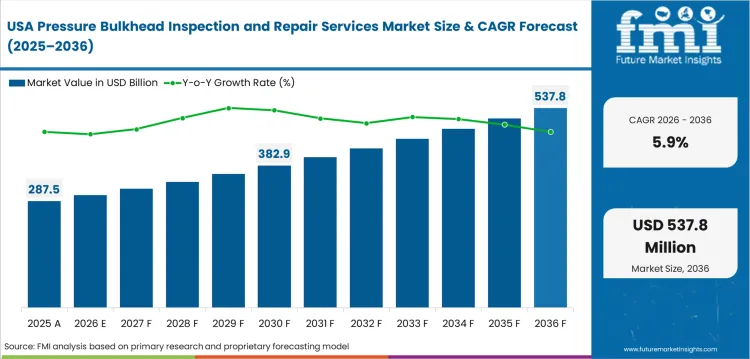
The United States is forecast to record a 5.9% CAGR through 2036 as regulator actions keep structural inspections in view. The Federal Aviation Administration published a December 2025 final rule for certain Boeing 787 aircraft that requires detailed forward pressure bulkhead inspections. This rule gives airframe shops a clear compliance route for access planning and repair follow-up. Providers in Oklahoma, Texas and Florida can serve large airline fleets with heavy maintenance depth.
- Oklahoma City shops benefit from narrow-body and wide-body hangar expansion around heavy checks.
- Texas repair stations can pair structural work with airline engineering support and parts access.
- Florida MRO locations gain from airline traffic flows and leased aircraft transfer activity.
Sales Analysis of Pressure Bulkhead Inspection and Repair Services in China
China is forecast to expand at 7.4% CAGR through 2036 as fleet scale widens the addressable inspection pool. The Civil Aviation Administration of China reported in April 2026 that China had 4,574 commercial aircraft at the end of 2025. Local operators need faster access to structural inspection capacity as fleets grow. Airframe shops in Shanghai, Guangzhou and Chengdu are positioned to absorb more repeat structural work.
- Shanghai is important as airlines and aircraft manufacturers build technical depth around local fleets.
- Guangzhou creates demand through large airline maintenance needs and high aircraft activity.
- Chengdu can support western China fleets that need local heavy maintenance access.
Demand Outlook for Pressure Bulkhead Inspection and Repair Services in India
India is set to grow at 8.1% CAGR through 2036 as local MRO capacity rises from a low starting point. India’s Ministry of Civil Aviation reported in April 2025 that domestic air passenger traffic reached 228.1 million in 2024. This traffic level raises aircraft use and creates more heavy maintenance needs. Local providers can reduce ferry time when pressure bulkhead findings need quick repair action.
- Bengaluru gains from airline MRO investment and a growing aerospace skill pool.
- Nagpur can serve central India fleets with hangar space and repair station approvals.
- Delhi and Mumbai create demand as high traffic routes place more cycles on narrow-body aircraft.
Opportunity Analysis of Pressure Bulkhead Inspection and Repair Services in Germany
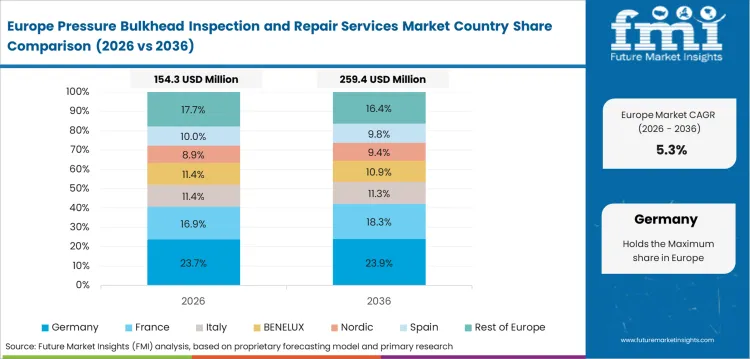
Germany is expected to advance at 5.4% CAGR through 2036 as mature aviation maintenance networks handle complex structural work. The Federal Statistical Office reported 207.2 million passengers at German main airports in 2025. That activity keeps aircraft use high enough to support recurring heavy checks. German providers are expected to focus on documentation strength and high-standard repair release work.
- Hamburg has deep aircraft services skills and direct access to Lufthansa Technik capacity.
- Frankfurt keeps demand steady through long-haul aircraft activity and airline maintenance planning.
- Munich supports long-haul airline fleets that value detailed release documentation.
Future Outlook for Pressure Bulkhead Inspection and Repair Services in Singapore
Singapore is forecast to rise at 6.9% CAGR through 2036 as regional fleets use the country as an MRO hub. Changi Airport Group recorded 17.6 million passenger movements in the first quarter of 2026. Regional aircraft flows make Singapore useful for planned checks and unscheduled structural findings. Providers with airframe engineering and parts coordination can capture cross-border service demand.
- Seletar aerospace park gives providers access to skilled labor and nearby aviation suppliers.
- Changi activity keeps the country connected to regional airline scheduling needs.
- Singapore shops can win work when operators need English documentation and recognized release standards.
Sales Analysis of Pressure Bulkhead Inspection and Repair Services in the United Kingdom
The United Kingdom is set to expand at 5.8% CAGR through 2036 as airline activity stays above prior records. The United Kingdom Civil Aviation Authority reported 302 million passenger journeys through UK airports in 2025. High airport activity raises the need for disciplined maintenance planning across fleets. UK providers can compete on inspection control and repair release quality.
- London airline activity supports demand for pressure shell checks on long-haul aircraft.
- Manchester and Birmingham offer access points for narrow-body heavy maintenance programs.
- Regional business jet fleets create smaller but repeat demand for structural inspections.
Future Outlook for Pressure Bulkhead Inspection and Repair Services in the United Arab Emirates
The United Arab Emirates is forecast to post 6.8% CAGR through 2036 as wide-body hub operations keep aircraft heavily used. Dubai Airports reported that Dubai International welcomed 95.2 million guests in 2025. Long-haul operations create higher value structural service needs for wide-body fleets. The practical result is demand for providers that can plan bulkhead work inside heavy checks.
- Dubai creates demand for wide-body inspection planning and release documentation.
- Abu Dhabi supports growth as airline fleets add long-haul aircraft and maintenance scope.
- Regional operators value local structural capacity that reduces ferry time to Europe or Asia.
Competitive Landscape and Strategic Positioning
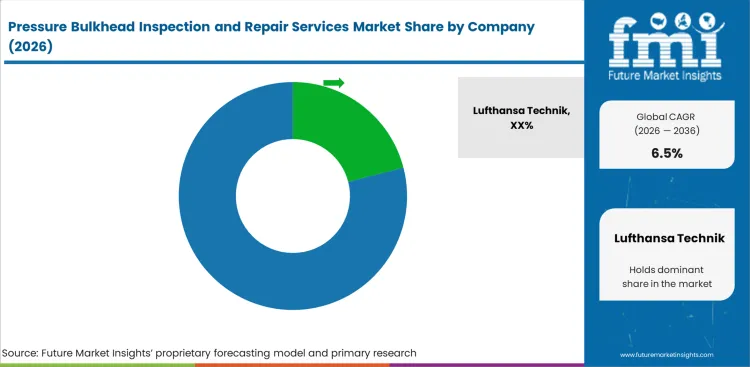
- The market is concentrated around airframe structural depth and hangar access.
- Lufthansa Technik and ST Engineering define global service depth through wide heavy maintenance coverage.
- AAR and HAECO benefit from capacity expansion in North America and Asia.
- Entry barriers include trained structures teams and access to OEM repair instructions.
Airframe depth is one of the significant competitive filter in pressure bulkhead inspection and repair services. ST Engineering opened a greenfield airframe MRO facility in Ezhou in August 2025 with SF Airlines. That move expands structural maintenance access in China and gives cargo fleets more local heavy check capacity. Service providers with repeat airframe programs are better placed than shops focused only on line maintenance.
AAR is expanding its North American position through heavy maintenance capacity. The company announced in January 2026 that its Oklahoma City expansion added over 80,000 square feet and three maintenance bays for Boeing 737 variants. That capacity directly backs airframe inspection work. The same footprint can support pressure bulkhead access jobs when inspections are folded into heavy checks.
HAECO and Lufthansa Technik compete through large aircraft programs and operator trust. HAECO extended heavy maintenance work for Emirates A380 aircraft through 2030 in November 2025. Lufthansa Technik renewed seven years of heavy maintenance work with easyJet in October 2025. These agreements show that airlines still award major structural work to providers with proven hangar process control.
Technical differentiation is shifting toward records and repeat inspection history. Rising demand for aircraft structural health monitoring coatings and aircraft fuselage corrosion monitoring sensors shows how airframe maintenance is moving toward evidence-rich inspection programs. Pressure bulkhead providers that can turn findings into repair decisions will protect margin as competition grows.
Key Companies in the Pressure Bulkhead Inspection and Repair Services Market
Competition is best assessed by role as OEM engineering, global MRO networks and airline-affiliated shops serve different needs.
- Global Airframe MRO Leaders: Lufthansa Technik and ST Engineering hold solid positions through heavy maintenance depth and broad operator access. AAR and HAECO add high-volume airframe capacity in North America and Asia. These providers can combine hangar access with structural work planning.
- OEM and Engineering-Centered Providers: Airbus Services and Boeing Global Services influence repair instructions, service bulletins and approved engineering routes. Their role is clearer when findings require tight alignment with aircraft design data.
- Airline-Affiliated Specialists: Air France Industries KLM Engineering & Maintenance supports airlines that need release paperwork, component support and maintenance planning together. This role is useful for fleets that want bulkhead work tied to wider airframe programs.
Competitive Benchmarking: Pressure Bulkhead Inspection and Repair Services Market
| Company | Airframe Access Depth | Repair Data Control | Release Documentation Support | Geographic Footprint |
|---|---|---|---|---|
| Lufthansa Technik | High | Strong | Strong | Global with Germany and Malta wide-body depth |
| ST Engineering | High | Strong | Strong | Asia centered with global airframe MRO reach |
| AAR | High | Medium | Strong | North America centered with expanding heavy maintenance bays |
| HAECO | High | Strong | Medium | Asia centered with wide-body and cargo MRO depth |
| Air France Industries KLM E&M | Medium | Strong | Strong | Europe centered with airline-affiliated engineering depth |
| Airbus Services | Medium | High | Strong | Global OEM with Airbus repair data and service support |
| Boeing Global Services | Medium | High | Strong | Global OEM with Boeing repair data and operator support |
Source: Future Market Insights competitive analysis, 2026. Ratings reflect relative positioning based on airframe access depth, repair data control and release documentation support.
Key Developments in Pressure Bulkhead Inspection and Repair Services Market
- In January 2026, AAR announced an Oklahoma City expansion with over 80,000 square feet and three Boeing 737-capable bays.
- In September 2025, HAECO and Satair expanded their strategic supply agreement to include Airbus Standard Parts across HAECO operating companies.
- In February 2025, Air France Industries KLM Engineering & Maintenance signed a ten-year component support contract for Air Canada Boeing 787 aircraft.
Key Players in the Pressure Bulkhead Inspection and Repair Services Market
Major Global Players:
- Lufthansa Technik
- ST Engineering
- AAR
- HAECO
OEM and Airline-Affiliated Players:
- Airbus Services
- Boeing Global Services
- Air France Industries KLM Engineering & Maintenance
Report Scope and Coverage
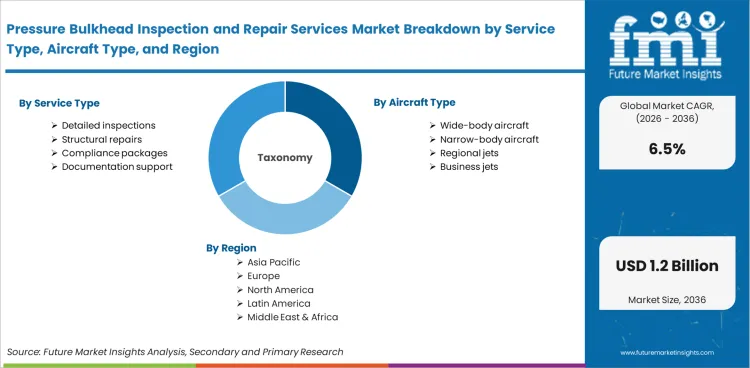
| Parameter | Details |
|---|---|
| Quantitative Units | USD 0.65 billion to USD 1.22 billion at 6.5% CAGR |
| Market Definition | Inspection and repair services for aircraft pressure bulkhead structures |
| Service Type | Detailed inspections; Structural repairs; Compliance packages; Documentation support |
| Aircraft Type | Wide-body aircraft; Narrow-body aircraft; Regional jets; Business jets |
| Inspection Method | Visual inspection; Ultrasonic testing; Eddy current testing; Digital imaging |
| Provider Type | OEM-authorized MROs; Independent MROs; Airline engineering shops |
| End User | Commercial airlines; Cargo operators; Lessors; Business aviation |
| Regions Covered | North America; Latin America; Western Europe; Eastern Europe; East Asia; South Asia and Pacific; Middle East and Africa |
| Countries Covered | United States; China; India; Germany; Singapore; United Kingdom; United Arab Emirates; 30 plus countries |
| Key Companies Profiled | Lufthansa Technik; ST Engineering; AAR; HAECO; AFI KLM E&M; Airbus Services; Boeing Global Services |
| Forecast Period | 2026 to 2036 |
| Approach | Hybrid bottom-up and top-down method using heavy maintenance demand, airworthiness directives and MRO capacity signals |
Source: Future Market Insights, 2026.
Pressure Bulkhead Inspection and Repair Services Market by Segments
Pressure Bulkhead Inspection and Repair Services Market Segmented by Service Type:
- Detailed inspections
- Structural repairs
- Compliance packages
- Documentation support
Pressure Bulkhead Inspection and Repair Services Market Segmented by Aircraft Type:
- Wide-body aircraft
- Narrow-body aircraft
- Regional jets
- Business jets
Pressure Bulkhead Inspection and Repair Services Market Segmented by Inspection Method:
- Visual inspection
- Ultrasonic testing
- Eddy current testing
- Digital imaging
Pressure Bulkhead Inspection and Repair Services Market Segmented by Provider Type:
- OEM-authorized MROs
- Independent MROs
- Airline engineering shops
Pressure Bulkhead Inspection and Repair Services Market Segmented by End User:
- Commercial airlines
- Cargo operators
- Lessors
- Business aviation
Pressure Bulkhead Inspection and Repair Services Market Segmented by Region:
- North America
- United States
- Canada
- Mexico
- Latin America
- Brazil
- Chile
- Western Europe
- Germany
- United Kingdom
- France
- Italy
- Spain
- Eastern Europe
- Poland
- East Asia
- China
- Japan
- South Korea
- South Asia and Pacific
- India
- Singapore
- Australia and New Zealand
- Middle East and Africa
- United Arab Emirates
- Kingdom of Saudi Arabia
- South Africa
Research Sources and Bibliography
- 1. Airports Council International and International Civil Aviation Organization. (2025, January 28). Joint ACI World-ICAO passenger traffic report, trends and outlook.
- 2. Airbus. (2025, October 8). Airbus global services forecast 2025-2044.
- 3. Airbus. (2025, June 11). Airbus global market forecast 2025 people and commerce driving air traffic growth.
- 4. AAR Corp. (2026, January 28). AAR celebrates airframe MRO expansion in Oklahoma City.
- 5. AAR Corp. (2025, November 3). AAR acquires HAECO Americas and signs multi-year contracts with key customers.
- 6. Boeing. (2025). Commercial market outlook 2025-2044.
- 7. Civil Aviation Administration of China. (2026, April 22). CAAC releases statistical bulletin of civil aviation industry development in 2025.
- 8. Dubai Airports. (2026, February 11). DXB sets global benchmark as record traffic become the norm.
- 9. European Union Aviation Safety Agency. (2025, August 26). Annual safety review 2025.
- 10. Federal Aviation Administration. (2025, December 9). Airworthiness directives; The Boeing Company airplanes. Federal Register.
- 11. Federal Statistical Office of Germany. (2026, January 29). 3.9% more air passengers in 2025 than previous year. Destatis.
- 12. HAECO. (2025, November 17). HAECO extends heavy maintenance contract with Emirates for A380 aircraft.
- 13. International Air Transport Association. (2025, January 30). Global air passenger demand reaches record high in 2024.
- 14. International Air Transport Association. (2025, October 13). Supply chain challenges could cost airlines more than USD 11 billion in 2025.
- 15. Lufthansa Technik. (2025, October 15). easyJet again entrusts long-term base maintenance work to Lufthansa Technik Sofia.
- 16. Ministry of Civil Aviation. (2025, April 22). India’s aviation revolution. Press Information Bureau.
- 17. ST Engineering. (2025, August 11). ST Engineering and SF Airlines open greenfield airframe MRO facility in Ezhou, China.
- 18. United Kingdom Civil Aviation Authority. (2026, February 24). UK aviation officially breaks records with over 300m passenger journeys in 2025.
The bibliography is provided for reader reference. It uses government and regulatory sources. Trade body and official company sources support aircraft maintenance and pressure bulkhead service demand.
This Report Answers
- What is the current and future size of the pressure bulkhead inspection and repair services market?
- How fast is the pressure bulkhead inspection and repair services market expected to expand between 2026 and 2036?
- Which service type is expected to lead pressure bulkhead inspection and repair services demand by 2026?
- Which end user is projected to account for the leading pressure bulkhead inspection and repair services share in 2026?
- Why are detailed inspections important for pressure bulkhead inspection and repair services demand?
- How do airworthiness directives and aging fleets affect pressure bulkhead repair planning?
- Which countries are projected to record faster expansion during the forecast period?
- Who are the main companies active in pressure bulkhead inspection and airframe repair services?
- How does FMI define the pressure bulkhead inspection and repair services scope?
- How does FMI estimate and validate the pressure bulkhead inspection and repair services forecast?
Frequently Asked Questions
What is the global market demand for Pressure Bulkhead Inspection and Repair Services in 2026?
In 2026, the global pressure bulkhead inspection and repair services market is expected to be worth USD 0.65 billion as heavy checks deepen.
How big will the Pressure Bulkhead Inspection and Repair Services Market be in 2036?
By 2036, the pressure bulkhead inspection and repair services market is forecast to reach USD 1.22 billion as structural repair needs expand.
How much is demand for Pressure Bulkhead Inspection and Repair Services expected to expand between 2026 and 2036?
Between 2026 and 2036, pressure bulkhead inspection and repair services demand is set to expand at 6.5% CAGR as fleets age.
Which service type is expected to lead the Pressure Bulkhead Inspection and Repair Services Market by 2026?
Detailed inspections are projected to lead service type demand with 38.0% share in 2026 as operators start with documented surface checks.
Which end user is expected to lead Pressure Bulkhead Inspection and Repair Services demand in 2026?
Commercial airlines are expected to lead end user demand with 55.0% share in 2026 as utilization increases scheduled structural work.
Which country is forecast to grow fastest in the Pressure Bulkhead Inspection and Repair Services Market?
India is expected to post 8.1% CAGR through 2036 as fleet activity rises and local heavy maintenance capacity expands.
What does the Pressure Bulkhead Inspection and Repair Services Market include?
The market includes inspection and testing for forward and aft pressure bulkhead structures. The scope includes repair and release documentation for in-service aircraft.
How does FMI estimate the Pressure Bulkhead Inspection and Repair Services Market forecast?
FMI uses heavy maintenance activity and aircraft mix to validate the forecast. Regulator directives and company capacity signals support country assumptions.
How are pressure bulkheads inspected during aircraft maintenance?
Technicians remove access areas and check the bulkhead surface. They use nondestructive testing when needed and record findings for repair approval.
Preview the report firsthand - request a free sample
Get SampleGet the brochure for pricing and purchase details.
Get PDFTable of Content
- Executive Summary
- Global Market Outlook
- Demand-side Trends
- Supply-side Trends
- Technology Roadmap Analysis
- Analysis and Recommendations
- Market Overview
- Market Coverage / Taxonomy
- Market Definition / Scope / Limitations
- Research Methodology
- Chapter Orientation
- Analytical Lens and Working Hypotheses
- Market Structure, Signals, and Trend Drivers
- Benchmarking and Cross-market Comparability
- Market Sizing, Forecasting, and Opportunity Mapping
- Research Design and Evidence Framework
- Desk Research Programme (Secondary Evidence)
- Company Annual and Sustainability Reports
- Peer-reviewed Journals and Academic Literature
- Corporate Websites, Product Literature, and Technical Notes
- Earnings Decks and Investor Briefings
- Statutory Filings and Regulatory Disclosures
- Technical White Papers and Standards Notes
- Trade Journals, Industry Magazines, and Analyst Briefs
- Conference Proceedings, Webinars, and Seminar Materials
- Government Statistics Portals and Public Data Releases
- Press Releases and Reputable Media Coverage
- Specialist Newsletters and Curated Briefings
- Sector Databases and Reference Repositories
- FMI Internal Proprietary Databases and Historical Market Datasets
- Subscription Datasets and Paid Sources
- Social Channels, Communities, and Digital Listening Inputs
- Additional Desk Sources
- Expert Input and Fieldwork (Primary Evidence)
- Primary Modes
- Qualitative Interviews and Expert Elicitation
- Quantitative Surveys and Structured Data Capture
- Blended Approach
- Why Primary Evidence is Used
- Field Techniques
- Interviews
- Surveys
- Focus Groups
- Observational and In-context Research
- Social and Community Interactions
- Stakeholder Universe Engaged
- C-suite Leaders
- Board Members
- Presidents and Vice Presidents
- R&D and Innovation Heads
- Technical Specialists
- Domain Subject-matter Experts
- Scientists
- Physicians and Other Healthcare Professionals
- Governance, Ethics, and Data Stewardship
- Research Ethics
- Data Integrity and Handling
- Primary Modes
- Tooling, Models, and Reference Databases
- Desk Research Programme (Secondary Evidence)
- Data Engineering and Model Build
- Data Acquisition and Ingestion
- Cleaning, Normalisation, and Verification
- Synthesis, Triangulation, and Analysis
- Quality Assurance and Audit Trail
- Market Background
- Market Dynamics
- Drivers
- Restraints
- Opportunity
- Trends
- Scenario Forecast
- Demand in Optimistic Scenario
- Demand in Likely Scenario
- Demand in Conservative Scenario
- Opportunity Map Analysis
- Product Life Cycle Analysis
- Supply Chain Analysis
- Investment Feasibility Matrix
- Value Chain Analysis
- PESTLE and Porter’s Analysis
- Regulatory Landscape
- Regional Parent Market Outlook
- Production and Consumption Statistics
- Import and Export Statistics
- Market Dynamics
- Global Market Analysis 2021 to 2025 and Forecast, 2026 to 2036
- Historical Market Size Value (USD Million) Analysis, 2021 to 2025
- Current and Future Market Size Value (USD Million) Projections, 2026 to 2036
- Y-o-Y Growth Trend Analysis
- Absolute $ Opportunity Analysis
- Global Market Pricing Analysis 2021 to 2025 and Forecast 2026 to 2036
- Global Market Analysis 2021 to 2025 and Forecast 2026 to 2036, By Service Type
- Introduction / Key Findings
- Historical Market Size Value (USD Million) Analysis By Service Type , 2021 to 2025
- Current and Future Market Size Value (USD Million) Analysis and Forecast By Service Type , 2026 to 2036
- Detailed inspections
- Structural repairs
- Compliance packages
- Documentation support
- Detailed inspections
- Y-o-Y Growth Trend Analysis By Service Type , 2021 to 2025
- Absolute $ Opportunity Analysis By Service Type , 2026 to 2036
- Global Market Analysis 2021 to 2025 and Forecast 2026 to 2036, By Aircraft Type
- Introduction / Key Findings
- Historical Market Size Value (USD Million) Analysis By Aircraft Type, 2021 to 2025
- Current and Future Market Size Value (USD Million) Analysis and Forecast By Aircraft Type, 2026 to 2036
- Wide-body aircraft
- Narrow-body aircraft
- Regional jets
- Business jets
- Wide-body aircraft
- Y-o-Y Growth Trend Analysis By Aircraft Type, 2021 to 2025
- Absolute $ Opportunity Analysis By Aircraft Type, 2026 to 2036
- Global Market Analysis 2021 to 2025 and Forecast 2026 to 2036, By Method
- Introduction / Key Findings
- Historical Market Size Value (USD Million) Analysis By Method, 2021 to 2025
- Current and Future Market Size Value (USD Million) Analysis and Forecast By Method, 2026 to 2036
- Visual inspection
- Ultrasonic testing
- Eddy current testing
- Digital imaging
- Visual inspection
- Y-o-Y Growth Trend Analysis By Method, 2021 to 2025
- Absolute $ Opportunity Analysis By Method, 2026 to 2036
- Global Market Analysis 2021 to 2025 and Forecast 2026 to 2036, By Provider
- Introduction / Key Findings
- Historical Market Size Value (USD Million) Analysis By Provider, 2021 to 2025
- Current and Future Market Size Value (USD Million) Analysis and Forecast By Provider, 2026 to 2036
- OEM-authorized MROs
- Independent MROs
- Airline engineering shops
- OEM-authorized MROs
- Y-o-Y Growth Trend Analysis By Provider, 2021 to 2025
- Absolute $ Opportunity Analysis By Provider, 2026 to 2036
- Global Market Analysis 2021 to 2025 and Forecast 2026 to 2036, By End User
- Introduction / Key Findings
- Historical Market Size Value (USD Million) Analysis By End User, 2021 to 2025
- Current and Future Market Size Value (USD Million) Analysis and Forecast By End User, 2026 to 2036
- Commercial airlines
- Cargo operators
- Lessors
- Business aviation
- Commercial airlines
- Y-o-Y Growth Trend Analysis By End User, 2021 to 2025
- Absolute $ Opportunity Analysis By End User, 2026 to 2036
- Global Market Analysis 2021 to 2025 and Forecast 2026 to 2036, By Region
- Introduction
- Historical Market Size Value (USD Million) Analysis By Region, 2021 to 2025
- Current Market Size Value (USD Million) Analysis and Forecast By Region, 2026 to 2036
- North America
- Latin America
- Western Europe
- Eastern Europe
- East Asia
- South Asia and Pacific
- Middle East & Africa
- Market Attractiveness Analysis By Region
- North America Market Analysis 2021 to 2025 and Forecast 2026 to 2036, By Country
- Historical Market Size Value (USD Million) Trend Analysis By Market Taxonomy, 2021 to 2025
- Market Size Value (USD Million) Forecast By Market Taxonomy, 2026 to 2036
- By Country
- USA
- Canada
- Mexico
- By Service Type
- By Aircraft Type
- By Method
- By Provider
- By End User
- By Country
- Market Attractiveness Analysis
- By Country
- By Service Type
- By Aircraft Type
- By Method
- By Provider
- By End User
- Key Takeaways
- Latin America Market Analysis 2021 to 2025 and Forecast 2026 to 2036, By Country
- Historical Market Size Value (USD Million) Trend Analysis By Market Taxonomy, 2021 to 2025
- Market Size Value (USD Million) Forecast By Market Taxonomy, 2026 to 2036
- By Country
- Brazil
- Chile
- Rest of Latin America
- By Service Type
- By Aircraft Type
- By Method
- By Provider
- By End User
- By Country
- Market Attractiveness Analysis
- By Country
- By Service Type
- By Aircraft Type
- By Method
- By Provider
- By End User
- Key Takeaways
- Western Europe Market Analysis 2021 to 2025 and Forecast 2026 to 2036, By Country
- Historical Market Size Value (USD Million) Trend Analysis By Market Taxonomy, 2021 to 2025
- Market Size Value (USD Million) Forecast By Market Taxonomy, 2026 to 2036
- By Country
- Germany
- UK
- Italy
- Spain
- France
- Nordic
- BENELUX
- Rest of Western Europe
- By Service Type
- By Aircraft Type
- By Method
- By Provider
- By End User
- By Country
- Market Attractiveness Analysis
- By Country
- By Service Type
- By Aircraft Type
- By Method
- By Provider
- By End User
- Key Takeaways
- Eastern Europe Market Analysis 2021 to 2025 and Forecast 2026 to 2036, By Country
- Historical Market Size Value (USD Million) Trend Analysis By Market Taxonomy, 2021 to 2025
- Market Size Value (USD Million) Forecast By Market Taxonomy, 2026 to 2036
- By Country
- Russia
- Poland
- Hungary
- Balkan & Baltic
- Rest of Eastern Europe
- By Service Type
- By Aircraft Type
- By Method
- By Provider
- By End User
- By Country
- Market Attractiveness Analysis
- By Country
- By Service Type
- By Aircraft Type
- By Method
- By Provider
- By End User
- Key Takeaways
- East Asia Market Analysis 2021 to 2025 and Forecast 2026 to 2036, By Country
- Historical Market Size Value (USD Million) Trend Analysis By Market Taxonomy, 2021 to 2025
- Market Size Value (USD Million) Forecast By Market Taxonomy, 2026 to 2036
- By Country
- China
- Japan
- South Korea
- By Service Type
- By Aircraft Type
- By Method
- By Provider
- By End User
- By Country
- Market Attractiveness Analysis
- By Country
- By Service Type
- By Aircraft Type
- By Method
- By Provider
- By End User
- Key Takeaways
- South Asia and Pacific Market Analysis 2021 to 2025 and Forecast 2026 to 2036, By Country
- Historical Market Size Value (USD Million) Trend Analysis By Market Taxonomy, 2021 to 2025
- Market Size Value (USD Million) Forecast By Market Taxonomy, 2026 to 2036
- By Country
- India
- ASEAN
- Australia & New Zealand
- Rest of South Asia and Pacific
- By Service Type
- By Aircraft Type
- By Method
- By Provider
- By End User
- By Country
- Market Attractiveness Analysis
- By Country
- By Service Type
- By Aircraft Type
- By Method
- By Provider
- By End User
- Key Takeaways
- Middle East & Africa Market Analysis 2021 to 2025 and Forecast 2026 to 2036, By Country
- Historical Market Size Value (USD Million) Trend Analysis By Market Taxonomy, 2021 to 2025
- Market Size Value (USD Million) Forecast By Market Taxonomy, 2026 to 2036
- By Country
- Kingdom of Saudi Arabia
- Other GCC Countries
- Turkiye
- South Africa
- Other African Union
- Rest of Middle East & Africa
- By Service Type
- By Aircraft Type
- By Method
- By Provider
- By End User
- By Country
- Market Attractiveness Analysis
- By Country
- By Service Type
- By Aircraft Type
- By Method
- By Provider
- By End User
- Key Takeaways
- Key Countries Market Analysis
- USA
- Pricing Analysis
- Market Share Analysis, 2025
- By Service Type
- By Aircraft Type
- By Method
- By Provider
- By End User
- Canada
- Pricing Analysis
- Market Share Analysis, 2025
- By Service Type
- By Aircraft Type
- By Method
- By Provider
- By End User
- Mexico
- Pricing Analysis
- Market Share Analysis, 2025
- By Service Type
- By Aircraft Type
- By Method
- By Provider
- By End User
- Brazil
- Pricing Analysis
- Market Share Analysis, 2025
- By Service Type
- By Aircraft Type
- By Method
- By Provider
- By End User
- Chile
- Pricing Analysis
- Market Share Analysis, 2025
- By Service Type
- By Aircraft Type
- By Method
- By Provider
- By End User
- Germany
- Pricing Analysis
- Market Share Analysis, 2025
- By Service Type
- By Aircraft Type
- By Method
- By Provider
- By End User
- UK
- Pricing Analysis
- Market Share Analysis, 2025
- By Service Type
- By Aircraft Type
- By Method
- By Provider
- By End User
- Italy
- Pricing Analysis
- Market Share Analysis, 2025
- By Service Type
- By Aircraft Type
- By Method
- By Provider
- By End User
- Spain
- Pricing Analysis
- Market Share Analysis, 2025
- By Service Type
- By Aircraft Type
- By Method
- By Provider
- By End User
- France
- Pricing Analysis
- Market Share Analysis, 2025
- By Service Type
- By Aircraft Type
- By Method
- By Provider
- By End User
- India
- Pricing Analysis
- Market Share Analysis, 2025
- By Service Type
- By Aircraft Type
- By Method
- By Provider
- By End User
- ASEAN
- Pricing Analysis
- Market Share Analysis, 2025
- By Service Type
- By Aircraft Type
- By Method
- By Provider
- By End User
- Australia & New Zealand
- Pricing Analysis
- Market Share Analysis, 2025
- By Service Type
- By Aircraft Type
- By Method
- By Provider
- By End User
- China
- Pricing Analysis
- Market Share Analysis, 2025
- By Service Type
- By Aircraft Type
- By Method
- By Provider
- By End User
- Japan
- Pricing Analysis
- Market Share Analysis, 2025
- By Service Type
- By Aircraft Type
- By Method
- By Provider
- By End User
- South Korea
- Pricing Analysis
- Market Share Analysis, 2025
- By Service Type
- By Aircraft Type
- By Method
- By Provider
- By End User
- Russia
- Pricing Analysis
- Market Share Analysis, 2025
- By Service Type
- By Aircraft Type
- By Method
- By Provider
- By End User
- Poland
- Pricing Analysis
- Market Share Analysis, 2025
- By Service Type
- By Aircraft Type
- By Method
- By Provider
- By End User
- Hungary
- Pricing Analysis
- Market Share Analysis, 2025
- By Service Type
- By Aircraft Type
- By Method
- By Provider
- By End User
- Kingdom of Saudi Arabia
- Pricing Analysis
- Market Share Analysis, 2025
- By Service Type
- By Aircraft Type
- By Method
- By Provider
- By End User
- Turkiye
- Pricing Analysis
- Market Share Analysis, 2025
- By Service Type
- By Aircraft Type
- By Method
- By Provider
- By End User
- South Africa
- Pricing Analysis
- Market Share Analysis, 2025
- By Service Type
- By Aircraft Type
- By Method
- By Provider
- By End User
- USA
- Market Structure Analysis
- Competition Dashboard
- Competition Benchmarking
- Market Share Analysis of Top Players
- By Regional
- By Service Type
- By Aircraft Type
- By Method
- By Provider
- By End User
- Competition Analysis
- Competition Deep Dive
- Lufthansa Technik
- Overview
- Product Portfolio
- Profitability by Market Segments (Product/Age /Sales Channel/Region)
- Sales Footprint
- Strategy Overview
- Marketing Strategy
- Product Strategy
- Channel Strategy
- ST Engineering
- AAR
- HAECO
- Air France Industries KLM E&M
- Airbus Services
- Boeing Global Services
- Lufthansa Technik
- Competition Deep Dive
- Assumptions & Acronyms Used


