
- Market Size (2026)
- USD 11.3 Bn
- Forecast (2036)
- USD 15.9 Bn
- CAGR (2026 to 2036)
- 3.5%
How Big Is the Rayon Fiber Market in 2026?
The global rayon fiber market is valued at USD 11.3 billion in 2026 and was about USD 10.9 billion in 2025. Future Market Insights (FMI) projects it to reach USD 15.9 billion by 2036 at a 3.5% CAGR, which generates USD 4.6 billion in incremental revenue over the forecast decade.
| Market Metric | Valuation / Share / Forecast Benchmark |
|---|---|
| 2025 Market Size (Historical) | USD 10.9 billion |
| 2026 Market Size (Estimated) | USD 11.3 billion |
| 2036 Market Size (Projected) | USD 15.9 billion |
| Compound Annual Growth Rate (2026 to 2036) | 3.5% CAGR |
| Incremental Dollar Opportunity (2026 to 2036) | USD 4.6 billion |
| Dominant Product (2026 to 2036 Share) | Viscose Staple Fiber (74.0% in 2026 rising to 75.7% by 2036 at 3.7% CAGR) |
| Leading Application | Apparel (59.1% share in 2026 and 3.8% CAGR) |
| Leading End-Use Industry | Fashion and Apparel (58.1% share in 2026 and 3.7% CAGR) |
| Leading Fiber Type | Regular Fiber (68.0% share in 2026 and 3.6% CAGR) |
| Largest Country Markets (2026 Global Share) | China (47.0%) |
| Fastest-Growing Country Markets (2026 to 2036) | Pakistan (3.9% CAGR) |
| Leading Tier-1 Companies | Birla Cellulose |
Source: Future Market Insights analysis of the rayon fiber market, 2026.
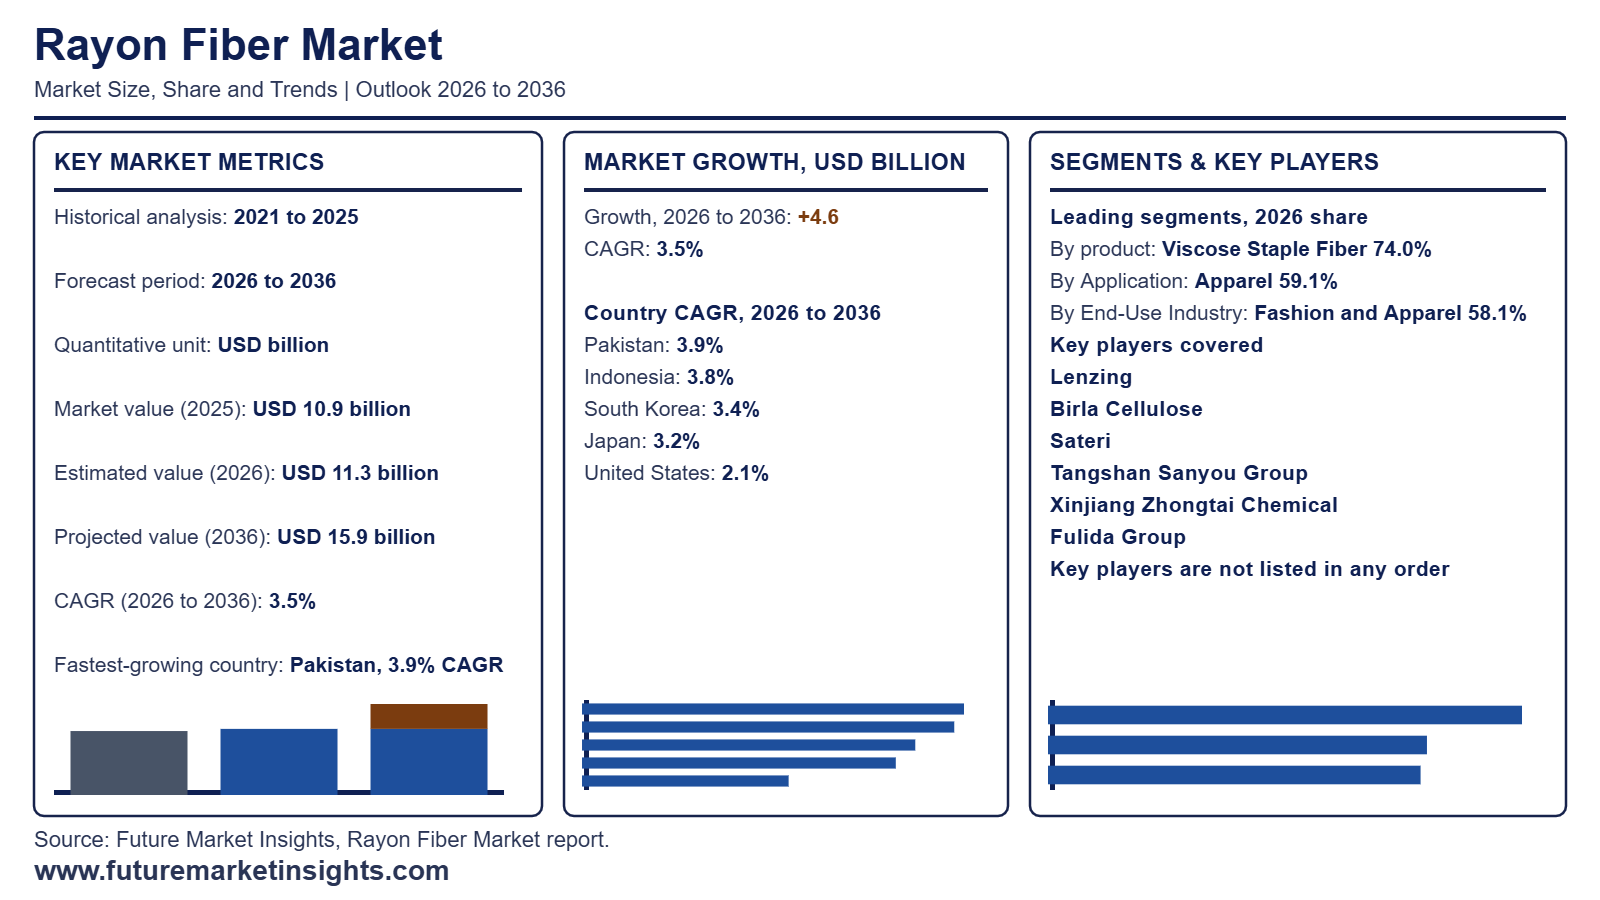
Executive Market Overview
Rayon fiber earns its place in global textile sourcing because viscose staple slots into established cotton yarn recipes at spinning mills across China and Indonesia and Pakistan with no change to fabric platforms. Fashion merchandisers set the hand feel and absorbency and drape targets and garment mills pass them to spinners which keeps bale orders recurring. Upstream support is visible in China where chemical fiber output grew 4.9% to about 87.01 million tons in 2025 (National Bureau of Statistics of China 2026). Hygiene and home fabric buyers add further pull since Sateri positions EcoCosy textile and nonwoven fibers for clothing and home fabrics and hygiene products (Sateri 2026). Producer discipline matters too as Lenzing posted nine-month 2026 revenue of EUR 1.93 billion or 2.3% lower mainly on reduced standard fiber output (Lenzing 2026).
Premium grades such as certified wood pulp fiber and branded eco fiber and dope-dyed fiber add production expense that mills recover once brand buyers accept a higher delivered price. Converters running price-sensitive programs therefore hold regular fiber as the default specification. Viscose Staple Fiber leads Product at 74.0% share in 2026 and grows at a 3.7% CAGR through 2036. Apparel leads Application at 59.1% with a 3.8% CAGR while Fashion and Apparel commands 58.1% of End-Use Industry revenue at 3.7%. Regular Fiber contributes 68.0% of Fiber Type revenue and advances at 3.6%. Regionally Pakistan leads at a 3.9% CAGR followed by Indonesia at 3.8% as export garment programs build beside cellulosic fiber supply chains. South Korea at 3.4% and Japan at 3.2% reflect hygiene demand linked to nonwoven fabrics conversion. Market sizing covers viscose staple and filament and modal and specialty rayon sold to spinners and fabric makers and nonwoven converters. It excludes lyocell and cotton and polyester and cellulose acetate.
Analyst Perspective
The rayon fiber market is shifting toward sustainable cellulose fibers as brands seek traceable wood pulp and closed loop production. Producers investing in certified sourcing and low impact viscose processes will secure stronger apparel partnerships and premium margins in the years ahead.
- Nikhil Kaitwade, Principal Consultant, Future Market Insights.
Major Market Trends and Insights
- Viscose Staple Fiber Holds Volume Leadership in Apparel Sourcing: Apparel spinners favor viscose staple fiber because it runs on existing cotton lines at low conversion cost. That keeps buying concentrated in the standard grade. Textile Exchange (September 2025) reports viscose output of 6.7 million tonnes in 2024 in its Materials Market Report 2025 or about 5% of global fiber. FMI projects viscose staple fiber share to climb from 74.0% in 2026 to 75.7% by 2036 at a 3.7% CAGR while apparel advances at 3.8% CAGR.
- India Withdraws Viscose Certification Rule and Resets Sourcing Terms: Mandatory BIS licensing for makers and importers of viscose staple fiber tied Indian spinners to a narrow supplier pool. Fibre2Fashion (November 2025) reported industry concern over artificially higher domestic prices. The Ministry of Textiles withdrew the order by gazette notification on 18 November 2025 as confirmed by TEXPROCIL (November 2025) after nearly three years in force (notified 29 December 2022). Domestic producers led by Birla Cellulose now price against import offers.
- Lenzing Shifts Away From Standard Viscose Toward Premium Fibers: Commodity viscose margins reward the lowest cost producers so higher cost producers redeploy capital into differentiated grades. Lenzing (July 2026) will phase out fiber production at Heiligenkreuz by end of 2026 and at Grimsby by end of 2027 while its Indonesian viscose unit PT South Pacific Viscose enters a sale process. The group targets a 20% to 25% EBITDA margin over the medium term and EUR 120 million in savings. Standard grade volume moves toward cost-led suppliers.
What Are the Main Drivers, Restraints, and Opportunities?
Nonwoven and spinning conversion keeps rayon fiber orders recurring across hygiene and apparel programs while viscose emission reporting and sulfur recovery spending shape which mills qualify and that selective supplier pool lets traceable recycled-content grades earn a verifiable premium among brand buyers.
Driver: Hygiene Wipes and Garment Programs Sustain Repeat Rayon Orders
Wipe converters and yarn spinners qualify a rayon grade once and reorder it across production runs because absorbency and drape targets stay fixed for wet wipes and garment programs. The Ministry of Textiles (July 2026) recorded India’s man-made textile exports at INR 462.5 billion for fiscal 2025-26 or 3.3% above the prior year. Lenzing (August 2026) plans to convert textile fiber capacity into nonwoven fiber output and broaden its range mainly in hygiene. Indian spinners filling export garment orders and hygiene converters buying from producers such as Lenzing and Sateri should therefore favor suppliers that pair qualified grades with sampling support.
Restraint: Emission Reporting Duties and Recovery Spending Shape Mill Participation
Viscose mills that buy dissolving grades from the hardwood pulp supply chain now document feedstock and process data at a depth that lifts the investment needed to qualify every plant. ZDHC (October 2025) revised sulfur air limits to match EU best available techniques and added sludge testing plus Scope 1 and 2 greenhouse gas reporting in the MMCF Guidelines V3.0. Sateri (July 2026) reported in its Sustainability Report 2025 total sulfur recovery of 97.4% across viscose mills against a target above 98%. Integrated producers such as Sateri already run recovery systems at scale and should hold a cost-per-ton edge over smaller viscose lines serving South Asian apparel mills.
Opportunity: Traceable Recycled-Content Grades Earn Premiums Among Brand Buyers
European apparel brands preparing for product passport rules prize batch-level recycled content and that links rayon to textile recycling streams returning cellulose from used garments. Sateri (July 2026) reports FINEX fibers with up to 50% recycled raw materials and PEFC chain-of-custody certification across all its viscose mills. The European Commission (July 2026) expects textile apparel to follow batteries into the digital product passport framework under the Ecodesign for Sustainable Products Regulation. FMI projects the rayon fiber market at a 3.5% CAGR to USD 15.9 billion by 2036. Mills pairing documented recycled content with dependable yield can win part of the added USD 4.6 billion.
| Segmentation Axis | Sub-Segments Covered | 2026 Leading Segment and Share | Main Growth Benchmark (2026 to 2036) |
|---|---|---|---|
| Product | Viscose Staple Fiber / Viscose Filament Yarn / Specialty and Flame-Retardant Rayon / Modal and High Wet Modulus Fiber | Viscose Staple Fiber (74.0% revenue share) | Viscose Staple Fiber share rises to 75.7% by 2036 while Specialty and Flame-Retardant Rayon leads at 4.0% CAGR |
| Application | Apparel / Home Textiles / Nonwovens and Hygiene / Industrial and Tire Cord | Apparel (59.1% revenue share) | Apparel leads at 3.8% CAGR and reaches 60.8% share by 2036 |
| End-Use Industry | Fashion and Apparel / Home Furnishing / Healthcare and Hygiene / Industrial | Fashion and Apparel (58.1% revenue share) | Fashion and Apparel grows at 3.7% CAGR and reaches 59.2% share by 2036 |
| Fiber Type | Regular Fiber / Certified Wood-Pulp Fiber / Branded Eco-Fiber / Dope-Dyed Fiber | Regular Fiber (68.0% revenue share) | Branded Eco-Fiber leads at 3.7% CAGR against 3.6% CAGR for Regular Fiber |
Source. Future Market Insights analysis of the rayon fiber market 2026.
Why Does Viscose Staple Fiber Lead by Product?
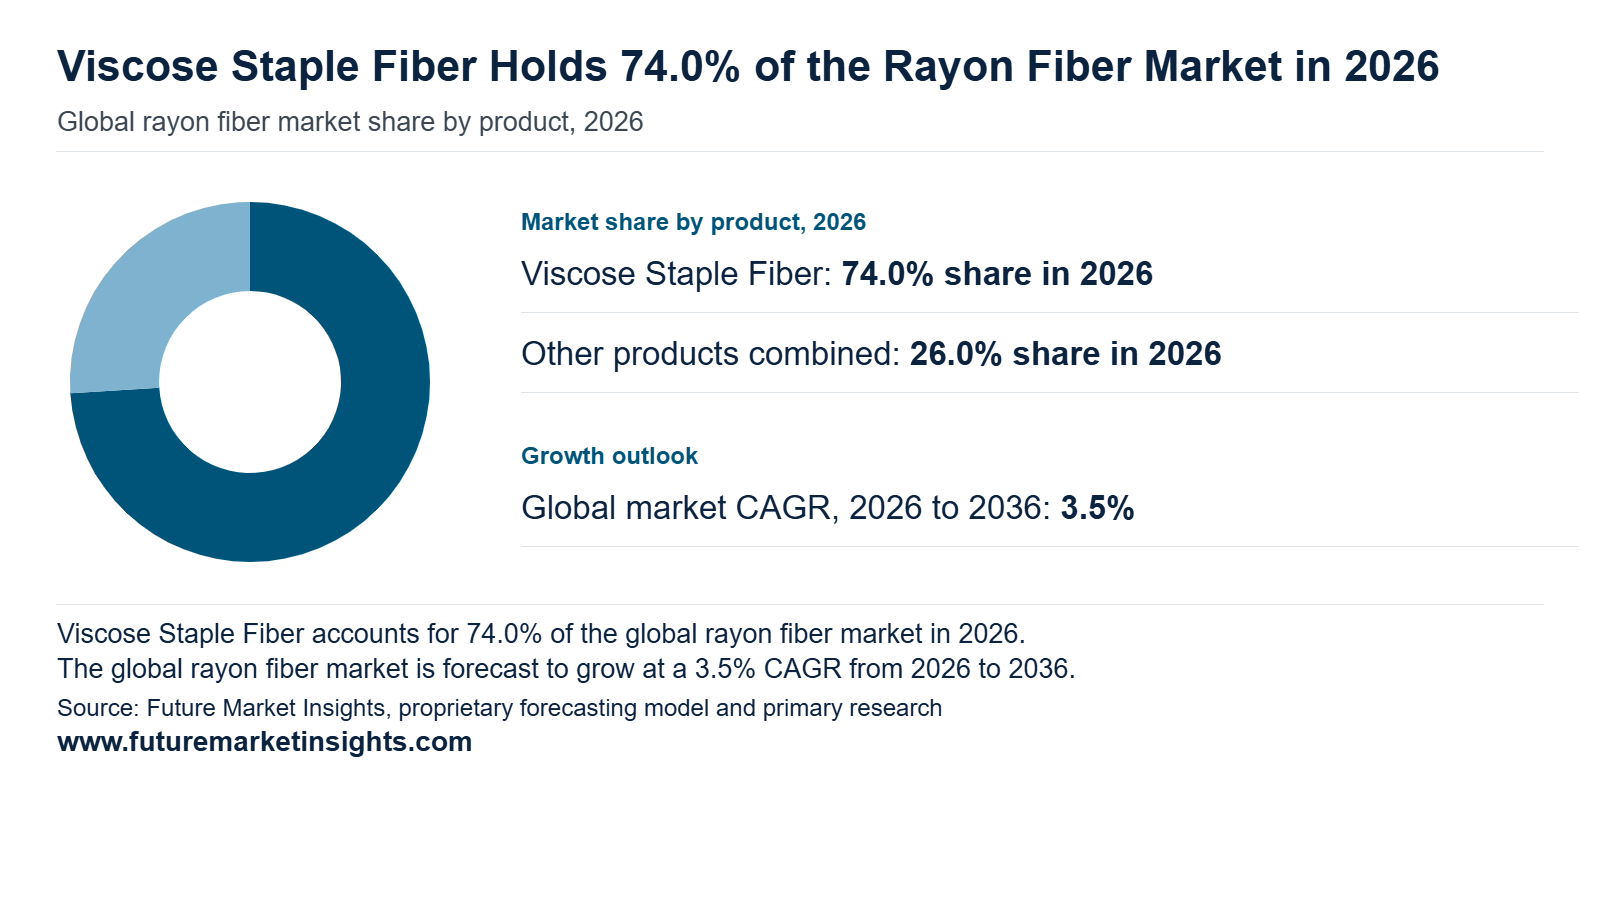
Viscose staple fiber leads the rayon fiber market by product with a 74.0% share in 2026 and is projected to reach 75.7% by 2036 at a 3.7% CAGR. Spinning mills in China and India buy it through established bale handling and carding workflows that let them adjust rayon content against cotton and polyester while keeping existing fabric platforms. Birla Cellulose and Sateri supply apparel and nonwoven grades that support repeat purchasing. Viscose filament yarn (12.0%) serves weavers of linings and sarees while specialty and flame-retardant rayon (7.5%) grows fastest at 4.0% CAGR and modal and high wet modulus fiber (6.5%) addresses premium innerwear programs.
Why Does Apparel Lead by Application?
Apparel holds a 59.1% share of application demand in 2026 and is projected to reach 60.8% by 2036 at a 3.8% CAGR which is the highest among application segments. Merchandising teams at Inditex and H&M Group convert seasonal design briefs into yarn and fabric orders since viscose delivers soft hand and fluid drape across dresses and knitwear. Garment clusters in Bangladesh and Vietnam carry these orders into export channels. Home textiles (17.0%) follows housing and refresh cycles while nonwovens and hygiene (15.9%) buys for wipes and personal care webs and industrial and tire cord (8.0%) depends on extended qualification.
Why Does Fashion and Apparel Lead by End-Use Industry?
Fashion and apparel leads end-use demand with a 58.1% share in 2026 and is projected to reach 59.2% by 2036 at a 3.7% CAGR. Purchasing authority sits with brand merchandisers at retailers such as Marks and Spencer and Zalando who pass hand feel targets and price ceilings and composition labels down to mills. Responsible sourcing policies reinforce this influence over fiber selection. Home furnishing (17.5%) follows furniture and bedding order cycles while healthcare and hygiene (16.4%) buys on absorbency and conversion reliability and industrial users (8.0%) qualify grades against mechanical specifications that make supplier changes deliberate.
Why Does Regular Fiber Lead by Fiber Type?
Regular fiber leads by fiber type with a 68.0% share in 2026 and is projected to reach 68.7% by 2036 at a 3.6% CAGR. Converters in China and India and Indonesia select standard grades for familiar spinning behavior and batch repeatability at a competitive delivered price. Qualified recipes stay in routine rotation across mass market apparel and nonwoven programs. Certified wood-pulp fiber (14.0%) serves buyers who require FSC or PEFC chain of custody and branded eco-fiber (10.0%) grows fastest at 3.7% CAGR through licensed claims while dope-dyed fiber (8.0%) moves color creation into fiber production.
Rayon Fiber Market by Region and Country (2026 to 2036)
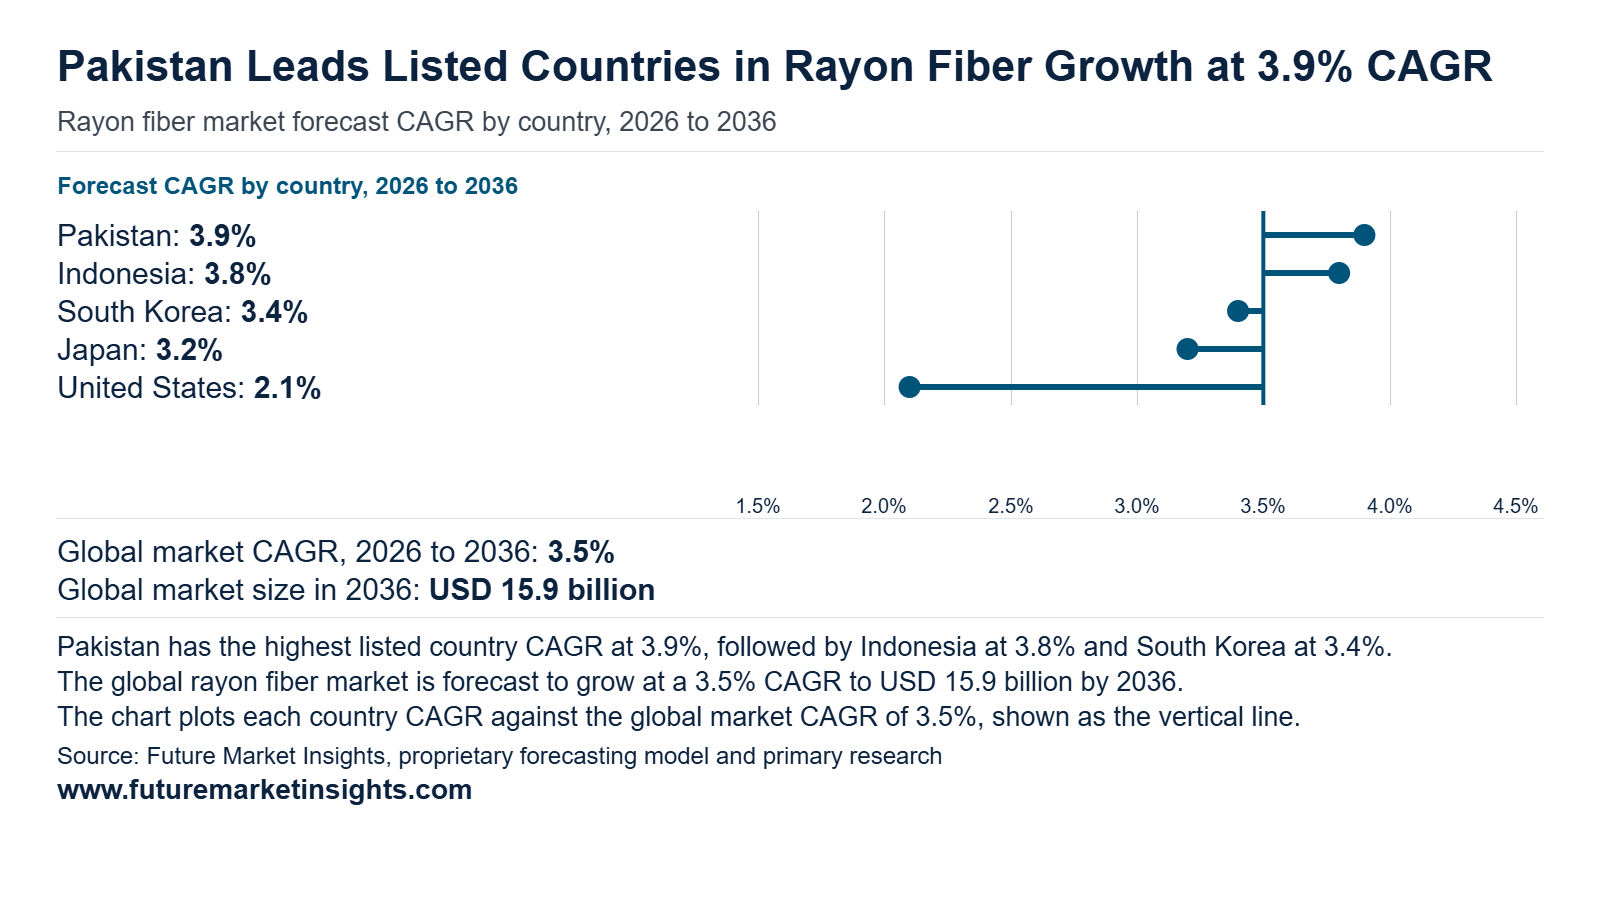
Asia holds four of the five profiled rayon fiber markets and contributes about 80% of the USD 1.59 billion that the group adds between 2026 and 2036. The five countries together move from USD 4.40 billion to USD 5.99 billion while their combined share of global revenue eases from 28.9% to 27.9% as markets elsewhere scale faster. Indonesia adds USD 533.4 million on the strength of Asia Pacific Rayon exports and the United States adds USD 311.8 million as California's textile stewardship rules steer buying toward documented cellulosic fibers. Pakistan records the fastest pace at 3.9% as spinning groups broaden their blends.
| Country | 2026 Revenue | 2036 Revenue | 10-Year Addition | 2026 to 2036 CAGR | Global Share (2026 → 2036) |
|---|---|---|---|---|---|
| Pakistan | USD 410.0 million | USD 601.1 million | +USD 191.1 million | 3.9% | 2.7% → 2.8% |
| Indonesia | USD 1.18 billion | USD 1.71 billion | +USD 533.4 million | 3.8% | 7.8% → 8.0% |
| South Korea | USD 520.0 million | USD 726.5 million | +USD 206.5 million | 3.4% | 3.4% → 3.4% |
| Japan | USD 940.0 million | USD 1.29 billion | +USD 348.0 million | 3.2% | 6.2% → 6.0% |
| United States | USD 1.35 billion | USD 1.66 billion | +USD 311.8 million | 2.1% | 8.9% → 7.8% |
Source: Future Market Insights analysis of the rayon fiber market, 2026.
Pakistan
Pakistan posts the highest CAGR among the profiled countries at 3.9% and ranks as the fastest-growing country. Revenue moves from an USD 410 million in 2026 to USD 601.1 million by 2036 and adds USD 191.1 million while share edges from 2.7% to 2.8%. Textile machinery imports rose 20.9% over July to March FY2026 in the Pakistan Economic Survey 2025-26 released by the Ministry of Finance (June 2026). Spinning groups around Faisalabad and Lahore use that capacity to widen fiber blends while textile exports of USD 13.58 billion give the investment a strong base. Viscose staple fiber reaches these mills from suppliers such as Asia Pacific Rayon (August 2025) which names Pakistan among its export destinations. In turn mills adding blending capacity should anchor rayon yarn and fabric orders from knitwear and home textile exporters through the forecast years.
Indonesia
The Ministry of Industry presented it with the first Industri Hijau certificate awarded to a viscose staple fiber mill in December 2024. Compliance with EU-BAT in an October 2024 assessment prepares the ground for European brand programs. Export reach combined with verified environmental credentials positions Indonesian mills to supply garment makers across South and Southeast Asia and lifts share from 7.8% to 8.0% by 2036. Domestic buyers still take 39% of volumes and this base supports wider local fabric sourcing. Asia Pacific Rayon anchors Indonesia's 3.8% CAGR as revenue grows from an USD 1.18 billion in 2026 to USD 1.71 billion by 2036 and adds USD 533.4 million. The company (August 2025) reports record 2024 viscose staple fiber output of 315 thousand tonnes with 61% of sales shipped to export markets such as Turkey and Vietnam.
South Korea
South Korea ranks third among the profiled countries at a 3.4% CAGR as industrial policy sets the tempo. Revenue moves from an USD 520 million in 2026 to USD 726.5 million by 2036 and adds USD 206.5 million while holding a share near 3.4%. Korea's trade and industry ministry known as MOTIE announced a program worth KRW 35.2 billion through 2029 for fiber-to-fiber recycling of polyester composites (Korea.net February 2025). It also backs chemical regenerative green textiles and biomass derived materials. Such funding signals that circular and plant-derived specifications will guide fabric sourcing and opens room for cellulosic fibers beside recycled polyester. Against this backdrop mills in the Daegu textile cluster and Seoul apparel houses are expected to qualify rayon inside export collections and this supports consistent specification driven purchases from domestic spinners and converters.
Japan
Product engineering shapes rayon fiber in Japan where revenue moves at a 3.2% CAGR and places the country fourth among the five profiled markets. Revenue rises from an USD 940 million in 2026 to USD 1.29 billion by 2036 and adds USD 348.0 million as share settles from 6.2% to 6.0%. Osaka based Omikenshi lists rayon staple fiber and spinning yarn as its main business and was established in 1917 (Omikenshi March 2025). Daiwabo Rayon offers marine-biodegradable wood cellulose fiber and Recovis recycled cellulose blended with cotton from denim scraps (Japan Chemical Fibers Association June 2025). The same catalog lists a non-fluorinated water repellent rayon for nonwovens and outdoor wear. Such functional lines answer apparel brands and nonwoven converters that seek documented performance and sustainability claims in a mature domestic market. Consequently value per tonne should rise faster than volume ahead of 2036.
United States
Regulation in California reshapes purchasing across the United States where rayon fiber holds the largest base among the profiled countries and advances at a 2.1% CAGR. Revenue moves from an USD 1.35 billion in 2026 to USD 1.66 billion by 2036 and adds USD 311.8 million as share adjusts from 8.9% to 7.8%. CalRecycle (February 2026) approved Landbell USA as the producer responsibility organization under the Responsible Textile Recovery Act. Producers of covered apparel and textile articles had to join it by 1 July 2026. Importers and brands selling rayon apparel into California now budget for stewardship fees and favor suppliers that document fiber origin and end-of-life routes. On this basis retail private label programs should shift volumes toward certified cellulosic suppliers with traceable supply chains and this keeps American demand growing at a measured pace.
Competitive Environment and Notable Companies
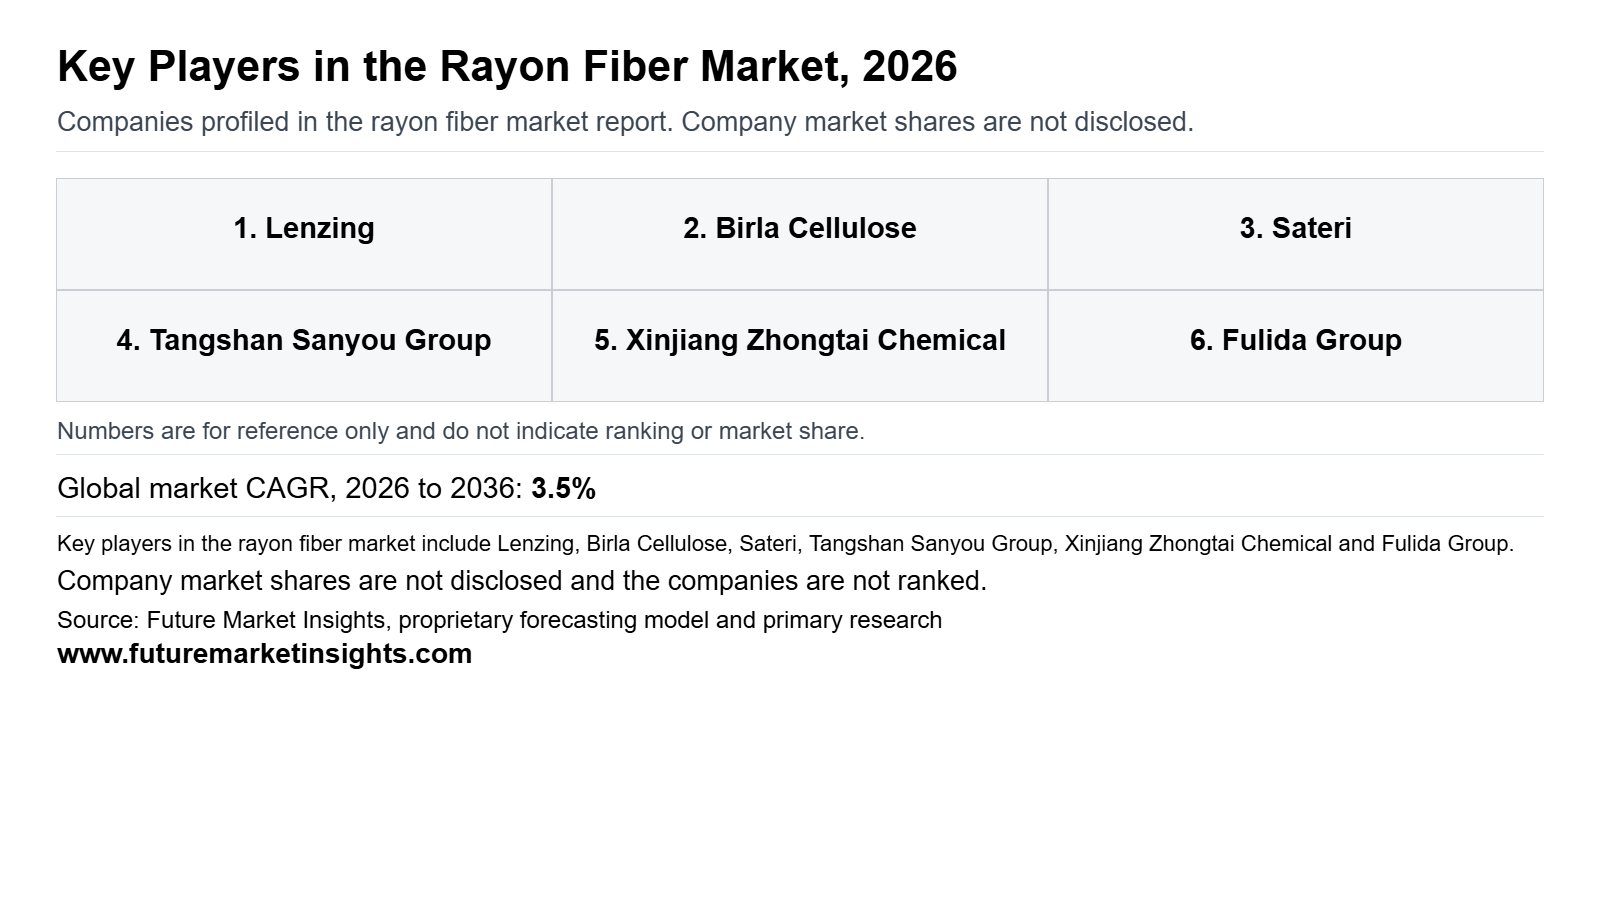
Notable companies operating in the global rayon fiber market include Lenzing, Birla Cellulose, Sateri, Tangshan Sanyou Group, Xinjiang Zhongtai Chemical, Fulida Group, Kelheim Fibres, Cordenka, Yibin Grace Group, and Century Rayon. Competition operates at two structural levels. Integrated staple producers in China and India compete on dissolving pulp access, chemical recovery, line scale, and delivered price to spinners and nonwoven converters. Fragmented specialists in Europe and India compete on engineered cross sections, high tenacity filament, and tire cord qualification, where switching costs protect pricing. Because new capacity is concentrated in Asia, partnerships with regional converters and brand programs create clear scope for licensing, toll processing, and recycled pulp supply.
How Are Companies Positioned in the Rayon Fiber Market?
Integrated Asian producers lead on staple scale. Grasim (2026) lists 824 thousand tons of viscose staple capacity for Birla Cellulose and Tangshan Sanyou Group (2025) reports 830 thousand tons. Xinjiang Zhongtai Chemical (March 2025) shows 0.88 million tons of viscose design capacity at 56.91% utilization, which leaves room to add volume without new capex. Lenzing (September 2025) moves the other way by exiting lower margin commodity segments and reviewing its Indonesian site. Cordenka (2026) holds 32 thousand tons of industrial rayon capacity and Century Rayon (2026) holds 27.5 thousand metric tons of filament capacity.
What Matters When a Buyer Selects a Rayon Fiber Supplier?
Hygiene converters, apparel mills, and tire makers qualify rayon suppliers on different evidence, so approvals protect incumbent grades. Feminine care buyers test absorbency, and Lenzing (November 2025) claims VEOCEL Viscostar trilobal fiber outperforms conventional viscose on Syngina values. Brands sourcing recycled content weigh traceable feedstock, which explains why Tangshan Sanyou Group (2025) reports 40 thousand tons of ReVisco output made with Circulose pulp. Tire makers focus on heat aging resistance and low hysteresis, properties Cordenka (2026) lists for its yarn. Each validation cycle lengthens switching time and supports price premiums.
Which Capabilities Distinguish Product Offers?
Portfolios diverge across grade breadth, recycled content, and process route. Aditya Birla Group (2025) describes Liva Reviva M as India's first next generation circular fiber made from recycled clothing, while Grasim (2026) concentrates modal and micromodal grades at Vilayat. Sateri (March 2026) began a 150 thousand ton lyocell line in Shandong after commissioning Changzhou phase 2 in June 2025, which widens its offer beyond viscose. Century Rayon (2026) pairs pot spun and continuous spun filament with tire cord yarn and ISO 9001, ISO 14001, ISO 45001, and Oeko-Tex credentials.
How Does Geographic Reach Affect Competition?
Footprints are narrowing around clusters of cost and qualification. Lenzing (September 2025) is reviewing a potential sale of its Indonesian site while directing more than EUR 100 million toward Austrian sites through 2027, which concentrates premium supply in Europe. Grasim (2026) pairs four Indian plants with a wholly owned Chinese unit of 70 thousand tons, giving Birla Cellulose access to both Indian and Chinese spinners. Cordenka (2026) serves tire makers from Obernburg with converting in Germany and Poland and a Shanghai office, positioning it nearer Asian tire plants.
| Verified Company Evidence (2026) | Commercial Effect | Buyer Action |
|---|---|---|
| 9 January 2026 Sateri signed the third phase of its Changzhou lyocell project at 360 thousand tons per year in Liyang [Sateri (January 2026)]. | Signals a multi year scale commitment that widens Chinese cellulosic supply and pressures standard viscose pricing. | Request viscose and lyocell price comparisons before renewals and test substitution in blends. |
| 26 January 2026 Kelheim Fibres announced that operations would end on 31 March 2026 [Kelheim Fibres (January 2026)]. | Removes a European specialty viscose source and moves absorbent grade volume to remaining specialists. | Validate replacement fibers against absorbency specifications and dual source hygiene grades. |
| March 2026 Sateri began production at its Shandong phase 1 lyocell line at 150 thousand tons per year [Sateri (March 2026)]. | Adds immediate capacity that strengthens Sateri's position in textile blends. | Benchmark quotes against the new line capacity before resetting annual contracts. |
Source: Verified corporate disclosures and Future Market Insights analysis, 2026.
| Company | Core Positioning | Verified Activity & Source Attribution |
|---|---|---|
| Lenzing | Branded premium cellulosic fibers with VEOCEL Viscostar for hygiene | EUR 15 million Viscostar expansion in Austria (Lenzing, November 2025). Indonesian site review and over EUR 100 million Austrian program (Lenzing, September 2025). |
| Birla Cellulose | Viscose staple scale with modal and recycled Liva Reviva grades | 824 thousand tons of viscose staple capacity (Grasim, 2026). Launched Liva Reviva M in 2025 (Aditya Birla Group, 2025). |
| Sateri | Large Chinese cellulosic platform across viscose and lyocell | Yancheng D line started in August 2025 lifting site capacity to 400 thousand tons. Shandong lyocell line began in March 2026 (Sateri, March 2026). |
| Tangshan Sanyou Group | Chinese staple scale with recycled ReVisco fiber | 830 thousand tons of capacity and 40 thousand tons of ReVisco output with Circulose pulp (Tangshan Sanyou Group, 2025). |
| Xinjiang Zhongtai Chemical | Integrated Xinjiang viscose fiber and yarn | 0.88 million tons of viscose design capacity and 3.2 million spindles of yarn capacity in 2024 (Xinjiang Zhongtai Chemical, March 2025). |
| Fulida Group | Zhejiang based viscose staple supplier | Positioning only. No verifiable recent activity located. |
| Kelheim Fibres | German specialty absorbent viscose producer | Announced end of operations effective 31 March 2026 (Kelheim Fibres, January 2026). |
| Cordenka | Industrial rayon yarn and tire cord from Germany | 32 thousand tons of annual capacity at Obernburg with converting in Germany and Poland (Cordenka, 2026). |
| Yibin Grace Group | Chinese viscose filament and staple producer | Positioning only. No verifiable recent activity located. |
| Century Rayon | Viscose filament yarn and tire cord yarn from India | 27.5 thousand metric tons of capacity at Shahad Maharashtra (Century Rayon, 2026). |
Source: Verified corporate disclosures and Future Market Insights analysis, 2026.
Rayon Fiber Market Report Scope and Research Methodology
FMI sizes the rayon fiber market by multiplying the metric tons of fiber sold into each country by the realized price for each product grade. Country results are cross-checked against national textile and fiber industry totals. Viscose staple fiber anchors the model because it is the most widely traded grade and producer associations track it closely. Filament yarn and the specialty and modal grades convert to dry fiber weight so every product sits on a single volume basis. Revenue is booked in the country where the fiber is consumed. Segment and country figures sum to the global total in every year. Company disclosures verify product positioning and capacity commitments rather than estimate proprietary company revenue.
| Coverage Field | Report Scope |
|---|---|
| Market definition | Revenue from sales of rayon staple and viscose filament yarn and specialty and flame-retardant rayon and modal and high wet modulus fiber into apparel and home textile and nonwoven and industrial applications. Chemical co-products sit outside rayon fiber revenue. |
| Product types | Viscose staple fiber / viscose filament yarn / specialty and flame-retardant rayon / modal and high wet modulus fiber |
| Variants | Regular fiber / certified wood-pulp fiber / branded eco-fiber / dope-dyed fiber |
| Ingredients or materials included | Regenerated cellulose fiber made from wood pulp |
| Packaging formats | Baled staple fiber / cones and bobbins of filament yarn / bulk and palletized industrial yarn |
| Distribution channels | Direct mill contracts / fiber traders and agents / spinning mills and nonwoven converters |
| End users | Fashion and apparel makers / home furnishing makers / healthcare and hygiene producers / industrial and tire cord buyers |
| Exclusions | Downstream finished textiles and garments / hygiene products / tire products / adjacent synthetic fiber and lyocell-only fiber sales / independent processing and distribution services / chemical co-products |
| Quantitative units | USD billion for value and metric tons for volume |
| Volume basis | Metric tons of dry fiber equivalent with filament yarn and specialty and modal grades converted to fiber weight |
| Value basis | Revenue from fiber sales to buyers in each country counted where the fiber is consumed |
| Regions covered | North America / Latin America / Western Europe / Eastern Europe / East Asia / South Asia and Pacific / Middle East and Africa |
| National coverage | India / Pakistan / Indonesia / South Korea / Japan / China / United States |
| Companies covered | Lenzing / Birla Cellulose / Sateri / Tangshan Sanyou Group / Xinjiang Zhongtai Chemical / Fulida Group / Kelheim Fibres / Cordenka / Yibin Grace Group / Century Rayon |
Source: Future Market Insights analysis of the rayon fiber market, 2026.
Research Sources and Bibliography
- Aditya Birla Group, Big Firsts: Raising the bar again (2025). https://www.adityabirla.com/media/stories/big-firsts-raising-the-bar-again/
- Asia Pacific Rayon (August 2025). Asia Pacific Rayon Sustainability Report 2024 [report, August 2025]. https://www.aprayon.com/wp-content/uploads/2025/08/Asia-Pacific-Rayon-APR-Sustainability-Report-2024.pdf
- CalRecycle (February 2026). Textile PRO Application [web page, 27 February 2026]. https://calrecycle.ca.gov/epr/textiles/textileproapp/
- Century Rayon, Introduction. https://centuryrayon.co.in/introduction.aspx
- Cordenka, Company. https://cordenka.com/en/company/
- Cordenka, Rayon. https://cordenka.com/en/rayon/
- European Commission (July 2026). New Digital Product Passport (DPP) web page launched [news item, July 17, 2026]. https://single-market-economy.ec.europa.eu/news/new-digital-product-passport-dpp-web-page-launched-2026-07-17_en
- Grasim Industries, Cellulosic Staple Fibre. https://www.grasim.com/about-us/our-businesses/cellulosic-staple-fibre
- Japan Chemical Fibers Association (June 2025). Japan’s Advanced Fibers & Textiles 2025 [catalog, June 2025]. https://www.jcfa.gr.jp/home/wp-content/uploads/2025/07/advanced-fibers-list-en-2506.pdf
- Kelheim Fibres, Closure of operations as of 31 March 2026 (26 January 2026). https://kelheim-fibres.com/en/pressreleases/kelheim-fibres-gmbh-informs-about-the-closure-of-operations-as-of-31-march-2026/
- Korea.net (February 2025). Public funds worth KRW 35.2B to help textile sector go green [article, 4 February 2025]. https://www.korea.net/NewsFocus/Sci-Tech/view?articleId=265866
- Lenzing, Lenzing AG refines strategy and strengthens competitiveness (29 September 2025). https://www.lenzing.com/newsroom/news-events/lenzing-ag-refines-strategy-and-strengthens-competitiveness-for-a-challenging-environment/
- Lenzing, Lenzing invests EUR 15 mn to strengthen position in the hygiene market (12 November 2025). https://www.lenzing.com/newsroom/news-events/lenzing-invests-eur-15-mn-to-strengthen-position-in-the-hygiene-market/
- Lenzing (August 2026). Lenzing Reports Strongly Improved Half-Year Results and Accelerates Strategic Transformation Agenda [press release, August 5, 2026]. https://www.lenzing.com/newsroom/news-events/lenzing-reports-strongly-improved-half-year-results-and-accelerates-strategic-transformation-agenda/
- Lenzing Group (November 2026). Interim Report 01-09/2026 [interim report, 5 November 2026]. https://a.storyblok.com/f/306166/x/05c6cb1418/interim-report_2026-q3_en.pdf
- Ministry of Finance, Government of Pakistan (June 2026). Pakistan Economic Survey 2025-26: Manufacturing and Mining [chapter, June 2026]. https://www.finance.gov.pk/survey/chapter_26/3_Manufacturing%20and%20Mining.pdf
- Ministry of Textiles (July 2026). Promotion of Textile Exports [press release, July 28, 2026]. https://pib.gov.in/PressReleasePage.aspx?PRID=2290322
- National Bureau of Statistics of China (February 2026). Statistical Communiqué of the People’s Republic of China on the 2025 National Economic and Social Development [statistical communiqué, 28 February 2026]. https://www.stats.gov.cn/english/PressRelease/202602/t20260228_1962661.html
- Omikenshi Co. Ltd. (March 2025). Company Profile [web page, March 2025]. https://omikenshi.co.jp/profile_english/
- Sateri, Milestones. https://www.sateri.com/corporate/milestones/
- Sateri (July 2026). Sustainability Report 2025 [report, July 2026]. https://www.sateri.com/wp-content/uploads/2026/07/sateri-sustainability-report_2025-en.pdf
- Sateri (November 2026). Viscose Fibre [company web page, accessed 16 November 2026]. https://sateri.com/products/viscose-fibre
- Tangshan Sanyou Group, ITMF award submission (2025). https://www.itmf.org/images/dl/awards/2025/Tangshan.pdf
- Xinjiang Zhongtai Chemical, 2024 Annual Report (March 2025). https://disc.static.szse.cn/download/disc/disk03/finalpage/2025-03-14/283e4551-151b-449e-b36a-0197181c1328.PDF
- ZDHC (October 2025). ZDHC MMCF Guidelines V3.0: key changes from V2.2 [guideline summary, October 2025]. https://knowledge-base.roadmaptozero.com/hc/en-gb/articles/30878704745245-What-are-the-key-changes-from-the-ZDHC-MMCF-Guidelines-V2-2-to-the-ZDHC-MMCF-Guidelines-V3-0
Table of Content
- Key Takeaways
- Market Size and CAGR
- Top Growth Driver
- Fastest Growing Segment
- Leading Region
- Key Companies
- Emerging Opportunities
- Executive Summary
- Global Market Outlook
- Demand-side Trends
- Supply-side Trends
- Technology Roadmap Analysis
- Analysis and Recommendations
- Analyst Perspective (What is happening? Why now? What should investors know?)
- Key Questions Answered
- How large is the market?
- What is the CAGR?
- What are key trends?
- Which region dominates?
- Who are the leaders?
Read More...
- Market Overview
- Market Coverage / Taxonomy
- Market Definition / Scope / Limitations
- Research Methodology
- Chapter Orientation
- Analytical Lens and Working Hypotheses
- Market Structure, Signals, and Trend Drivers
- Benchmarking and Cross-market Comparability
- Market Sizing, Forecasting, and Opportunity Mapping
- Research Design and Evidence Framework
- Desk Research Programme (Secondary Evidence)
- Expert Input and Fieldwork (Primary Evidence)
- Tooling, Models, and Reference Databases
- Data Engineering and Model Build
- Quality Assurance and Audit Trail
- Market Background
- Market Dynamics (Drivers, Restraints, Opportunity, Trends)
- Scenario Forecast (Optimistic, Likely, Conservative)
- Impact Analysis
- AI Impact
- Sustainability Impact
- Regulatory Impact
- Technology Impact
- Consumer / Buyer Analysis
- Purchase Drivers
- Adoption Barriers
- Buyer Journey
- Opportunity Map Analysis
- Product Life Cycle Analysis
- Supply Chain Analysis
- Investment Feasibility Matrix
- Value Chain Analysis
- PESTLE and Porter's Analysis
- Regulatory Landscape
- Regional Parent Market Outlook
- Production and Consumption Statistics
- Import and Export Statistics
- Global Market Analysis and Forecast, 2021 to 2036
- Historical Market Size Value (USD Million) Analysis, 2021 to 2025
- Current and Future Market Size Value (USD Million) Projections, 2026 to 2036
- Y-o-Y Growth Trend Analysis
- Absolute $ Opportunity Analysis
- Global Market Pricing Analysis, 2021 to 2036
- Global Market Analysis and Forecast, By Product, 2021 to 2036
- Introduction / Key Findings
- Historical Market Size Value (USD Million) Analysis By Product, 2021 to 2025
- Current and Future Market Size Value (USD Million) Analysis and Forecast By Product, 2026 to 2036
- Viscose Staple Fibre
- Viscose Filament Yarn
- Specialty and Flame-Retardant Rayon
- Modal and High Wet Modulus Fibre
- Y-o-Y Growth Trend Analysis By Product, 2021 to 2025
- Absolute $ Opportunity Analysis By Product, 2026 to 2036
- Global Market Analysis and Forecast, By Application, 2021 to 2036
- Introduction / Key Findings
- Historical Market Size Value (USD Million) Analysis By Application, 2021 to 2025
- Current and Future Market Size Value (USD Million) Analysis and Forecast By Application, 2026 to 2036
- Apparel
- Home Textiles
- Nonwovens and Hygiene
- Industrial and Tyre Cord
- Y-o-Y Growth Trend Analysis By Application, 2021 to 2025
- Absolute $ Opportunity Analysis By Application, 2026 to 2036
- Global Market Analysis and Forecast, By End-Use Industry, 2021 to 2036
- Introduction / Key Findings
- Historical Market Size Value (USD Million) Analysis By End-Use Industry, 2021 to 2025
- Current and Future Market Size Value (USD Million) Analysis and Forecast By End-Use Industry, 2026 to 2036
- Fashion and Apparel
- Home Furnishing
- Healthcare and Hygiene
- Industrial
- Y-o-Y Growth Trend Analysis By End-Use Industry, 2021 to 2025
- Absolute $ Opportunity Analysis By End-Use Industry, 2026 to 2036
- Global Market Analysis and Forecast, By Fibre Type, 2021 to 2036
- Introduction / Key Findings
- Historical Market Size Value (USD Million) Analysis By Fibre Type, 2021 to 2025
- Current and Future Market Size Value (USD Million) Analysis and Forecast By Fibre Type, 2026 to 2036
- Regular Fibre
- Certified Wood-Pulp Fibre
- Branded Eco-Fibre
- Dope-Dyed Fibre
- Y-o-Y Growth Trend Analysis By Fibre Type, 2021 to 2025
- Absolute $ Opportunity Analysis By Fibre Type, 2026 to 2036
- Global Market Analysis and Forecast, By Region, 2021 to 2036
- Introduction
- Historical Market Size Value (USD Million) Analysis By Region, 2021 to 2025
- Current Market Size Value (USD Million) Analysis and Forecast By Region, 2026 to 2036
- North America
- Latin America
- Western Europe
- Eastern Europe
- East Asia
- South Asia and Pacific
- Middle East and Africa
- Market Attractiveness Analysis By Region
- North America Market Analysis and Forecast, By Country, 2021 to 2036
- Historical Market Size Value (USD Million) Trend Analysis By Market Taxonomy, 2021 to 2025
- Market Size Value (USD Million) Forecast By Market Taxonomy, 2026 to 2036
- By Country
- United States
- Canada
- By Product
- By Application
- By End-Use Industry
- By Fibre Type
- By Country
- Market Attractiveness Analysis
- By Country
- By Product
- By Application
- By End-Use Industry
- By Fibre Type
- Key Takeaways
- Latin America Market Analysis and Forecast, By Country, 2021 to 2036
- Historical Market Size Value (USD Million) Trend Analysis By Market Taxonomy, 2021 to 2025
- Market Size Value (USD Million) Forecast By Market Taxonomy, 2026 to 2036
- By Country
- Brazil
- Mexico
- Argentina
- Chile
- By Product
- By Application
- By End-Use Industry
- By Fibre Type
- By Country
- Market Attractiveness Analysis
- By Country
- By Product
- By Application
- By End-Use Industry
- By Fibre Type
- Key Takeaways
- Western Europe Market Analysis and Forecast, By Country, 2021 to 2036
- Historical Market Size Value (USD Million) Trend Analysis By Market Taxonomy, 2021 to 2025
- Market Size Value (USD Million) Forecast By Market Taxonomy, 2026 to 2036
- By Country
- Germany
- France
- United Kingdom
- Italy
- Spain
- Benelux
- Nordics
- By Product
- By Application
- By End-Use Industry
- By Fibre Type
- By Country
- Market Attractiveness Analysis
- By Country
- By Product
- By Application
- By End-Use Industry
- By Fibre Type
- Key Takeaways
- Eastern Europe Market Analysis and Forecast, By Country, 2021 to 2036
- Historical Market Size Value (USD Million) Trend Analysis By Market Taxonomy, 2021 to 2025
- Market Size Value (USD Million) Forecast By Market Taxonomy, 2026 to 2036
- By Country
- Poland
- Czech Republic
- Romania
- Hungary
- By Product
- By Application
- By End-Use Industry
- By Fibre Type
- By Country
- Market Attractiveness Analysis
- By Country
- By Product
- By Application
- By End-Use Industry
- By Fibre Type
- Key Takeaways
- East Asia Market Analysis and Forecast, By Country, 2021 to 2036
- Historical Market Size Value (USD Million) Trend Analysis By Market Taxonomy, 2021 to 2025
- Market Size Value (USD Million) Forecast By Market Taxonomy, 2026 to 2036
- By Country
- China
- Japan
- South Korea
- By Product
- By Application
- By End-Use Industry
- By Fibre Type
- By Country
- Market Attractiveness Analysis
- By Country
- By Product
- By Application
- By End-Use Industry
- By Fibre Type
- Key Takeaways
- South Asia and Pacific Market Analysis and Forecast, By Country, 2021 to 2036
- Historical Market Size Value (USD Million) Trend Analysis By Market Taxonomy, 2021 to 2025
- Market Size Value (USD Million) Forecast By Market Taxonomy, 2026 to 2036
- By Country
- India
- ASEAN
- Australia and New Zealand
- By Product
- By Application
- By End-Use Industry
- By Fibre Type
- By Country
- Market Attractiveness Analysis
- By Country
- By Product
- By Application
- By End-Use Industry
- By Fibre Type
- Key Takeaways
- Middle East and Africa Market Analysis and Forecast, By Country, 2021 to 2036
- Historical Market Size Value (USD Million) Trend Analysis By Market Taxonomy, 2021 to 2025
- Market Size Value (USD Million) Forecast By Market Taxonomy, 2026 to 2036
- By Country
- GCC Countries
- South Africa
- Türkiye
- Israel
- By Product
- By Application
- By End-Use Industry
- By Fibre Type
- By Country
- Market Attractiveness Analysis
- By Country
- By Product
- By Application
- By End-Use Industry
- By Fibre Type
- Key Takeaways
- Key Countries Market Analysis
- United States
- Pricing Analysis
- Market Share Analysis, 2025
- By Product
- By Application
- By End-Use Industry
- By Fibre Type
- Canada
- Pricing Analysis
- Market Share Analysis, 2025
- By Product
- By Application
- By End-Use Industry
- By Fibre Type
- Brazil
- Pricing Analysis
- Market Share Analysis, 2025
- By Product
- By Application
- By End-Use Industry
- By Fibre Type
- Mexico
- Pricing Analysis
- Market Share Analysis, 2025
- By Product
- By Application
- By End-Use Industry
- By Fibre Type
- Argentina
- Pricing Analysis
- Market Share Analysis, 2025
- By Product
- By Application
- By End-Use Industry
- By Fibre Type
- Chile
- Pricing Analysis
- Market Share Analysis, 2025
- By Product
- By Application
- By End-Use Industry
- By Fibre Type
- Germany
- Pricing Analysis
- Market Share Analysis, 2025
- By Product
- By Application
- By End-Use Industry
- By Fibre Type
- France
- Pricing Analysis
- Market Share Analysis, 2025
- By Product
- By Application
- By End-Use Industry
- By Fibre Type
- United Kingdom
- Pricing Analysis
- Market Share Analysis, 2025
- By Product
- By Application
- By End-Use Industry
- By Fibre Type
- Italy
- Pricing Analysis
- Market Share Analysis, 2025
- By Product
- By Application
- By End-Use Industry
- By Fibre Type
- Spain
- Pricing Analysis
- Market Share Analysis, 2025
- By Product
- By Application
- By End-Use Industry
- By Fibre Type
- Benelux
- Pricing Analysis
- Market Share Analysis, 2025
- By Product
- By Application
- By End-Use Industry
- By Fibre Type
- Nordics
- Pricing Analysis
- Market Share Analysis, 2025
- By Product
- By Application
- By End-Use Industry
- By Fibre Type
- Poland
- Pricing Analysis
- Market Share Analysis, 2025
- By Product
- By Application
- By End-Use Industry
- By Fibre Type
- Czech Republic
- Pricing Analysis
- Market Share Analysis, 2025
- By Product
- By Application
- By End-Use Industry
- By Fibre Type
- Romania
- Pricing Analysis
- Market Share Analysis, 2025
- By Product
- By Application
- By End-Use Industry
- By Fibre Type
- Hungary
- Pricing Analysis
- Market Share Analysis, 2025
- By Product
- By Application
- By End-Use Industry
- By Fibre Type
- China
- Pricing Analysis
- Market Share Analysis, 2025
- By Product
- By Application
- By End-Use Industry
- By Fibre Type
- Japan
- Pricing Analysis
- Market Share Analysis, 2025
- By Product
- By Application
- By End-Use Industry
- By Fibre Type
- South Korea
- Pricing Analysis
- Market Share Analysis, 2025
- By Product
- By Application
- By End-Use Industry
- By Fibre Type
- India
- Pricing Analysis
- Market Share Analysis, 2025
- By Product
- By Application
- By End-Use Industry
- By Fibre Type
- ASEAN
- Pricing Analysis
- Market Share Analysis, 2025
- By Product
- By Application
- By End-Use Industry
- By Fibre Type
- Australia and New Zealand
- Pricing Analysis
- Market Share Analysis, 2025
- By Product
- By Application
- By End-Use Industry
- By Fibre Type
- GCC Countries
- Pricing Analysis
- Market Share Analysis, 2025
- By Product
- By Application
- By End-Use Industry
- By Fibre Type
- South Africa
- Pricing Analysis
- Market Share Analysis, 2025
- By Product
- By Application
- By End-Use Industry
- By Fibre Type
- Türkiye
- Pricing Analysis
- Market Share Analysis, 2025
- By Product
- By Application
- By End-Use Industry
- By Fibre Type
- Israel
- Pricing Analysis
- Market Share Analysis, 2025
- By Product
- By Application
- By End-Use Industry
- By Fibre Type
- United States
- Market Structure Analysis
- Competition Dashboard
- Competition Benchmarking
- Market Share Analysis of Top Players
- By Region
- By Product
- By Application
- By End-Use Industry
- By Fibre Type
- Emerging Startups
- Innovation Benchmarking
- Competition Analysis
- Competition Deep Dive
- Birla Cellulose
- Overview
- Product Portfolio
- Profitability by Market Segments
- Sales Footprint
- Strategy Overview
- Marketing Strategy
- Product Strategy
- Channel Strategy
- Sateri
- Tangshan Sanyou Group
- Xinjiang Zhongtai Chemical
- Fulida Group
- Lenzing
- Yibin Grace Group
- Century Rayon
- Cordenka
- Kelheim Fibres
- Birla Cellulose
- Case Studies
- Success Stories
- Recent Developments
- Competition Deep Dive
- Assumptions & Acronyms Used
List of Tables
- Table 1: Global Market Value (USD Million) Forecast by Region, 2021 to 2036
- Table 2: Global Market Value (USD Million) Forecast by Product, 2021 to 2036
- Table 3: Global Market Value (USD Million) Forecast by Application, 2021 to 2036
- Table 4: Global Market Value (USD Million) Forecast by End-Use Industry, 2021 to 2036
- Table 5: Global Market Value (USD Million) Forecast by Fibre Type, 2021 to 2036
- Table 6: North America Market Value (USD Million) Forecast by Country, 2021 to 2036
- Table 7: North America Market Value (USD Million) Forecast by Product, 2021 to 2036
- Table 8: North America Market Value (USD Million) Forecast by Application, 2021 to 2036
- Table 9: North America Market Value (USD Million) Forecast by End-Use Industry, 2021 to 2036
- Table 10: North America Market Value (USD Million) Forecast by Fibre Type, 2021 to 2036
- Table 11: Latin America Market Value (USD Million) Forecast by Country, 2021 to 2036
- Table 12: Latin America Market Value (USD Million) Forecast by Product, 2021 to 2036
- Table 13: Latin America Market Value (USD Million) Forecast by Application, 2021 to 2036
- Table 14: Latin America Market Value (USD Million) Forecast by End-Use Industry, 2021 to 2036
- Table 15: Latin America Market Value (USD Million) Forecast by Fibre Type, 2021 to 2036
- Table 16: Western Europe Market Value (USD Million) Forecast by Country, 2021 to 2036
- Table 17: Western Europe Market Value (USD Million) Forecast by Product, 2021 to 2036
- Table 18: Western Europe Market Value (USD Million) Forecast by Application, 2021 to 2036
- Table 19: Western Europe Market Value (USD Million) Forecast by End-Use Industry, 2021 to 2036
- Table 20: Western Europe Market Value (USD Million) Forecast by Fibre Type, 2021 to 2036
- Table 21: Eastern Europe Market Value (USD Million) Forecast by Country, 2021 to 2036
- Table 22: Eastern Europe Market Value (USD Million) Forecast by Product, 2021 to 2036
- Table 23: Eastern Europe Market Value (USD Million) Forecast by Application, 2021 to 2036
- Table 24: Eastern Europe Market Value (USD Million) Forecast by End-Use Industry, 2021 to 2036
- Table 25: Eastern Europe Market Value (USD Million) Forecast by Fibre Type, 2021 to 2036
- Table 26: East Asia Market Value (USD Million) Forecast by Country, 2021 to 2036
- Table 27: East Asia Market Value (USD Million) Forecast by Product, 2021 to 2036
- Table 28: East Asia Market Value (USD Million) Forecast by Application, 2021 to 2036
- Table 29: East Asia Market Value (USD Million) Forecast by End-Use Industry, 2021 to 2036
- Table 30: East Asia Market Value (USD Million) Forecast by Fibre Type, 2021 to 2036
- Table 31: South Asia and Pacific Market Value (USD Million) Forecast by Country, 2021 to 2036
- Table 32: South Asia and Pacific Market Value (USD Million) Forecast by Product, 2021 to 2036
- Table 33: South Asia and Pacific Market Value (USD Million) Forecast by Application, 2021 to 2036
- Table 34: South Asia and Pacific Market Value (USD Million) Forecast by End-Use Industry, 2021 to 2036
- Table 35: South Asia and Pacific Market Value (USD Million) Forecast by Fibre Type, 2021 to 2036
- Table 36: Middle East and Africa Market Value (USD Million) Forecast by Country, 2021 to 2036
- Table 37: Middle East and Africa Market Value (USD Million) Forecast by Product, 2021 to 2036
- Table 38: Middle East and Africa Market Value (USD Million) Forecast by Application, 2021 to 2036
- Table 39: Middle East and Africa Market Value (USD Million) Forecast by End-Use Industry, 2021 to 2036
- Table 40: Middle East and Africa Market Value (USD Million) Forecast by Fibre Type, 2021 to 2036
List of Figures
- Figure 1: Global Market Pricing Analysis
- Figure 2: Global Market Value (USD Million) Forecast 2021-2036
- Figure 3: Global Market Value Share and BPS Analysis by Product, 2026 and 2036
- Figure 4: Global Market Y-o-Y Growth Comparison by Product, 2026-2036
- Figure 5: Global Market Attractiveness Analysis by Product
- Figure 6: Global Market Value Share and BPS Analysis by Application, 2026 and 2036
- Figure 7: Global Market Y-o-Y Growth Comparison by Application, 2026-2036
- Figure 8: Global Market Attractiveness Analysis by Application
- Figure 9: Global Market Value Share and BPS Analysis by End-Use Industry, 2026 and 2036
- Figure 10: Global Market Y-o-Y Growth Comparison by End-Use Industry, 2026-2036
- Figure 11: Global Market Attractiveness Analysis by End-Use Industry
- Figure 12: Global Market Value Share and BPS Analysis by Fibre Type, 2026 and 2036
- Figure 13: Global Market Y-o-Y Growth Comparison by Fibre Type, 2026-2036
- Figure 14: Global Market Attractiveness Analysis by Fibre Type
- Figure 15: Global Market Value (USD Million) Share and BPS Analysis by Region, 2026 and 2036
- Figure 16: Global Market Y-o-Y Growth Comparison by Region, 2026-2036
- Figure 17: Global Market Attractiveness Analysis by Region
- Figure 18: North America Market Incremental Dollar Opportunity, 2026-2036
- Figure 19: Latin America Market Incremental Dollar Opportunity, 2026-2036
- Figure 20: Western Europe Market Incremental Dollar Opportunity, 2026-2036
- Figure 21: Eastern Europe Market Incremental Dollar Opportunity, 2026-2036
- Figure 22: East Asia Market Incremental Dollar Opportunity, 2026-2036
- Figure 23: South Asia and Pacific Market Incremental Dollar Opportunity, 2026-2036
- Figure 24: Middle East and Africa Market Incremental Dollar Opportunity, 2026-2036
- Figure 25: North America Market Value Share and BPS Analysis by Country, 2026 and 2036
- Figure 26: North America Market Value Share and BPS Analysis by Product, 2026 and 2036
- Figure 27: North America Market Y-o-Y Growth Comparison by Product, 2026-2036
- Figure 28: North America Market Attractiveness Analysis by Product
- Figure 29: North America Market Value Share and BPS Analysis by Application, 2026 and 2036
- Figure 30: North America Market Y-o-Y Growth Comparison by Application, 2026-2036
- Figure 31: North America Market Attractiveness Analysis by Application
- Figure 32: North America Market Value Share and BPS Analysis by End-Use Industry, 2026 and 2036
- Figure 33: North America Market Y-o-Y Growth Comparison by End-Use Industry, 2026-2036
- Figure 34: North America Market Attractiveness Analysis by End-Use Industry
- Figure 35: North America Market Value Share and BPS Analysis by Fibre Type, 2026 and 2036
- Figure 36: North America Market Y-o-Y Growth Comparison by Fibre Type, 2026-2036
- Figure 37: North America Market Attractiveness Analysis by Fibre Type
- Figure 38: Latin America Market Value Share and BPS Analysis by Country, 2026 and 2036
- Figure 39: Latin America Market Value Share and BPS Analysis by Product, 2026 and 2036
- Figure 40: Latin America Market Y-o-Y Growth Comparison by Product, 2026-2036
- Figure 41: Latin America Market Attractiveness Analysis by Product
- Figure 42: Latin America Market Value Share and BPS Analysis by Application, 2026 and 2036
- Figure 43: Latin America Market Y-o-Y Growth Comparison by Application, 2026-2036
- Figure 44: Latin America Market Attractiveness Analysis by Application
- Figure 45: Latin America Market Value Share and BPS Analysis by End-Use Industry, 2026 and 2036
- Figure 46: Latin America Market Y-o-Y Growth Comparison by End-Use Industry, 2026-2036
- Figure 47: Latin America Market Attractiveness Analysis by End-Use Industry
- Figure 48: Latin America Market Value Share and BPS Analysis by Fibre Type, 2026 and 2036
- Figure 49: Latin America Market Y-o-Y Growth Comparison by Fibre Type, 2026-2036
- Figure 50: Latin America Market Attractiveness Analysis by Fibre Type
- Figure 51: Western Europe Market Value Share and BPS Analysis by Country, 2026 and 2036
- Figure 52: Western Europe Market Value Share and BPS Analysis by Product, 2026 and 2036
- Figure 53: Western Europe Market Y-o-Y Growth Comparison by Product, 2026-2036
- Figure 54: Western Europe Market Attractiveness Analysis by Product
- Figure 55: Western Europe Market Value Share and BPS Analysis by Application, 2026 and 2036
- Figure 56: Western Europe Market Y-o-Y Growth Comparison by Application, 2026-2036
- Figure 57: Western Europe Market Attractiveness Analysis by Application
- Figure 58: Western Europe Market Value Share and BPS Analysis by End-Use Industry, 2026 and 2036
- Figure 59: Western Europe Market Y-o-Y Growth Comparison by End-Use Industry, 2026-2036
- Figure 60: Western Europe Market Attractiveness Analysis by End-Use Industry
- Figure 61: Western Europe Market Value Share and BPS Analysis by Fibre Type, 2026 and 2036
- Figure 62: Western Europe Market Y-o-Y Growth Comparison by Fibre Type, 2026-2036
- Figure 63: Western Europe Market Attractiveness Analysis by Fibre Type
- Figure 64: Eastern Europe Market Value Share and BPS Analysis by Country, 2026 and 2036
- Figure 65: Eastern Europe Market Value Share and BPS Analysis by Product, 2026 and 2036
- Figure 66: Eastern Europe Market Y-o-Y Growth Comparison by Product, 2026-2036
- Figure 67: Eastern Europe Market Attractiveness Analysis by Product
- Figure 68: Eastern Europe Market Value Share and BPS Analysis by Application, 2026 and 2036
- Figure 69: Eastern Europe Market Y-o-Y Growth Comparison by Application, 2026-2036
- Figure 70: Eastern Europe Market Attractiveness Analysis by Application
- Figure 71: Eastern Europe Market Value Share and BPS Analysis by End-Use Industry, 2026 and 2036
- Figure 72: Eastern Europe Market Y-o-Y Growth Comparison by End-Use Industry, 2026-2036
- Figure 73: Eastern Europe Market Attractiveness Analysis by End-Use Industry
- Figure 74: Eastern Europe Market Value Share and BPS Analysis by Fibre Type, 2026 and 2036
- Figure 75: Eastern Europe Market Y-o-Y Growth Comparison by Fibre Type, 2026-2036
- Figure 76: Eastern Europe Market Attractiveness Analysis by Fibre Type
- Figure 77: East Asia Market Value Share and BPS Analysis by Country, 2026 and 2036
- Figure 78: East Asia Market Value Share and BPS Analysis by Product, 2026 and 2036
- Figure 79: East Asia Market Y-o-Y Growth Comparison by Product, 2026-2036
- Figure 80: East Asia Market Attractiveness Analysis by Product
- Figure 81: East Asia Market Value Share and BPS Analysis by Application, 2026 and 2036
- Figure 82: East Asia Market Y-o-Y Growth Comparison by Application, 2026-2036
- Figure 83: East Asia Market Attractiveness Analysis by Application
- Figure 84: East Asia Market Value Share and BPS Analysis by End-Use Industry, 2026 and 2036
- Figure 85: East Asia Market Y-o-Y Growth Comparison by End-Use Industry, 2026-2036
- Figure 86: East Asia Market Attractiveness Analysis by End-Use Industry
- Figure 87: East Asia Market Value Share and BPS Analysis by Fibre Type, 2026 and 2036
- Figure 88: East Asia Market Y-o-Y Growth Comparison by Fibre Type, 2026-2036
- Figure 89: East Asia Market Attractiveness Analysis by Fibre Type
- Figure 90: South Asia and Pacific Market Value Share and BPS Analysis by Country, 2026 and 2036
- Figure 91: South Asia and Pacific Market Value Share and BPS Analysis by Product, 2026 and 2036
- Figure 92: South Asia and Pacific Market Y-o-Y Growth Comparison by Product, 2026-2036
- Figure 93: South Asia and Pacific Market Attractiveness Analysis by Product
- Figure 94: South Asia and Pacific Market Value Share and BPS Analysis by Application, 2026 and 2036
- Figure 95: South Asia and Pacific Market Y-o-Y Growth Comparison by Application, 2026-2036
- Figure 96: South Asia and Pacific Market Attractiveness Analysis by Application
- Figure 97: South Asia and Pacific Market Value Share and BPS Analysis by End-Use Industry, 2026 and 2036
- Figure 98: South Asia and Pacific Market Y-o-Y Growth Comparison by End-Use Industry, 2026-2036
- Figure 99: South Asia and Pacific Market Attractiveness Analysis by End-Use Industry
- Figure 100: South Asia and Pacific Market Value Share and BPS Analysis by Fibre Type, 2026 and 2036
- Figure 101: South Asia and Pacific Market Y-o-Y Growth Comparison by Fibre Type, 2026-2036
- Figure 102: South Asia and Pacific Market Attractiveness Analysis by Fibre Type
- Figure 103: Middle East and Africa Market Value Share and BPS Analysis by Country, 2026 and 2036
- Figure 104: Middle East and Africa Market Value Share and BPS Analysis by Product, 2026 and 2036
- Figure 105: Middle East and Africa Market Y-o-Y Growth Comparison by Product, 2026-2036
- Figure 106: Middle East and Africa Market Attractiveness Analysis by Product
- Figure 107: Middle East and Africa Market Value Share and BPS Analysis by Application, 2026 and 2036
- Figure 108: Middle East and Africa Market Y-o-Y Growth Comparison by Application, 2026-2036
- Figure 109: Middle East and Africa Market Attractiveness Analysis by Application
- Figure 110: Middle East and Africa Market Value Share and BPS Analysis by End-Use Industry, 2026 and 2036
- Figure 111: Middle East and Africa Market Y-o-Y Growth Comparison by End-Use Industry, 2026-2036
- Figure 112: Middle East and Africa Market Attractiveness Analysis by End-Use Industry
- Figure 113: Middle East and Africa Market Value Share and BPS Analysis by Fibre Type, 2026 and 2036
- Figure 114: Middle East and Africa Market Y-o-Y Growth Comparison by Fibre Type, 2026-2036
- Figure 115: Middle East and Africa Market Attractiveness Analysis by Fibre Type
- Figure 116: Global Market - Tier Structure Analysis
- Figure 117: Global Market - Company Share Analysis
Frequently Asked Questions
How big is the Rayon Fiber Market in 2026?
Future Market Insights estimates the global rayon fiber market at USD 11.3 billion in 2026, projected to reach USD 15.9 billion by 2036.
How fast is the Rayon Fiber Market expected to grow through 2036?
FMI projects a 3.5% CAGR from 2026 to 2036, taking the global market from USD 11.3 billion in 2026 to USD 15.9 billion by 2036.
Which product segment leads the Rayon Fiber Market?
Viscose staple fibre leads the product segment with a 74.0% share in 2026, supported by its compatibility with conventional spinning processes and nonwoven manufacturing applications.
Which application segment leads the Rayon Fiber Market?
Apparel accounts for the largest application share at 59.1% in 2026, driven by fibre requirements for fabric drape, comfort, and compatibility with blended textiles.
Which countries are expected to grow fastest in the Rayon Fiber Market?
Pakistan is projected to record the fastest growth at a 3.9% CAGR from 2026 to 2036, followed by Indonesia at 3.8% over the same period.
Which companies are profiled in the Rayon Fiber Market?
The key companies profiled in the rayon fiber market include Lenzing, Birla Cellulose, Sateri, Tangshan Sanyou Group, Xinjiang Zhongtai Chemical, Fulida Group, Kelheim Fibres, Cordenka, Yibin Grace Group, and Century Rayon. Kelheim Fibres is included for its documented historical specialty fibre operations, although its operations were scheduled to end in March 2026.
Preview the report firsthand - request a free sample
Get SampleGet the brochure for pricing and purchase details.
Get PDF
