

- Market Size (2026)
- USD 73.6 Mn
- Forecast (2036)
- USD 247.7 Mn
- CAGR (2026 to 2036)
- 12.9%
How big is Rhizosphere Nutrient Boosters Market in 2026?
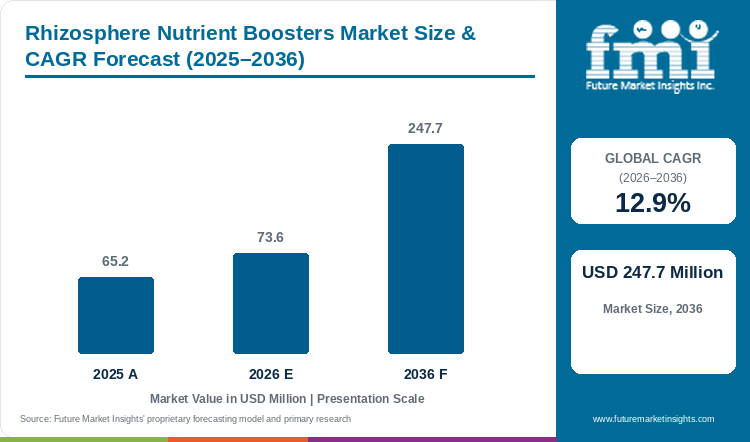
Demand for rhizosphere nutrient boosters is projected to expand at 12.9% CAGR between 2026 and 2036. Industry value grows from USD 65.2 million in 2025 to USD 73.6 million in 2026 and is projected to reach USD 247.7 million by 2036.
FMI analysts track the rise in fertilizer prices and need for using every applied nutrient which is supporting demand for rhizosphere nutrient boosters. In July 2026, USDA announced USD 500 million for domestic fertilizer production, showing that fertilizer cost still remains important in crop budgets.[1] Sales of rhizosphere nutrient boosters are estimated to rise at 12.9% CAGR through 2036. Market valuation increases from USD 65.2 million in 2025 to USD 73.6 million in 2026 and is estimated to reach USD 247.7 million by 2036. Products which fit in a crop pass are likely to receive higher adoption, while shelf-stable formulations having field documents are creating premium-grade shift.
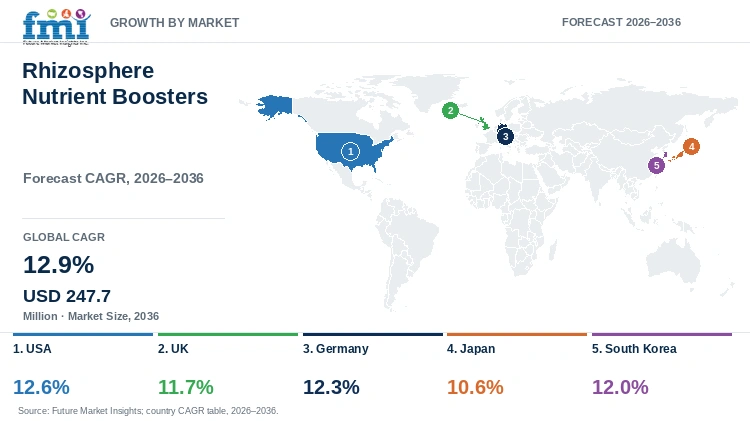
Regional buying will remain different, as fertilizer planning protocols and grower validation thresholds diverge across markets. The USA is projected to grow at 12.6% CAGR, whereas Germany is expected to rise at 12.3% through 2036. USA growth is contributed by fertilizer-cost pressure and dealer trials against per-acre nutrient spending. Germany reported in May 2026 that its five-year nitrogen surplus declined 40% since 1994 and first reached the 70 kg per hectare target in 2023.[2] This is increasing demand for defined placement, stable viability and nutrient-efficiency evidence. Therefore, local trials, claim documents and compatibility with present application method will remain the final commercial filter.
Key Takeaways
- Increasing fertilizer prices and need for better nutrient-use is supporting the adoption of products that improve access to nitrogen, phosphorus and other nutrients.
- Single-strain products are anticipated to hold 40.3% share in 2026, owing to comparatively simpler production and viability control.
- Cereals and grains are estimated to hold 49.7% of crop type revenue in 2026, owing to wide planted area and repeatable nutrient application routines.
- Soil application is expected to lead with 48.2% share in 2026, as it places the organisms directly around the root zone.
- The USA is projected to grow at 12.6% CAGR and Germany at 12.3%, due to different fertilizer-cost and nutrient-management conditions.
- Some of the key participants are Sound Agriculture, Rizobacter, Lallemand Plant Care, Indigo Ag, Kula Bio, BASF, Bayer Crop Science and Verdesian Life Sciences. The companies are mainly differentiating through strains, formats, field evidence and agronomy support.
Analyst Perspective
“Shelf-stable products will move biological nutrients into regular dealer-led crop programs. Local response evidence will decide which formulations receive repeat farm demand.”
- Nikhil Kaitwade, Principal Consultant, Future Market Insights.
How is the rhizosphere nutrient boosters market segmented?
Rhizosphere nutrient boosters market is segmented by five primary commercial axes and region: product type, crop type, application method, farm type, sales channel, and region. In 2026, single-strain products are estimated at 40.3%, cereals and grains at 49.7%, soil application at 48.2%, large commercial farms at 37.2%, and agri-input distributors at 42.0% within their respective categories.
As per FMI, rhizosphere nutrient boosters market is segmented on the basis of product type into single-strain products, multi-strain consortia, microbe + nutrient combos and others.
By crop type, the market is segmented into cereals and grains, fruits and vegetables, oilseeds and pulses, turf and ornamentals and others.
By application method, the market is segmented into soil application, foliar application, fertigation or drip, seed application and others.
By farm type, the market is segmented into large commercial farms, mid-size farms, smallholders, greenhouses and nurseries and others.
By sales channel, the market is segmented into agri-input distributors, cooperatives, agri-retail chains, online or direct-to-farm and others.
By region, the market is segmented across North America, Latin America, Western Europe, Eastern Europe, East Asia, South Asia and Pacific and Middle East and Africa.
Why do single-strain products retain product type demand?
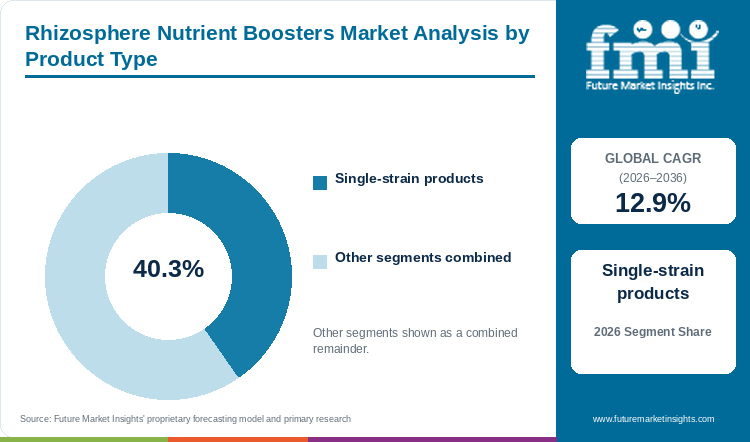
Based on product type, single-strain products are projected to account for 40.3% in 2026, supported by simpler strain control.
Single-strain products contain one defined organism, due to which one viability profile can be managed during production, storage and application. According to FMI, this comparatively simpler handling is supporting the segment share. A 2025 Bacillus study completed 20 selection cycles and reported 1.5 to 2.9-fold higher root colonization than the ancestral strain.[3] This shows that a selected strain can improve its root activity; however, the same can create market value only when organism remains viable until field application.
- Single-strain products are projected to hold 40.3% share, as buyers can relate storage, placement and expected function with one organism.
- Commercial adoption is expected to remain higher where storage life and field placement can be managed without changing the crop routine.
What supports cereals and grains as the preferred crop type?
By crop type, cereals and grains are estimated to hold 49.7% in 2026, owing to broad-acre nutrient cost exposure.
Cereals and grains cover larger planted area and also use high amount of crop nutrients, due to which even modest nutrient response can create visible per-acre value. In the FMI report, broad-acre nutrient spending and repeatable field operations are supporting the segment position. In June 2025, Primacy Alpha received the Certified Biostimulant label for cereals and other crops.[4] This gives distributors a documented review point and is likely to support its use in repeated cereal programs.
- Cereals and grains are expected to hold 49.7% share, owing to large nutrient spending and repeatable field operations.
- Use through an existing cereal pass is likely to increase acceptance, as another field operation can reduce the per-acre benefit.
How does soil application meet root-zone nutrient needs?
In 2026, soil application is expected to lead application method with 48.2% share, enabled by direct root-zone placement.
Soil application places the formulation near the roots, where nutrient exchange and microbial colonization takes place. FMI research indicates that this direct placement is the major factor supporting the segment demand. In February 2026, Kula Bio launched soluble powders for direct root-zone delivery without cold storage.[5] The soluble format removes one handling issue and is likely to increase the adoption through existing soil application programs.
- Soil application is estimated to account for 48.2% share, as direct placement supports quicker contact between organisms, roots and available nutrients.
- Direct root-zone placement also lowers dependence on movement through soil before the organism reaches the active roots.
Why are large commercial farms suited to standardized use?
Large commercial farms are likely to capture 37.2% share in 2026, aided by repeatable placement over larger acreages.
Large commercial farms can compare treated and untreated acres while maintaining the same nutrient program. FMI data suggests that repeatable placement and the ability to record response is supporting the segment demand. The proposed 2026 USDA nutrient-management standard requires a crop-rotation nutrient budget and annual application strategy.[6] Such farm records can help in checking whether a booster is giving enough nutrient response for repeat purchase.
- Large commercial farms are projected to hold 37.2% share, as the same placement and measurement process can be repeated across wider acreage.
- These farms can use field records to compare response without changing the complete fertilizer program in the first season.
What keeps agri-input distributors central to the sales channel?
Agri-input distributors are set to lead sales channel with 42.0% share in 2026, reinforced by local agronomy support.
Agri-input distributors screen biological products for crop fit, storage, product handling and local field response before recommending the same. As noted by FMI, this local screening and placement support keeps distributors close to the buying decision. The Fertilizer Institute described its 2026 biostimulant label around efficacy, composition and safety requirements.[7] Growers also require practical guidance regarding product rate, mixing and placement, which is further supporting the segment demand.
- Agri-input distributors are expected to lead with 42.0% share, because farm recommendations commonly require product screening and placement support.
- Local agronomy support is likely to remain important, as response can change with soil, moisture, crop and application timing.
What are the drivers, restraints, and opportunities in the rhizosphere nutrient boosters market?
In the rhizosphere nutrient boosters market, the key driver is fertilizer efficiency, the key restraint is field variability, and the key opportunity is shelf-stable delivery.
- Driver: Fertilizer cost and nutrient planning expand interest in products that can improve nutrient access within existing programs.
- Restraint: Strain survival and variable soil conditions can weaken repeatability between trials, fields, and seasons.
- Opportunity: Shelf-stable powders and seed or root-zone delivery can remove handling steps and widen usable commercial routes.
Fertilizer Cost Pressures Support Nutrient Efficiency
Fertilizer cost remains visible in every crop budget, due to which growers are comparing nutrient boosters with the existing fertilizer program and not as a separate input. FAO updated its global fertilizer-by-nutrient series in July 2026 for nitrogen, phosphorus and potassium.[8] This keeps fertilizer supply and agricultural use measurable across countries. Products which improve nutrient access and do not require another field pass are therefore expected to receive higher trial demand.
Field and Environmental Conditions Constrain Repeatability
Microbial products enter fields having different moisture, temperature, soil chemistry and resident microbiomes, due to which the final response can change between fields and seasons. A December 2025 study reported 9.6% increase in rice yield with a Bacillus-modified bio-organic fertilizer, while available phosphorus increased 24.5% and potassium rose 14.4%.[9] The result supports the nutrient mechanism; however, it also shows that crop, soil and placement evidence will be required before wider commercial adoption.
Shelf-Stable Formulations Expand Commercial Delivery Routes
Shelf-stable formats can remove cold storage and one of the major handling problems associated with biological products. In May 2026, BASF commissioned a fermentation BioHub for biological and biotechnology-based crop inputs.[10] In-house production can support better control over microbial active ingredients and supply continuity. Similar production control is expected to help nutrient-booster companies in maintaining viable products and consistent inventory during the crop season.
Which country CAGRs are profiled in the rhizosphere nutrient boosters market?
| Country | CAGR |
|---|---|
| USA | 12.6% |
| UK | 11.7% |
| Germany | 12.3% |
| Japan | 10.6% |
| South Korea | 12.0% |
How do country-level CAGRs compare in the rhizosphere nutrient boosters market?
As per the analysis from FMI, country demand is expected to remain positive but growth will not be same, as farm economics, nutrient rules and buying routes are different. USA demand will be influenced by fertilizer cost and dealer trials, while the UK has nutrient plans where advisers can check product timing and response. Germany will require stronger efficiency evidence owing to measured nitrogen-surplus targets. Japan and South Korea are likely to move through policy-supported routes such as soil diagnosis, low-carbon agriculture and smart-farm records.
Country outlook is positive but not uniform. Cost exposure shapes the USA, documented plans support the UK, and nutrient-surplus controls influence Germany.
Japan and South Korea follow policy-led routes. Japan links adoption to food-security and environmental planning, while South Korea adds low-carbon certification and smart-farm programs.
- USA: nutrient budgets and dealer validation define whether a product moves from trial acres to regular use.
- UK: nutrient plans give advisers a ready place to compare product timing, crop fit, and expected nutrient response.
- Germany: measured nitrogen surplus keeps nutrient efficiency and claim documentation close to the buying decision.
- Japan: national food and agriculture planning supports technologies that can improve input productivity under local crop routines.
- South Korea: low-carbon certification and smart-farming targets create formal routes for documented farm technologies.
Full report country CAGRs cover: North America; Latin America; Western Europe; Eastern Europe; East Asia; South Asia and Pacific; Middle East and Africa.
Country-wise Analysis
- The USA rhizosphere nutrient boosters sector is forecast to grow at 12.6% CAGR through 2036, attributed to fertilizer affordability and nutrient planning. In February 2026, USDA Economic Research Service reported that U.S. farm sector fertilizer expenses reached USD 35.8 billion, confirming that nutrient costs remain a major farm expenditure.[11] Corn, wheat and soybean growers can compare a biological input with familiar nutrient cost per acre. However, soil and weather can change the response, due to which dealer trials and field records will decide whether a product moves from trial acres towards regular use.
- Demand in the UK is projected to rise at 11.7% CAGR over the forecast period, supported by the existing nutrient-planning system. Defra reported in June 2026 that 69% of farmers had a nutrient management plan, of which 71% updated the same annually and 90% used it at least once every year.[12] Contractors or advisers prepared 47% of these plans. This gives nutrient boosters a place for checking timing, crop fit and expected response without replacing the complete fertilizer program.
- Germany is estimated to grow at 12.3% CAGR through 2036, owing to increasing focus on measured nitrogen efficiency. In March 2026, the Federal Statistical Office of Germany (Destatis) reported that domestic sales of mineral nitrogen fertilizer dropped 6.8% to 1.15 million tonnes of nitrogen, reflecting compliance with mandatory nutrient limits.[13] This is increasing the proof required from products presented as nutrient-efficiency tools. Formulations having stable viability, defined placement and local trial evidence are likely to gain comparatively higher acceptance.
- Rhizosphere nutrient booster demand in Japan is expected to expand at 10.6% CAGR through 2036, driven by tighter fertilizer planning. MAFF updated its fertilizer information in August 2026 with guidance related to soil diagnosis, fertilizer-reduction standards and domestic nutrient resources.[14] Biological boosters can enter this system as measured additions and not broad fertilizer substitutes. Therefore, registration, crop routine and compatibility with the existing application method will remain the major purchase conditions.
- Sales in South Korea are forecast to rise at 12.0% CAGR through 2036, supported by data-based agriculture. In July 2026, MAFRA released an agricultural AI data strategy containing 15 tasks under four national strategies.[15] Better farm records can connect nutrient response with soil, weather and crop information. The policy does not directly create biological-input sales; however, it provides a suitable route for documented field evaluation and can support repeatable products through smart-farm and distributor programs.
Who are the notable companies in the rhizosphere nutrient boosters market?
Sound Agriculture, Rizobacter, Lallemand Plant Care, Indigo Ag, Kula Bio, BASF, Bayer Crop Science, and Verdesian Life Sciences are notable companies profiled in this market.
The market is moderately fragmented, as public evidence does not show one company controlling this defined category. An FMI analyst notes that nutrient-efficiency platforms are competing with inoculant specialists and large crop-input companies. Buyers compare strain function, shelf life, application fit and local agronomy support before making repeat purchases. Therefore, practical formulation and field proof at distributor level are expected to remain the major factors differentiating similar products.
- Nutrient-efficiency platforms: Sound Agriculture, Verdesian Life Sciences and Indigo Ag connect product function with dealer or direct farm programs.
- Microbial inoculant specialists: Rizobacter, Lallemand Plant Care and Kula Bio are focused on seed and root-associated nutrient functions.
- Scaled crop-input platforms: BASF and Bayer Crop Science use established crop-input infrastructure for developing and supplying biological products.
Competitive Benchmarking: Rhizosphere Nutrient Boosters Market
| Company | Nutrient function | Delivery flexibility | Agronomy support | Geographic reach |
|---|---|---|---|---|
| Sound Agriculture | High | Medium | High | Medium |
| Rizobacter | Medium | Medium | Medium | High |
| Lallemand Plant Care | High | Medium | Medium | High |
| Indigo Ag | Medium | High | High | Medium |
| Kula Bio | Medium | High | Medium | Low |
| BASF | High | High | High | High |
| Bayer Crop Science | High | Medium | High | High |
| Verdesian Life Sciences | High | High | High | High |
High shows wider public evidence against the selected criterion, while Medium reflects a narrower evidence base and Low indicates limited documented reach. These ratings explain current capability and do not rank product quality or company revenue share.
Key Developments in the Rhizosphere Nutrient Boosters Market
- In February 2026, Kula Bio launched Kula-N SP and Kula-Next SP as shelf-stable soluble powders for root-zone delivery without cold storage, which can make product handling easier.
- In June 2025, Verdesian Life Sciences announced that Primacy Alpha received the Certified Biostimulant label for cereals and other crops, providing a documented review point for distributors.
- In May 2025, Syngenta Seedcare and Rizobacter entered into a South African collaboration for biological seed treatments, increasing the route for microbial delivery through seed programs.
- In February 2025, Lallemand Plant Care introduced a pulse inoculant having two rhizobia strains and one Bacillus strain, which is expected to support broader root-zone functions.
Key Players in the Rhizosphere Nutrient Boosters Market
Nutrient-Efficiency Platforms
- Sound Agriculture
- Verdesian Life Sciences
- Indigo Ag
Microbial Inoculant Specialists
- Rizobacter
- Lallemand Plant Care
- Kula Bio
Scaled Crop-Input Platforms
- BASF
- Bayer Crop Science
Rhizosphere Nutrient Boosters Market - Report Scope
| Coverage field | Report scope |
|---|---|
| Market breakdown | Product type; crop type; application method; farm type; sales channel; region. |
| Quantitative units | USD million. |
| Market definition | Commercial agricultural inputs sold to improve nutrient availability, capture, or nutrient-use efficiency through beneficial microorganisms or rhizosphere-active biochemistry. Conventional bulk fertilizers and biological crop-protection products sold mainly for pest control are excluded. |
| Regions covered | North America; Latin America; Western Europe; Eastern Europe; East Asia; South Asia and Pacific; Middle East and Africa. |
| Countries covered | USA; UK; Germany; Japan; South Korea; additional countries in the full report. |
| Key companies profiled | Sound Agriculture; Rizobacter; Lallemand Plant Care; Indigo Ag; Kula Bio; BASF; Bayer Crop Science; Verdesian Life Sciences. |
| Forecast period | 2026 to 2036. |
| Approach | The report covers defined product revenue, segment structure, company participation, and country demand conditions. |
Rhizosphere Nutrient Boosters Market - Research Methodology
| Method | Approach |
|---|---|
| Primary Research | Analysts gathered input from manufacturers, service providers, technology developers, distributors, end users, procurement teams, and subject-matter experts. Interviews examined purchasing decisions, product or service evaluation, adoption barriers, approval requirements, pricing considerations, and expectations for technical or commercial support. Respondents were also asked what evidence is required before a trial, pilot, or initial order develops into regular purchasing. |
| Desk Research | Desk research covered government statistics, regulatory publications, trade data, industry associations, technical literature, standards, company filings, product information, and official corporate announcements. Sources were reviewed for relevance, publication date, geographic coverage, and consistency with the defined market scope. Claims relating to performance, applications, approvals, capacity, investment, and commercial activity were retained only when supported by credible public evidence. |
| Market Sizing and Forecasting | The market model combined the baseline value with historical performance, segment structure, pricing and volume indicators, adoption levels, company participation, and country-level demand conditions. Forecast assumptions considered economic activity, investment trends, regulatory developments, technology adoption, purchasing cycles, supply availability, and barriers to wider market use. Segment and regional estimates were reconciled before the final market total was calculated. |
| Data Validation | Estimates were checked against multiple independent indicators, including public data, company activity, trade patterns, industry developments, and findings from primary interviews. Validation also tested whether products, services, applications, and company revenues fell within the defined market boundaries. Adjacent categories, unsupported claims, overlapping revenues, and activities without direct market relevance were excluded to reduce double counting and maintain consistency across segments and countries. |
Rhizosphere Nutrient Boosters Market by Segments
Rhizosphere Nutrient Boosters Market segmented by Product Type:
- Single-strain products
- Multi-strain consortia
- Microbe + nutrient combos
- Others
Rhizosphere Nutrient Boosters Market segmented by Crop Type:
- Cereals and grains
- Fruits and vegetables
- Oilseeds and pulses
- Turf and ornamentals
- Others
Rhizosphere Nutrient Boosters Market segmented by Application Method:
- Soil application
- Foliar application
- Fertigation or drip
- Seed application
- Others
Rhizosphere Nutrient Boosters Market segmented by Farm Type:
- Large commercial farms
- Mid-size farms
- Smallholders
- Greenhouses and nurseries
- Others
Rhizosphere Nutrient Boosters Market segmented by Sales Channel:
- Agri-input distributors
- Cooperatives
- Agri-retail chains
- Online or direct-to-farm
- Others
Rhizosphere Nutrient Boosters Market by Region
- North America
- United States
- Canada
- Latin America
- Brazil
- Mexico
- Argentina
- Chile
- Western Europe
- Germany
- France
- United Kingdom
- Italy
- Spain
- Benelux
- Nordics
- Eastern Europe
- Poland
- Czech Republic
- Romania
- Hungary
- East Asia
- China
- Japan
- South Korea
- South Asia and Pacific
- India
- ASEAN
- Australia and New Zealand
- Middle East and Africa
- GCC Countries
- South Africa
- Türkiye
- Israel
Research Sources and Bibliography
- [1] U.S. Department of Agriculture. (2026, July 1). Secretary Rollins announces USD 500 million for Fertilizer Investment and Expansion Program to strengthen America’s fertilizer supply chain.
- [2] German Environment Agency. (2026, May 3). Indicator: Agricultural nitrogen surplus.
- [3] Frontiers in Microbiology. (2025, August 4). Rhizosphere domestication enhances root colonization and plant growth promotion performance of Bacillus velezensis SQR9.
- [4] Verdesian Life Sciences. (2025, June 27). Primacy Alpha earns Certified Biostimulant label from The Fertilizer Institute.
- [5] Kula Bio. (2026, February 2). Kula Bio launches soluble powder line of nitrogen-fixing biological products.
- [6] Natural Resources Conservation Service. (2026). Conservation Practice Standard: Nutrient Management, Code 590.
- [7] The Fertilizer Institute. (2026). Certified Biostimulant Program.
- [8] Food and Agriculture Organization of the United Nations. (2026, July 30). Fertilizers by nutrient: July 2026 update.
- [9] Frontiers in Microbiology. (2025, December 4). Bio-organic fertilizers reshape rhizosphere bacterial community and enhance crop productivity in reclaimed soil.
- [10] BASF. (2026, May 11). BASF Agricultural Solutions successfully commissions new fermentation plant for crop protection products in Ludwigshafen.
- [11] U.S. Department of Agriculture Economic Research Service. (2026, February 5). Farm sector income and finances: Production expenses.
- [12] Department for Environment, Food & Rural Affairs. (2026, June 11). Nutrient management: Farm Practices Survey February 2026.
- [13] Federal Statistical Office of Germany (Destatis). (2026, March 18). Commercial fertilizer sales in Germany.
- [14] Ministry of Agriculture, Forestry and Fisheries, Japan. (2026, August). Fertilizer information.
- [15] Ministry of Agriculture, Food and Rural Affairs, Republic of Korea. (2026, July 14). S. Korea establishes data strategy for AI transformation in agriculture and rural area.
- [16] Syngenta South Africa. (2025, May 27). Syngenta Seedcare and Rizobacter collaborate on biological seed treatments in South Africa.
- [17] Indigo Ag. (2026, January 29). Pivot Bio, Indigo Ag, AgriThority lead the charge on biologicals research.
- [18] Bayer SeedGrowth. (2025, April 15). SeedGrowth portfolio takes a step up with biological seed treatments Ibisio, Yoalo and Susteed.
- [19] Sound Agriculture. (2026). Fertilizer Replacement Grower Program description.
This bibliography is provided for reader reference. The full report contains the complete reference list and detailed citations.
This Report Answers
- What is Rhizosphere Nutrient Boosters Market worth during 2026?
- What value is Rhizosphere Nutrient Boosters Market projected by 2036?
- Which product type holds notable Rhizosphere Nutrient Boosters Market share?
- Which crop type holds notable Rhizosphere Nutrient Boosters Market share?
- Which countries have notable Rhizosphere Nutrient Boosters Market growth?
- Which companies are notable in Rhizosphere Nutrient Boosters Market today?
Frequently Asked Questions
How large is the Rhizosphere Nutrient Boosters Market expected to be in 2026?
Future Market Insights estimates that the rhizosphere nutrient boosters market will reach USD 73.6 million in 2026, up from USD 65.2 million in 2025. The market is projected to expand further and reach USD 247.7 million by 2036.
What CAGR is forecast for the Rhizosphere Nutrient Boosters Market through 2036?
As per FMI, the rhizosphere nutrient boosters market is projected to grow at a 12.9% CAGR from 2026 to 2036. Growth is supported by increasing fertilizer prices and demand for measurable nutrient-use efficiency around root zones.
Which product type holds a notable rhizosphere nutrient boosters demand share in 2026?
Future Market Insights projects single-strain products to hold 40.3% of product type demand in 2026. The segment benefits from comparatively simpler manufacturing quality control, storage stability, and viable cell placement during field application.
Which crop type holds a notable rhizosphere nutrient boosters share in 2026?
FMI finds that cereals and grains will hold 49.7% of crop type demand in 2026. Demand is supported by broad planted acreages, heavy nutrient investment, and repeatable application routines.
Which country has a notable rhizosphere nutrient boosters expansion outlook during the forecast period?
Future Market Insights predicts the USA to expand at a 12.6% CAGR during the 2026 to 2036 assessment period. Growth is supported by fertilizer economics, grower cost sensitivity, and expanding dealer-led demonstration trials across row-crop platforms.
Which companies are active in the Rhizosphere Nutrient Boosters Market during 2026?
As per FMI analysis, notable companies include Sound Agriculture, Rizobacter, Lallemand Plant Care, Indigo Ag, Kula Bio, BASF, Bayer Crop Science, and Verdesian Life Sciences. These companies are focusing on shelf-stable formulation lines, seed-applied delivery options, and documented agronomic response trials.
Preview the report firsthand - request a free sample
Get SampleGet the brochure for pricing and purchase details.
Get PDFTable of Content
- Key Takeaways
- Market Size and CAGR
- Top Growth Driver
- Fastest Growing Segment
- Leading Region
- Key Companies
- Emerging Opportunities
- Executive Summary
- Global Market Outlook
- Demand-side Trends
- Supply-side Trends
- Technology Roadmap Analysis
- Analysis and Recommendations
- Analyst Perspective (What is happening? Why now? What should investors know?)
- Key Questions Answered
- How large is the market?
- What is the CAGR?
- What are key trends?
- Which region dominates?
- Who are the leaders?
- Market Overview
- Market Coverage / Taxonomy
- Market Definition / Scope / Limitations
- Research Methodology
- Chapter Orientation
- Analytical Lens and Working Hypotheses
- Market Structure, Signals, and Trend Drivers
- Benchmarking and Cross-market Comparability
- Market Sizing, Forecasting, and Opportunity Mapping
- Research Design and Evidence Framework
- Desk Research Programme (Secondary Evidence)
- Expert Input and Fieldwork (Primary Evidence)
- Tooling, Models, and Reference Databases
- Data Engineering and Model Build
- Quality Assurance and Audit Trail
- Market Background
- Market Dynamics (Drivers, Restraints, Opportunity, Trends)
- Scenario Forecast (Optimistic, Likely, Conservative)
- Impact Analysis
- AI Impact
- Sustainability Impact
- Regulatory Impact
- Technology Impact
- Consumer / Buyer Analysis
- Purchase Drivers
- Adoption Barriers
- Buyer Journey
- Opportunity Map Analysis
- Product Life Cycle Analysis
- Supply Chain Analysis
- Investment Feasibility Matrix
- Value Chain Analysis
- PESTLE and Porter's Analysis
- Regulatory Landscape
- Regional Parent Market Outlook
- Production and Consumption Statistics
- Import and Export Statistics
- Global Market Analysis and Forecast, 2021 to 2036
- Historical Market Size Value (USD Million) Analysis, 2021 to 2025
- Current and Future Market Size Value (USD Million) Projections, 2026 to 2036
- Y-o-Y Growth Trend Analysis
- Absolute $ Opportunity Analysis
- Global Market Pricing Analysis, 2021 to 2036
- Global Market Analysis and Forecast, By Product Type, 2021 to 2036
- Introduction / Key Findings
- Historical Market Size Value (USD Million) Analysis By Product Type, 2021 to 2025
- Current and Future Market Size Value (USD Million) Analysis and Forecast By Product Type, 2026 to 2036
- Single-strain products
- Multi-strain consortia
- Microbe + nutrient combos
- Others
- Y-o-Y Growth Trend Analysis By Product Type, 2021 to 2025
- Absolute $ Opportunity Analysis By Product Type, 2026 to 2036
- Global Market Analysis and Forecast, By Crop Type, 2021 to 2036
- Introduction / Key Findings
- Historical Market Size Value (USD Million) Analysis By Crop Type, 2021 to 2025
- Current and Future Market Size Value (USD Million) Analysis and Forecast By Crop Type, 2026 to 2036
- Cereals and grains
- Fruits and vegetables
- Oilseeds and pulses
- Turf and ornamentals
- Others
- Y-o-Y Growth Trend Analysis By Crop Type, 2021 to 2025
- Absolute $ Opportunity Analysis By Crop Type, 2026 to 2036
- Global Market Analysis and Forecast, By Application Method, 2021 to 2036
- Introduction / Key Findings
- Historical Market Size Value (USD Million) Analysis By Application Method, 2021 to 2025
- Current and Future Market Size Value (USD Million) Analysis and Forecast By Application Method, 2026 to 2036
- Soil application
- Foliar application
- Fertigation or drip
- Seed application
- Others
- Y-o-Y Growth Trend Analysis By Application Method, 2021 to 2025
- Absolute $ Opportunity Analysis By Application Method, 2026 to 2036
- Global Market Analysis and Forecast, By Farm Type, 2021 to 2036
- Introduction / Key Findings
- Historical Market Size Value (USD Million) Analysis By Farm Type, 2021 to 2025
- Current and Future Market Size Value (USD Million) Analysis and Forecast By Farm Type, 2026 to 2036
- Large commercial farms
- Mid-size farms
- Smallholders
- Greenhouses and nurseries
- Others
- Y-o-Y Growth Trend Analysis By Farm Type, 2021 to 2025
- Absolute $ Opportunity Analysis By Farm Type, 2026 to 2036
- Global Market Analysis and Forecast, By Sales Channel, 2021 to 2036
- Introduction / Key Findings
- Historical Market Size Value (USD Million) Analysis By Sales Channel, 2021 to 2025
- Current and Future Market Size Value (USD Million) Analysis and Forecast By Sales Channel, 2026 to 2036
- Agri-input distributors
- Cooperatives
- Agri-retail chains
- Online or direct-to-farm
- Others
- Y-o-Y Growth Trend Analysis By Sales Channel, 2021 to 2025
- Absolute $ Opportunity Analysis By Sales Channel, 2026 to 2036
- Global Market Analysis and Forecast, By Region, 2021 to 2036
- Introduction
- Historical Market Size Value (USD Million) Analysis By Region, 2021 to 2025
- Current Market Size Value (USD Million) Analysis and Forecast By Region, 2026 to 2036
- North America
- Latin America
- Western Europe
- Eastern Europe
- East Asia
- South Asia and Pacific
- Middle East and Africa
- Market Attractiveness Analysis By Region
- North America Market Analysis and Forecast, By Country, 2021 to 2036
- Historical Market Size Value (USD Million) Trend Analysis By Market Taxonomy, 2021 to 2025
- Market Size Value (USD Million) Forecast By Market Taxonomy, 2026 to 2036
- By Country
- United States
- Canada
- By Product Type
- By Crop Type
- By Application Method
- By Farm Type
- By Sales Channel
- By Country
- Market Attractiveness Analysis
- By Country
- By Product Type
- By Crop Type
- By Application Method
- By Farm Type
- By Sales Channel
- Key Takeaways
- Latin America Market Analysis and Forecast, By Country
- Historical Market Size Value (USD Million) Trend Analysis By Market Taxonomy, 2021 to 2025
- Market Size Value (USD Million) Forecast By Market Taxonomy, 2026 to 2036
- By Country
- Brazil
- Mexico
- Argentina
- Chile
- By Product Type
- By Crop Type
- By Application Method
- By Farm Type
- By Sales Channel
- By Country
- Market Attractiveness Analysis
- By Country
- By Product Type
- By Crop Type
- By Application Method
- By Farm Type
- By Sales Channel
- Key Takeaways
- Western Europe Market Analysis and Forecast, By Country
- Historical Market Size Value (USD Million) Trend Analysis By Market Taxonomy, 2021 to 2025
- Market Size Value (USD Million) Forecast By Market Taxonomy, 2026 to 2036
- By Country
- Germany
- France
- United Kingdom
- Italy
- Spain
- Benelux
- Nordics
- By Product Type
- By Crop Type
- By Application Method
- By Farm Type
- By Sales Channel
- By Country
- Market Attractiveness Analysis
- By Country
- By Product Type
- By Crop Type
- By Application Method
- By Farm Type
- By Sales Channel
- Key Takeaways
- Eastern Europe Market Analysis and Forecast, By Country
- Historical Market Size Value (USD Million) Trend Analysis By Market Taxonomy, 2021 to 2025
- Market Size Value (USD Million) Forecast By Market Taxonomy, 2026 to 2036
- By Country
- Poland
- Czech Republic
- Romania
- Hungary
- By Product Type
- By Crop Type
- By Application Method
- By Farm Type
- By Sales Channel
- By Country
- Market Attractiveness Analysis
- By Country
- By Product Type
- By Crop Type
- By Application Method
- By Farm Type
- By Sales Channel
- Key Takeaways
- East Asia Market Analysis and Forecast, By Country
- Historical Market Size Value (USD Million) Trend Analysis By Market Taxonomy, 2021 to 2025
- Market Size Value (USD Million) Forecast By Market Taxonomy, 2026 to 2036
- By Country
- China
- Japan
- South Korea
- By Product Type
- By Crop Type
- By Application Method
- By Farm Type
- By Sales Channel
- By Country
- Market Attractiveness Analysis
- By Country
- By Product Type
- By Crop Type
- By Application Method
- By Farm Type
- By Sales Channel
- Key Takeaways
- South Asia and Pacific Market Analysis and Forecast, By Country
- Historical Market Size Value (USD Million) Trend Analysis By Market Taxonomy, 2021 to 2025
- Market Size Value (USD Million) Forecast By Market Taxonomy, 2026 to 2036
- By Country
- India
- ASEAN
- Australia and New Zealand
- By Product Type
- By Crop Type
- By Application Method
- By Farm Type
- By Sales Channel
- By Country
- Market Attractiveness Analysis
- By Country
- By Product Type
- By Crop Type
- By Application Method
- By Farm Type
- By Sales Channel
- Key Takeaways
- Middle East and Africa Market Analysis and Forecast, By Country
- Historical Market Size Value (USD Million) Trend Analysis By Market Taxonomy, 2021 to 2025
- Market Size Value (USD Million) Forecast By Market Taxonomy, 2026 to 2036
- By Country
- GCC Countries
- South Africa
- Türkiye
- Israel
- By Product Type
- By Crop Type
- By Application Method
- By Farm Type
- By Sales Channel
- By Country
- Market Attractiveness Analysis
- By Country
- By Product Type
- By Crop Type
- By Application Method
- By Farm Type
- By Sales Channel
- Key Takeaways
- Key Countries Market Analysis
- United States
- Pricing Analysis
- Market Share Analysis, 2025
- By Product Type
- By Crop Type
- By Application Method
- By Farm Type
- By Sales Channel
- Canada
- Pricing Analysis
- Market Share Analysis, 2025
- By Product Type
- By Crop Type
- By Application Method
- By Farm Type
- By Sales Channel
- Mexico
- Pricing Analysis
- Market Share Analysis, 2025
- By Product Type
- By Crop Type
- By Application Method
- By Farm Type
- By Sales Channel
- Brazil
- Pricing Analysis
- Market Share Analysis, 2025
- By Product Type
- By Crop Type
- By Application Method
- By Farm Type
- By Sales Channel
- Chile
- Pricing Analysis
- Market Share Analysis, 2025
- By Product Type
- By Crop Type
- By Application Method
- By Farm Type
- By Sales Channel
- Germany
- Pricing Analysis
- Market Share Analysis, 2025
- By Product Type
- By Crop Type
- By Application Method
- By Farm Type
- By Sales Channel
- United Kingdom
- Pricing Analysis
- Market Share Analysis, 2025
- By Product Type
- By Crop Type
- By Application Method
- By Farm Type
- By Sales Channel
- Italy
- Pricing Analysis
- Market Share Analysis, 2025
- By Product Type
- By Crop Type
- By Application Method
- By Farm Type
- By Sales Channel
- Spain
- Pricing Analysis
- Market Share Analysis, 2025
- By Product Type
- By Crop Type
- By Application Method
- By Farm Type
- By Sales Channel
- France
- Pricing Analysis
- Market Share Analysis, 2025
- By Product Type
- By Crop Type
- By Application Method
- By Farm Type
- By Sales Channel
- India
- Pricing Analysis
- Market Share Analysis, 2025
- By Product Type
- By Crop Type
- By Application Method
- By Farm Type
- By Sales Channel
- ASEAN
- Pricing Analysis
- Market Share Analysis, 2025
- By Product Type
- By Crop Type
- By Application Method
- By Farm Type
- By Sales Channel
- Australia and New Zealand
- Pricing Analysis
- Market Share Analysis, 2025
- By Product Type
- By Crop Type
- By Application Method
- By Farm Type
- By Sales Channel
- China
- Pricing Analysis
- Market Share Analysis, 2025
- By Product Type
- By Crop Type
- By Application Method
- By Farm Type
- By Sales Channel
- Japan
- Pricing Analysis
- Market Share Analysis, 2025
- By Product Type
- By Crop Type
- By Application Method
- By Farm Type
- By Sales Channel
- South Korea
- Pricing Analysis
- Market Share Analysis, 2025
- By Product Type
- By Crop Type
- By Application Method
- By Farm Type
- By Sales Channel
- Poland
- Pricing Analysis
- Market Share Analysis, 2025
- By Product Type
- By Crop Type
- By Application Method
- By Farm Type
- By Sales Channel
- Hungary
- Pricing Analysis
- Market Share Analysis, 2025
- By Product Type
- By Crop Type
- By Application Method
- By Farm Type
- By Sales Channel
- Türkiye
- Pricing Analysis
- Market Share Analysis, 2025
- By Product Type
- By Crop Type
- By Application Method
- By Farm Type
- By Sales Channel
- South Africa
- Pricing Analysis
- Market Share Analysis, 2025
- By Product Type
- By Crop Type
- By Application Method
- By Farm Type
- By Sales Channel
- United States
- Market Structure Analysis
- Competition Dashboard
- Competition Benchmarking
- Market Share Analysis of Top Players
- By Regional
- By Product Type
- By Crop Type
- By Application Method
- By Farm Type
- By Sales Channel
- Emerging Startups
- Innovation Benchmarking
- Competition Analysis
- Competition Deep Dive
- Sound Agriculture
- Overview
- Product Portfolio
- Profitability by Market Segments
- Sales Footprint
- Strategy Overview
- Marketing Strategy
- Product Strategy
- Channel Strategy
- Rizobacter
- Lallemand Plant Care
- Indigo Ag
- Kula Bio
- BASF
- Bayer Crop Science
- Verdesian Life Sciences
- Sound Agriculture
- Case Studies
- Success Stories
- Recent Developments
- Competition Deep Dive
- Assumptions & Acronyms Used


