

- Market Size (2026)
- USD 219.0 Mn
- Forecast (2036)
- USD 686.4 Mn
- CAGR (2026 to 2036)
- 12.1%
How big is Root Microbiome Boosters Market in 2026?
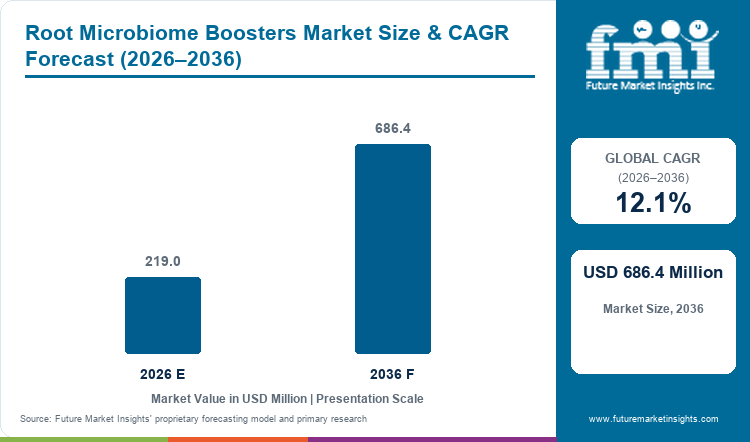
USD 219.0 million in 2026 and USD 686.4 million by 2036 at a 12.1% CAGR.
Sales of root microbiome boosters are projected to rise from USD 219.0 million in 2026 to USD 686.4 million by 2036 at a 12.1% CAGR. High fertilizer costs make nutrient efficiency worth testing without forcing changes to current planting or fertility programs. USDA Economic Research Service reported in March 2025 that fertilizer represented 33% to 44% of corn operating costs since 2020. Cost exposure gives microbial nitrogen and nutrient-access products a trial case if field evidence supports a measurable per-acre benefit.
Commercial qualification differs by country even though the products target the same root-zone biology. United States programs often need local field evidence because soil and management conditions alter microbial establishment, while Germany and the United Kingdom add formal product-classification steps before wider channel use. USDA Agricultural Research Service researchers from 15 United States locations documented in 2025 that microbial communities responded strongly to soil organic carbon and conservation management. These country differences raise field-validation costs in the United States and documentation costs in regulated European channels.
Key Takeaways
- Demand for root microbiome boosters is supported by farm programs that seek measurable nutrient efficiency without replacing current crop inputs.
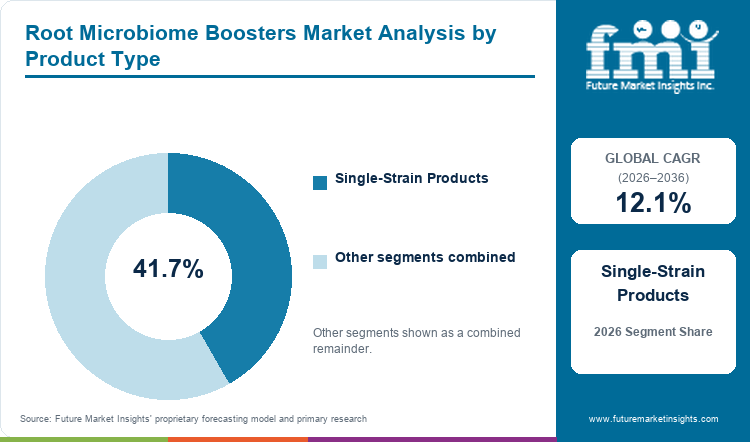
- In 2026, single-strain products are expected to lead product type with 41.7% share because simpler organism characterization reduces validation complexity.
- By crop type, cereals and grains are forecast to represent 41.6% in 2026 driven by broad-acre programs that support repeated per-acre validation.
- By application method, soil application is estimated to hold 48.7% in 2026 owing to direct root-zone placement through familiar field equipment.
- Variable soil response can extend commercial qualification because growers need local evidence before repeating a microbial input on wider acreage.
- Some of the key players in this market include Lallemand Plant Care, ENAI, Kula Bio, BASF, Bayer Crop Science, Verdesian Life Sciences, Novonesis, and Pivot Bio.
Analyst Perspective
"Root microbiome boosters earn repeat use only after viable organisms perform under the farm’s existing fertility and planting program. Commercial differentiation therefore depends on crop-specific field evidence plus handling instructions that preserve organism viability from storage through root-zone placement."
- Nandini Roy Choudhury, Principal Consultant, Future Market Insights
How is the root microbiome boosters market segmented?
The root microbiome boosters market is segmented by product type, crop type, application method, farm type, sales channel and region.
Market taxonomy covers product type, crop type, application method, farm type, sales channel and region for analysis. Product types include single-strain products, multi-strain consortia, microbe + nutrient combos and others. Crop types cover cereals and grains, fruits and vegetables, oilseeds and pulses, turf and ornamentals and others. Application methods include soil application, foliar application, fertigation - drip, seed application and others. Farm types include large commercial farms, mid-size farms, smallholders, greenhouses and nurseries and others. Sales channels include agri-input distributors, cooperatives, agri-retail chains, online - direct-to-farm and others.
Why do single-strain products lead demand within the product type category?
Single-strain products give formulators a direct line between organism identity and the function being tested during crop qualification. USDA Agricultural Research Service described 2025 work that develops microbial inoculants for soil health and nutrient cycling in degraded soils. The project directly fits agricultural microbials whose commercial claims depend on a defined organism performing under a specified field condition.
- By product type, single-strain products are estimated to hold 41.7% in 2026 owing to clearer organism characterization and manufacturing control.
- Commercial adoption depends on viable-count specifications and crop-specific directions that let agronomists compare one microbial action against the existing fertility program.
Why do cereals and grains lead demand within the crop type category?
Broad-acre cereal programs let growers compare treated strips with standard per-acre fertilizer practices on repeated field operations. Repeated planting and fertility routines also give biofertilizer programs a practical route into corn and wheat systems without redesigning planting equipment. Pivot Bio stated in March 2025 that its PROVEN G3 farmer demonstration program would span more than 300 locations before planned 2026 commercial availability.
- Cereals and grains are projected to hold 41.6% share in 2026 owing to broad acreage and repeatable crop operations.
- Growers can scale a validated microbial program by acre after replicated trials separate nutrient effects from normal soil-zone and weather differences.
Why does soil application lead demand within the application method category?
Soil application places living organisms near root exudates and nutrient gradients through irrigation or in-furrow equipment already present on many farms. Local soil testing equipment also supports trial design by documenting the conditions under which inoculant response is evaluated. USDA Agricultural Research Service reported 2025 field trials of arbuscular mycorrhizal fungi in sweet corn under two tillage systems.
- The soil application segment is likely to capture 48.7% share in 2026 attributable to direct root-zone placement and familiar delivery routes.
- Field teams still need handling rules that protect microbial viability from storage through mixing and placement under commercial operating conditions.
Why do large commercial farms lead demand within the farm type category?
Large commercial farms can divide acreage into treatment and control blocks and measure input changes against farm-level economics. Independent agricultural testing services become useful when growers need comparable data before widening use to more fields. Pivot Bio reported in February 2026 that its 2025 performance dataset covered 134 field trials with 129 growers nationwide.
- In 2026, large commercial farms are expected to lead farm type with 50.7% share because structured trials support meaningful repeat-volume potential.
- Farm scale increases the financial effect of small per-acre differences and raises the standard for compatibility evidence before seasonal expansion.
Why do agri-input distributors lead demand within the sales channel category?
Agri-input distributors manage local inventory and translate storage or placement instructions into farm practice during the selling season. Their role also overlaps with microbial seed treatment programs that need retailer support before planting begins. Pivot Bio announced in February 2025 that ALCIVIA would distribute PROVEN 40 within its four-state service network in the United States.
- Agri-input distributors are set to lead the sales channel with 41.8% share in 2026 due to local inventory and agronomic advice reducing application uncertainty.
- Trained staff preserve distributor influence by explaining compatibility and storage limits without overstating performance beyond local field evidence.
What are the drivers, restraints and opportunities in the Root Microbiome Boosters Market?
Input-cost pressure supports demand, variable field response extends qualification, and stable crop-matched formulations offer a practical route to repeat use.
- Driver: Farm operators test microbial inputs once nutrient costs make measurable efficiency improvements commercially relevant without forcing machinery changes.
- Restraint: Soil conditions and microbial viability can change field response enough to delay wider acreage commitments after an initial trial.
- Opportunity: Shelf-stable formats and precise placement guidance can reduce handling friction before distributors and growers scale seasonal purchasing.
Nutrient-Cost Pressure Supports Measurable Efficiency Claims
Farm operators pay closer attention to biological nutrient support as conventional inputs absorb a material share of annual production spending. USDA National Agricultural Statistics Service reported in July 2025 that fertilizer, lime and soil conditioners represented 7.1% of 2024 United States farm expenditures. Fertilizer spending gives crop micronutrient programs and microbial nutrient tools a trial opportunity whenever the expected per-acre effect can be measured against current fertility practice.
Field Variability Extends Qualification Before Repeat Use
Microbial products can fail a commercial repeat-order test even if the organism has a credible biological function under controlled conditions. Defra reported in July 2026 that field and laboratory trials on biostimulants were still in delivery to determine safe and effective use in England. The same qualification pressure increases demand for soil testing kits and replicated plots that separate product response from site variability before wider use.
Stable Formats Can Reduce Handling Friction
Formulation changes can reduce storage and placement burdens without changing the intended biological action delivered near the crop root. Pivot Bio launched dry planter-box treatments in November 2025 for microbial nitrogen delivery in corn and cotton. Comparable seed treatment materials can lower operational friction when labels preserve organism viability under routine dealer storage and planting conditions.
Which country CAGRs are profiled in the Root Microbiome Boosters Market?
| Country | CAGR |
|---|---|
| South Korea | 11.8% |
| Germany | 11.5% |
| United States | 11.2% |
| United Kingdom | 10.9% |
| Japan | 10.1% |
How do country-level CAGRs compare in the Root Microbiome Boosters Market?
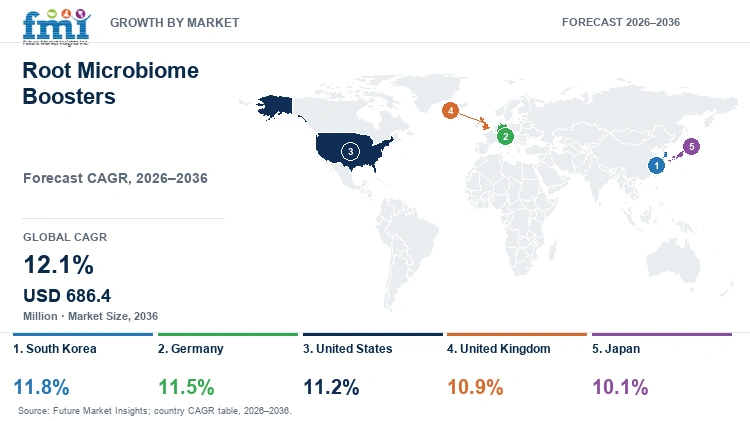
The country forecasts span 1.7 percentage points from South Korea at 11.8% to Japan at 10.1%. South Korea and Germany form the upper band while the United States and United Kingdom follow closely. Japan's lower rate reflects slower commercial conversion because advisory and purchasing routes differ for local distributors.
- South Korea's public network gives growers microbial guidance before trial decisions reach cooperatives.
- Germany's cereal channels support repeated field trials before distributors widen seasonal biological inventory commitments.
- United States corn programs route microbial seed treatments through retailers before spring planting decisions.
- United Kingdom cereal channels give agronomists influence over repeat orders for newer biological inputs.
- Japan's cooperative purchasing structure gives local advisers strong influence over microbial trial-to-routine-use decisions.
The full report provides country-level CAGR analysis for North America, Latin America, Western Europe, Eastern Europe, East Asia, South Asia and Pacific, and the Middle East and Africa.
Country-wise Analysis
- Large-acre corn and cereal programs in the United States give microbial inputs a clear route into replicated field testing beside current fertilizer practice. Demand for root microbiome boosters in the United States is forecast to rise at 11.2% CAGR over the forecast period, driven by nutrient-efficiency testing within broad-acre crop systems. USDA Economic Research Service reported in September 2025 that nitrogen represented 59% of average United States fertilizer consumption volume from 2006 to 2023. Regional dealer networks support agricultural secondary nutrients and biological trials, but variable soil response still raises the evidence threshold before national rollouts. Companies entering this market need state-ready labels and multi-location agronomic results before retailers commit wider seasonal inventory.
- United Kingdom crop advisers operate within a fertilizer policy transition that can change how newer biological inputs reach commercial channels. Distributor education carries weight because product claims influence the technical and legal route applied to each offer. Root microbiome booster demand in the United Kingdom is projected to record 10.9% CAGR during the assessment period, attributable to interest in nutrient-efficiency products that can fit existing crop programs. The four United Kingdom governments reported in September 2026 that their fertilizer reform consultation received 83 responses and proposed conformity assessment under a new UK FPR framework. Regulatory transition opens space for well-documented products but companies must align claims with eventual national requirements before expanding retailer inventory.
- German cereal and horticultural channels place formal product classification beside field performance during commercial evaluation. Adoption of root microbiome boosters in Germany is estimated to expand at 11.5% CAGR through 2036, supported by mature input channels and demand for evidence-based biological products. The Federal Office of Consumer Protection and Food Safety published a plant-strengthener list in September 2025 stating that formulations and intended labeling must be notified before first sale. The BVL process gives biostimulant products a defined regulatory route, but claim boundaries and permitted uses can still slow launch preparation. Market entry therefore depends on compliant classification plus German crop evidence that supports the exact label claim under commercial conditions.
- Japanese growers receive biological inputs through crop-specific advisory systems that place heavy weight on clear use instructions and evidence. Manufacturers also need formulations that remain practical for rice and horticultural operations with different handling routines. Demand for root microbiome boosters in Japan is predicted to advance at 10.1% CAGR through 2036, supported by interest in lower-input crop management and better nutrient efficiency. Japan's Ministry of Agriculture published national biostimulant labeling guidelines in May 2025 covering effect claims and evidence requirements for commercial use. The guidance gives responsible products a clearer communication route, but it also raises the documentation standard before channel partners recommend unfamiliar microbial inputs for routine farm programs.
- South Korean agricultural programs increasingly use public data systems to organize information on microorganisms used in fertilizers and crop protection. Root microbiome booster adoption in South Korea is anticipated to advance at 11.8% CAGR over the assessment period, driven by institutional support for biological inputs and documented crop effects. The Rural Development Administration launched a national plant-useful microorganism information and resource service in July 2025 covering fertilizer microbes and crop-growth effects. The service lowers technical search costs but limited farmer familiarity can delay purchasing until local demonstrations establish practical value. Companies need Korean agronomic evidence and dependable local support before trials become repeat use.
Who are the notable companies in the Root Microbiome Boosters Market?
Lallemand Plant Care, ENAI, Kula Bio, BASF, Bayer Crop Science, Verdesian Life Sciences, Novonesis and Pivot Bio are notable companies serving this market.
Specialist microbial platforms compete with crop-input groups that place biological products beside seed treatments or fertility programs. Entry barriers center on organism identity and viable formulation control plus field evidence supporting crop-specific commercial claims.
- Lallemand Plant Care, ENAI and Kula Bio participate through microbial inoculants or biological platforms centered on living organisms near the crop root.
- BASF and Bayer Crop Science participate through microbial seed treatments while Verdesian Life Sciences contributes root-associated inoculants to established agricultural channels.
- Novonesis and Pivot Bio serve biological crop programs through biosolutions development or microbial nitrogen products tied to agronomic validation.
Competitive Benchmarking: Root Microbiome Boosters Market
| Company | Root-Zone Microbial Specificity | Application-Format Breadth | Agronomic and Channel Support | Geographic Reach |
|---|---|---|---|---|
| Lallemand Plant Care | High | Medium | Medium | Global |
| ENAI | Medium | Medium | High | Global |
| Kula Bio | High | Medium | Medium | United States |
| BASF | Medium | Medium | High | Global |
| Bayer Crop Science | Medium | Medium | High | Global |
| Verdesian Life Sciences | Medium | Low | Medium | North America and selected international markets |
| Novonesis | Medium | Medium | High | Global |
| Pivot Bio | High | Medium | High | North America |
High root-zone specificity requires several documented microbial programs whose stated functions involve roots or rhizosphere activity. Medium identifies one verified root-associated microbial program within a broader biological crop product portfolio. Low identifies documented biological participation with limited direct public evidence of root-zone microbial activity. High application-format breadth requires three verified commercial delivery routes supported by current official evidence. Medium requires two documented commercial delivery routes while Low identifies one verified commercial format only. High agronomic support requires formal field validation plus distributor or agronomy support in multiple markets. Medium requires one documented support route while Low identifies limited documented field or channel support.
Key Developments in the Root Microbiome Boosters Market
- In November 2025, BASF announced French registration of Integral Pro for sunflower using Bacillus amyloliquefaciens MBI600 as a microbial seed treatment that colonizes seed and rootlets.
- In September 2025, Bayer Crop Science introduced Susteed as a biological seed treatment based on Bacillus amyloliquefaciens QST713 after its first registration in Belgium.
- In July 2025, Pivot Bio announced an Aurora Cooperative distribution partnership that expanded access to PROVEN 40 and PROVEN G3 for corn growers in Nebraska and northern Kansas.
Key Players in the Root Microbiome Boosters Market
Microbial Inoculant Platforms
- Lallemand Plant Care
- ENAI
- Kula Bio
Integrated Crop Biologicals and Nutrient-Efficiency Platforms
- BASF
- Bayer Crop Science
- Verdesian Life Sciences
Biosolutions and Microbial Nitrogen Platforms
- Novonesis
- Pivot Bio
Root Microbiome Boosters Market - Report Scope
| Coverage field | Report scope |
|---|---|
| Market breakdown | By product type, crop type, application method, farm type, sales channel and region. |
| Quantitative Units | USD million. |
| Market Definition | Commercial living-microbial products sold to influence the root or rhizosphere microbiome through stated crop-input routes. Conventional fertilizers, non-microbial biostimulants and chemical-only crop-protection products are excluded. |
| Regions Covered | North America, Latin America, Western Europe, Eastern Europe, East Asia, South Asia and Pacific, and Middle East and Africa. |
| Countries Covered | United States, United Kingdom, Germany, Japan, South Korea, and 20+ countries included in the full report. |
| Key Companies Profiled | Lallemand Plant Care, ENAI, Kula Bio, BASF, Bayer Crop Science, Verdesian Life Sciences, Novonesis and Pivot Bio. |
| Forecast Period | 2026 to 2036. |
| Approach | Primary and secondary research with market triangulation. |
Root Microbiome Boosters Market - Research Methodology
| Method | Approach |
|---|---|
| Primary Research | FMI analysts gathered input from manufacturers, service providers, technology developers, distributors, end users, procurement teams, and subject-matter experts. Interviews examined purchasing decisions, product or service evaluation, adoption barriers, approval requirements, pricing considerations, and expectations for technical or commercial support. Respondents were also asked what evidence is required before a trial, pilot, or initial order develops into regular purchasing. |
| Desk Research | Desk research covered government statistics, regulatory publications, trade data, industry associations, technical literature, standards, company filings, product information, and official corporate announcements. Sources were reviewed for relevance, publication date, geographic coverage, and consistency with the defined market scope. Claims relating to performance, applications, approvals, capacity, investment, and commercial activity were retained only when supported by credible public evidence. |
| Market Sizing and Forecasting | The market model combined the baseline value with historical performance, segment structure, pricing and volume indicators, adoption levels, company participation, and country-level demand conditions. Forecast assumptions considered economic activity, investment trends, regulatory developments, technology adoption, purchasing cycles, supply availability, and barriers to wider market use. Segment and regional estimates were reconciled before the final market total was calculated. |
| Data Validation | Estimates were checked against multiple independent indicators, including public data, company activity, trade patterns, industry developments, and findings from primary interviews. Validation also tested whether products, services, applications, and company revenues fell within the defined market boundaries. Adjacent categories, unsupported claims, overlapping revenues, and activities without direct market relevance were excluded to reduce double counting and maintain consistency across segments and countries. |
Root Microbiome Boosters Market by Segments
Root Microbiome Boosters Market segmented by Product Type:
- Single-Strain Products
- Multi-Strain Consortia
- Microbe + Nutrient Combos
- Others
Root Microbiome Boosters Market segmented by Crop Type:
- Cereals & Grains
- Fruits & Vegetables
- Oilseeds & Pulses
- Turf & Ornamentals
- Others
Root Microbiome Boosters Market segmented by Application Method:
- Soil Application
- Foliar Application
- Fertigation - Drip
- Seed Application
- Others
Root Microbiome Boosters Market segmented by Farm Type:
- Large Commercial Farms
- Mid-Size Farms
- Smallholders
- Greenhouses & Nurseries
- Others
Root Microbiome Boosters Market segmented by Sales Channel:
- Agri-Input Distributors
- Cooperatives
- Agri-Retail Chains
- Online - Direct-to-Farm
- Others
Root Microbiome Boosters Market by Region:
- North America
- United States
- Canada
- Latin America
- Brazil
- Mexico
- Argentina
- Chile
- Western Europe
- Germany
- France
- United Kingdom
- Italy
- Spain
- Benelux
- Nordics
- Eastern Europe
- Poland
- Czech Republic
- Romania
- Hungary
- East Asia
- China
- Japan
- South Korea
- South Asia and Pacific
- India
- ASEAN
- Australia and New Zealand
- Middle East and Africa
- GCC Countries
- South Africa
- Türkiye
- Israel
Research Sources and Bibliography
- USA Department of Agriculture, Economic Research Service. (2025, March 27). Fertilizer prices stable at onset of 2025 planting season, below highs of 2021 and 2022.
- USA Department of Agriculture, Agricultural Research Service. (2025). Research Project #441240: 2025 Annual Report.
- USA Department of Agriculture, Agricultural Research Service. (2025). Research Project #440718: 2025 Annual Report.
- Pivot Bio. (2025, March 17). Pivot Bio Unveils PROVEN G3, with Powerful New Modes of Action and Patent-Protected Gene-Editing Technology.
- USA Department of Agriculture, Agricultural Research Service. (2025). Research Project #441390: 2025 Annual Report.
- Pivot Bio. (2026, February 24). Pivot Bio Releases 2025 Field Performance Data Demonstrating Consistent Yield Gains and Synthetic Nitrogen Displacement While Lowering Fertilizer Costs.
- Pivot Bio. (2025, February 12). Pivot Bio Retail Network Continues to Grow Through ALCIVIA Partnership.
- USA Department of Agriculture, National Agricultural Statistics Service. (2025, July). USA Farm Production Expenditures, 2024.
- Department for Environment, Food & Rural Affairs. (2026, July 16). Agriculture water quality Environment Act target delivery plan.
- Pivot Bio. (2025, November 13). Pivot Bio Expands Weatherproof Nitrogen Portfolio with New Dry Planter Box Treatments for Corn and Cotton.
- USA Department of Agriculture, Economic Research Service. (2025, September 24). USA fertilizer consumption rebounds from 2021 drop.
- Department for Environment, Food & Rural Affairs; Scottish Government; Welsh Government; Northern Ireland Executive. (2026, September 9). Marketing fertilising products in the UK: regulatory reform.
- Federal Office of Consumer Protection and Food Safety. (2025, September 3). Liste der Pflanzenstärkungsmittel gemäß § 45 PflSchG.
- Ministry of Agriculture, Forestry and Fisheries of Japan. (2025, May 30). 「バイオスティミュラントの表示等に係るガイドライン」を策定しました.
- Rural Development Administration, Republic of Korea. (2025, July 2). 농약‧비료 미생물 정보 검색부터 분양까지 한 번에.
- BASF. (2025, November 20). BASF announces Integral Pro for Sunflowers is registered in France.
- Bayer Crop Science. (2025, September 29). Susteed brings together the best of biologicals and seed treatments.
- Pivot Bio. (2025, July 7). Pivot Bio Expands Retailer Network Through Partnership with Aurora Cooperative.
- BASF. (2026, May 11). BASF Agricultural Solutions successfully commissions new fermentation plant for crop protection products in Ludwigshafen.
- ENAI. (2026, August 25). Indigo Agriculture Launches ENAI, a Biological Crop Protection and Plant Performance Company.
- Rovensa Next. (2026, February 2). Rovensa Next strengthens global innovation capabilities with new pilot fermentation plant in Brazil.
- Rovensa Next. (2026, March 9). Otimais Duo, Rovensa Next’s high-performance synergistic inoculant for maximizing nutrient efficiency, is launched in Brazil.
- Pivot Bio. (2026, March 26). Pivot Bio Announces Strategic Partnership with Red Reef Partners to Accelerate Nitrogen Optimization on North American Farmland.
- Certis Biologicals. (2025, March 5). Certis Biologicals Announces the first EU Authorization of NemaClean.
- Federal Office of Consumer Protection and Food Safety. (2025, March 26). Registration reports: LALSTOP G46 WG (00B229-00/00).
- Indigo Agriculture. (2025, October 7). Indigo Ag Introduces biotrinsic Nemora FP.
- Kula Bio. (2026, February 2). Kula Bio Launches Soluble Powder (SP) Line of Its Innovative Nitrogen-Fixing Biological Products.
- Norwegian Food Safety Authority. (2025, July 7). Serenade Soil Activ.
- ANSES. (2026, June 29). PREVAIL VERDESIAN LIFE SCIENCES EUROPE LTD.
- Novonesis. (2026, June 11). Rovensa Next to distribute Novonesis’ biosolutions for Plant Health in the United States.
- Pivot Bio. (2025, August 21). Pivot Bio Partners with Soil and Water Outcomes Fund.
This bibliography is provided for reader reference and is not exhaustive. The full report contains the complete reference list and detailed citations.
This Report Answers
- How large is the root microbiome boosters market in 2026 and 2036?
- Which farm-economics pressures support microbial nutrient trials?
- Why do single-strain products account for 41.7% of demand?
- How do cereals and grains support scaled field validation?
- Why does soil application account for 48.7% of demand?
- How do country growth rates differ among the five covered countries?
- Which companies participate in root-zone microbial crop programs?
- Which formulation and channel choices reduce handling friction?
Frequently Asked Questions
How big is the Root Microbiome Boosters Market in 2026?
The root microbiome boosters market is valued at USD 219.0 million in 2026 and is projected to reach USD 686.4 million by 2036. Growth depends on field-proven microbial nutrient support that fits current fertilizer and crop-input programs during commercial use.
What is the CAGR of the Root Microbiome Boosters Market from 2026 to 2036?
The root microbiome boosters market is projected to grow at a CAGR of 12.1% between 2026 and 2036. Expansion depends on viable formulations and crop-specific field evidence that can support repeat use.
Which product type leads the Root Microbiome Boosters Market?
The single-strain products segment is expected to hold 41.7% of the root microbiome boosters market in 2026, driven by clearer organism characterization and simpler manufacturing control. Commercial teams can match one documented organism with one crop-use case during field qualification and distributor training.
How much value will the Root Microbiome Boosters Market add between 2026 and 2036?
The root microbiome boosters market is expected to add USD 467.4 million in value between 2026 and 2036. The increase depends on microbial products proving repeatable performance inside current fertilizer and crop-input programs.
Which companies are active in the Root Microbiome Boosters Market?
Key companies operating in the market include Lallemand Plant Care, ENAI, Kula Bio, BASF, Bayer Crop Science, Verdesian Life Sciences, Novonesis, and Pivot Bio. Their roles cover microbial inoculants and seed biologicals plus nutrient-efficiency products and root-zone nitrogen programs.
Preview the report firsthand - request a free sample
Get SampleGet the brochure for pricing and purchase details.
Get PDFTable of Content
- Key Takeaways
- Market Size and CAGR
- Top Growth Driver
- Fastest Growing Segment
- Leading Region
- Key Companies
- Emerging Opportunities
- Executive Summary
- Global Market Outlook
- Demand-side Trends
- Supply-side Trends
- Technology Roadmap Analysis
- Analysis and Recommendations
- Analyst Perspective (What is happening? Why now? What should investors know?)
- Key Questions Answered
- How large is the market?
- What is the CAGR?
- What are key trends?
- Which region dominates?
- Who are the leaders?
- Market Overview
- Market Coverage / Taxonomy
- Market Definition / Scope / Limitations
- Research Methodology
- Chapter Orientation
- Analytical Lens and Working Hypotheses
- Market Structure, Signals, and Trend Drivers
- Benchmarking and Cross-market Comparability
- Market Sizing, Forecasting, and Opportunity Mapping
- Research Design and Evidence Framework
- Desk Research Programme (Secondary Evidence)
- Expert Input and Fieldwork (Primary Evidence)
- Tooling, Models, and Reference Databases
- Data Engineering and Model Build
- Quality Assurance and Audit Trail
- Market Background
- Market Dynamics (Drivers, Restraints, Opportunity, Trends)
- Scenario Forecast (Optimistic, Likely, Conservative)
- Impact Analysis
- AI Impact
- Sustainability Impact
- Regulatory Impact
- Technology Impact
- Consumer / Buyer Analysis
- Purchase Drivers
- Adoption Barriers
- Buyer Journey
- Opportunity Map Analysis
- Product Life Cycle Analysis
- Supply Chain Analysis
- Investment Feasibility Matrix
- Value Chain Analysis
- PESTLE and Porter's Analysis
- Regulatory Landscape
- Regional Parent Market Outlook
- Production and Consumption Statistics
- Import and Export Statistics
- Global Market Analysis and Forecast, 2021 to 2036
- Historical Market Size Value (USD Million) Analysis, 2021 to 2025
- Current and Future Market Size Value (USD Million) Projections, 2026 to 2036
- Y-o-Y Growth Trend Analysis
- Absolute $ Opportunity Analysis
- Global Market Pricing Analysis, 2021 to 2036
- Global Market Analysis and Forecast, By Product Type, 2021 to 2036
- Introduction / Key Findings
- Historical Market Size Value (USD Million) Analysis By Product Type, 2021 to 2025
- Current and Future Market Size Value (USD Million) Analysis and Forecast By Product Type, 2026 to 2036
- Single-Strain Products
- Multi-Strain Consortia
- Microbe + Nutrient Combos
- Others
- Y-o-Y Growth Trend Analysis By Product Type, 2021 to 2025
- Absolute $ Opportunity Analysis By Product Type, 2026 to 2036
- Global Market Analysis and Forecast, By Crop Type, 2021 to 2036
- Introduction / Key Findings
- Historical Market Size Value (USD Million) Analysis By Crop Type, 2021 to 2025
- Current and Future Market Size Value (USD Million) Analysis and Forecast By Crop Type, 2026 to 2036
- Cereals & Grains
- Fruits & Vegetables
- Oilseeds & Pulses
- Turf & Ornamentals
- Others
- Y-o-Y Growth Trend Analysis By Crop Type, 2021 to 2025
- Absolute $ Opportunity Analysis By Crop Type, 2026 to 2036
- Global Market Analysis and Forecast, By Application Method, 2021 to 2036
- Introduction / Key Findings
- Historical Market Size Value (USD Million) Analysis By Application Method, 2021 to 2025
- Current and Future Market Size Value (USD Million) Analysis and Forecast By Application Method, 2026 to 2036
- Soil Application
- Foliar Application
- Fertigation - Drip
- Seed Application
- Others
- Y-o-Y Growth Trend Analysis By Application Method, 2021 to 2025
- Absolute $ Opportunity Analysis By Application Method, 2026 to 2036
- Global Market Analysis and Forecast, By Farm Type, 2021 to 2036
- Introduction / Key Findings
- Historical Market Size Value (USD Million) Analysis By Farm Type, 2021 to 2025
- Current and Future Market Size Value (USD Million) Analysis and Forecast By Farm Type, 2026 to 2036
- Large Commercial Farms
- Mid-Size Farms
- Smallholders
- Greenhouses & Nurseries
- Others
- Y-o-Y Growth Trend Analysis By Farm Type, 2021 to 2025
- Absolute $ Opportunity Analysis By Farm Type, 2026 to 2036
- Global Market Analysis and Forecast, By Sales Channel, 2021 to 2036
- Introduction / Key Findings
- Historical Market Size Value (USD Million) Analysis By Sales Channel, 2021 to 2025
- Current and Future Market Size Value (USD Million) Analysis and Forecast By Sales Channel, 2026 to 2036
- Agri-Input Distributors
- Cooperatives
- Agri-Retail Chains
- Online - Direct-to-Farm
- Others
- Y-o-Y Growth Trend Analysis By Sales Channel, 2021 to 2025
- Absolute $ Opportunity Analysis By Sales Channel, 2026 to 2036
- Global Market Analysis and Forecast, By Region, 2021 to 2036
- Introduction
- Historical Market Size Value (USD Million) Analysis By Region, 2021 to 2025
- Current Market Size Value (USD Million) Analysis and Forecast By Region, 2026 to 2036
- North America
- Latin America
- Western Europe
- Eastern Europe
- East Asia
- South Asia and Pacific
- Middle East and Africa
- Market Attractiveness Analysis By Region
- North America Market Analysis and Forecast, By Country, 2021 to 2036
- Historical Market Size Value (USD Million) Trend Analysis By Market Taxonomy, 2021 to 2025
- Market Size Value (USD Million) Forecast By Market Taxonomy, 2026 to 2036
- By Country
- United States
- Canada
- By Product Type
- By Crop Type
- By Application Method
- By Farm Type
- By Sales Channel
- By Country
- Market Attractiveness Analysis
- By Country
- By Product Type
- By Crop Type
- By Application Method
- By Farm Type
- By Sales Channel
- Key Takeaways
- Latin America Market Analysis and Forecast, By Country
- Historical Market Size Value (USD Million) Trend Analysis By Market Taxonomy, 2021 to 2025
- Market Size Value (USD Million) Forecast By Market Taxonomy, 2026 to 2036
- By Country
- Brazil
- Mexico
- Argentina
- Chile
- By Product Type
- By Crop Type
- By Application Method
- By Farm Type
- By Sales Channel
- By Country
- Market Attractiveness Analysis
- By Country
- By Product Type
- By Crop Type
- By Application Method
- By Farm Type
- By Sales Channel
- Key Takeaways
- Western Europe Market Analysis and Forecast, By Country
- Historical Market Size Value (USD Million) Trend Analysis By Market Taxonomy, 2021 to 2025
- Market Size Value (USD Million) Forecast By Market Taxonomy, 2026 to 2036
- By Country
- Germany
- France
- United Kingdom
- Italy
- Spain
- Benelux
- Nordics
- By Product Type
- By Crop Type
- By Application Method
- By Farm Type
- By Sales Channel
- By Country
- Market Attractiveness Analysis
- By Country
- By Product Type
- By Crop Type
- By Application Method
- By Farm Type
- By Sales Channel
- Key Takeaways
- Eastern Europe Market Analysis and Forecast, By Country
- Historical Market Size Value (USD Million) Trend Analysis By Market Taxonomy, 2021 to 2025
- Market Size Value (USD Million) Forecast By Market Taxonomy, 2026 to 2036
- By Country
- Poland
- Czech Republic
- Romania
- Hungary
- By Product Type
- By Crop Type
- By Application Method
- By Farm Type
- By Sales Channel
- By Country
- Market Attractiveness Analysis
- By Country
- By Product Type
- By Crop Type
- By Application Method
- By Farm Type
- By Sales Channel
- Key Takeaways
- East Asia Market Analysis and Forecast, By Country
- Historical Market Size Value (USD Million) Trend Analysis By Market Taxonomy, 2021 to 2025
- Market Size Value (USD Million) Forecast By Market Taxonomy, 2026 to 2036
- By Country
- China
- Japan
- South Korea
- By Product Type
- By Crop Type
- By Application Method
- By Farm Type
- By Sales Channel
- By Country
- Market Attractiveness Analysis
- By Country
- By Product Type
- By Crop Type
- By Application Method
- By Farm Type
- By Sales Channel
- Key Takeaways
- South Asia and Pacific Market Analysis and Forecast, By Country
- Historical Market Size Value (USD Million) Trend Analysis By Market Taxonomy, 2021 to 2025
- Market Size Value (USD Million) Forecast By Market Taxonomy, 2026 to 2036
- By Country
- India
- ASEAN
- Australia and New Zealand
- By Product Type
- By Crop Type
- By Application Method
- By Farm Type
- By Sales Channel
- By Country
- Market Attractiveness Analysis
- By Country
- By Product Type
- By Crop Type
- By Application Method
- By Farm Type
- By Sales Channel
- Key Takeaways
- Middle East and Africa Market Analysis and Forecast, By Country
- Historical Market Size Value (USD Million) Trend Analysis By Market Taxonomy, 2021 to 2025
- Market Size Value (USD Million) Forecast By Market Taxonomy, 2026 to 2036
- By Country
- GCC Countries
- South Africa
- Türkiye
- Israel
- By Product Type
- By Crop Type
- By Application Method
- By Farm Type
- By Sales Channel
- By Country
- Market Attractiveness Analysis
- By Country
- By Product Type
- By Crop Type
- By Application Method
- By Farm Type
- By Sales Channel
- Key Takeaways
- Key Countries Market Analysis
- United States
- Pricing Analysis
- Market Share Analysis, 2025
- By Product Type
- By Crop Type
- By Application Method
- By Farm Type
- By Sales Channel
- Canada
- Pricing Analysis
- Market Share Analysis, 2025
- By Product Type
- By Crop Type
- By Application Method
- By Farm Type
- By Sales Channel
- Mexico
- Pricing Analysis
- Market Share Analysis, 2025
- By Product Type
- By Crop Type
- By Application Method
- By Farm Type
- By Sales Channel
- Brazil
- Pricing Analysis
- Market Share Analysis, 2025
- By Product Type
- By Crop Type
- By Application Method
- By Farm Type
- By Sales Channel
- Chile
- Pricing Analysis
- Market Share Analysis, 2025
- By Product Type
- By Crop Type
- By Application Method
- By Farm Type
- By Sales Channel
- Germany
- Pricing Analysis
- Market Share Analysis, 2025
- By Product Type
- By Crop Type
- By Application Method
- By Farm Type
- By Sales Channel
- United Kingdom
- Pricing Analysis
- Market Share Analysis, 2025
- By Product Type
- By Crop Type
- By Application Method
- By Farm Type
- By Sales Channel
- Italy
- Pricing Analysis
- Market Share Analysis, 2025
- By Product Type
- By Crop Type
- By Application Method
- By Farm Type
- By Sales Channel
- Spain
- Pricing Analysis
- Market Share Analysis, 2025
- By Product Type
- By Crop Type
- By Application Method
- By Farm Type
- By Sales Channel
- France
- Pricing Analysis
- Market Share Analysis, 2025
- By Product Type
- By Crop Type
- By Application Method
- By Farm Type
- By Sales Channel
- India
- Pricing Analysis
- Market Share Analysis, 2025
- By Product Type
- By Crop Type
- By Application Method
- By Farm Type
- By Sales Channel
- ASEAN
- Pricing Analysis
- Market Share Analysis, 2025
- By Product Type
- By Crop Type
- By Application Method
- By Farm Type
- By Sales Channel
- Australia and New Zealand
- Pricing Analysis
- Market Share Analysis, 2025
- By Product Type
- By Crop Type
- By Application Method
- By Farm Type
- By Sales Channel
- China
- Pricing Analysis
- Market Share Analysis, 2025
- By Product Type
- By Crop Type
- By Application Method
- By Farm Type
- By Sales Channel
- Japan
- Pricing Analysis
- Market Share Analysis, 2025
- By Product Type
- By Crop Type
- By Application Method
- By Farm Type
- By Sales Channel
- South Korea
- Pricing Analysis
- Market Share Analysis, 2025
- By Product Type
- By Crop Type
- By Application Method
- By Farm Type
- By Sales Channel
- Poland
- Pricing Analysis
- Market Share Analysis, 2025
- By Product Type
- By Crop Type
- By Application Method
- By Farm Type
- By Sales Channel
- Hungary
- Pricing Analysis
- Market Share Analysis, 2025
- By Product Type
- By Crop Type
- By Application Method
- By Farm Type
- By Sales Channel
- Türkiye
- Pricing Analysis
- Market Share Analysis, 2025
- By Product Type
- By Crop Type
- By Application Method
- By Farm Type
- By Sales Channel
- South Africa
- Pricing Analysis
- Market Share Analysis, 2025
- By Product Type
- By Crop Type
- By Application Method
- By Farm Type
- By Sales Channel
- United States
- Market Structure Analysis
- Competition Dashboard
- Competition Benchmarking
- Market Share Analysis of Top Players
- By Regional
- By Product Type
- By Crop Type
- By Application Method
- By Farm Type
- By Sales Channel
- Emerging Startups
- Innovation Benchmarking
- Competition Analysis
- Competition Deep Dive
- Lallemand Plant Care
- Overview
- Product Portfolio
- Profitability by Market Segments
- Sales Footprint
- Strategy Overview
- Marketing Strategy
- Product Strategy
- Channel Strategy
- ENAI
- Kula Bio
- BASF
- Bayer Crop Science
- Verdesian Life Sciences
- Novonesis
- Pivot Bio
- Lallemand Plant Care
- Case Studies
- Success Stories
- Recent Developments
- Competition Deep Dive
- Assumptions & Acronyms Used


