Reports

- Global Locations -

Headquarters

Future Market Insights, Inc.

Christiana Corporate, 200
Continental Drive, Suite 401,
Newark, Delaware - 19713,
United States

T: +1-845-579-5705

Americas

Future Market Insights, Inc.

616 Corporate Way, Suite 2-9018,
Valley Cottage, NY 10989, United States

T: +1-347-918-3531

MEA

Future Market Insights

1602-6 Jumeirah Bay X2 Tower, Plot No: JLT-PH2-X2A,
Jumeirah Lakes Towers, Dubai,
United Arab Emirates

Europe

Future Market Insights

3rd Floor, 207 Regent Street,
W1B 3HH London
United Kingdom

T: + 44 (0) 20 8123 9659
D: +44 (0) 20 3287 4268

Asia Pacific

Future Market Insights

IndiaLand Global Tech Park, Unit UG-1, Behind Grand HighStreet, Phase 1, Hinjawadi, MH, Pune – 411057, India

Rosehip Extract Market Outlook from 2024 to 2034

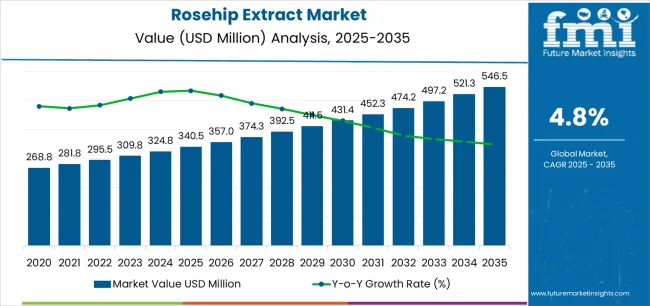
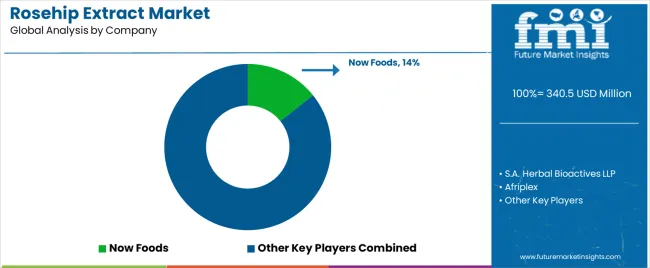
The global rosehip extract market is expected to rise from US$ 324.0 million in 2024 to US$ 547.0 million by 2034. By 2034, the market is projected to surge at a 5.1% CAGR.

Attributes Key Insights
Estimated Global Rosehip Extract Market Size (2024E) US$ 324.0 million
Projected Rosehip Extract Market Value (2034F) US$ 547.0 million
Value-based CAGR (2024 to 2034) 5.1%

The market for rosehip extracts is primarily driven by the high concentration of bioactive components present in rosehips, especially natural antioxidants like vitamin C, polyphenols, and carotenoids. Due to its potential skincare benefits, rosehip botanical extracts are widely used in cosmetic and personal care products.

Consumers worldwide are redefining what it means to stay healthy, and this shift is boosting the demand for health products. Increasing awareness and interest in natural remedies for health issues such as osteoarthritis and post-surgical pain is contributing to the expansion of the rosehip extract market.

Rosehip extract is finding applications beyond supplements and skincare, with its incorporation into several food and beverage products. This includes herbal teas, juices, and functional food items driven by consumer interest in incorporating health-promoting ingredients into their diets.

The rise of e-commerce platforms is facilitating easy access to rosehip extract products for consumers. Online sales channels allow companies to reach a broad customer base and showcase several rosehip extract-based products.

Don't pay for what you don't need

Customize your report by selecting specific countries or regions and save 30%!

2019 to 2023 Global Rosehip Extract Market Growth Outlook Vs. 2024 to 2034

The global rosehip extract sales grew at a CAGR of 4.3% from 2019 to 2023. The growth of rosehip extracts from 2019 to 2023 can be attributed to a convergence of factors:

  • Increased global health awareness and the emphasis on immunity during the COVID-19 pandemic were game changers, popularizing immune supplements such as rosehips.
  • The increasing demand for rose hips in traditional medicines, recognized for their historical use in treating kidney stones, gastroenteric issues, hypertension, and respiratory ailments, fuels significant growth in the herbal extract market.
  • Scientific research backing rosehips’ health benefits and expanding global recognition, particularly in countries across Europe post-pandemic, all contributed to the remarkable growth of rosehip extract.
  • There has been a discernible trend in consumer preferences over time toward natural and functional ingredients in the food, beverage, and wellness sectors.
  • During the historical period, rosehip extracts became increasingly popular as a natural and functional component due to their high level of vitamins, antioxidants, and vital fatty acids.

By 2034, the market for rosehip extracts is expected to rise at a 5.1% CAGR.

  • Rosehip extract's market expansion is aided by its rising demand as a desired ingredient in a range of skincare and cosmetic products due to its potential advantages for skin health.
  • Rosehip extracts are widely used in dietary supplements.
  • Rosehip extracts are expanding into other products, such as herbal teas, juices, cosmetic products, and functional foods.

Key Rosehip Extract Market Trends

  • The booming growth of the dietary supplement market with natural extract as a key ingredient is set to augment the growth of the rosehip extract market.
  • Growing awareness of the health benefits associated with rosehip extracts, such as high vitamin C content and potential antioxidant properties, contributes to their popularity in wellness products.
  • Rising awareness of the medicinal benefits of rosehip-based products is expected to propel industry growth.
  • Rosehip extract is gaining traction in the skincare industry due to its several skin benefits, mainly in anti-aging formulations.
  • Customers increasingly prefer organic and non-GMO products, and this trend extends to rosehip extracts, with consumers looking for certifications that validate these attributes.
Nandini Roy Choudhury

Principal Consultant

Talk to Analyst

Find your sweet spots for generating winning opportunities in this market.

Restraining Factors in the Rosehip Extract Market

  • Seasonal variations in rosehip availability are set to impact the supply chain and cause production variability.
  • The rosehip extract market's price volatility is expected to be attributed to several factors, including meteorological circumstances, geopolitical developments, and worldwide economic patterns.
  • Stimulating consistent quality in rosehip extract products is difficult as processing techniques and sources differ. Failure to maintain quality control is set to impede market expansion.

Comparative View of Adjacent Rosehip Extract Markets

A comprehensive analysis of growth and challenges has been tabulated below. The rosehip extract market is compared with two industries that have the potential to compete rigorously: the green tea extract market and the moringa extract market. The growth rates and key market trends are mentioned in the table below. Among the mentioned markets, the moringa extract market is poised to rise more rapidly during the forecast period.

Rosehip Extract Market:

Attributes Rosehip Extract Market
CAGR (2024 to 2034) 5.1%
Rosehip Extract Market Opportunities Product innovation is being driven by ongoing studies on rosehip extracts’ possible health advantages. In order to satisfy the wide range of consumer demands, manufacturers are creating novel rosehip extract formulations and uses, which is propelling the market's expansion.
Key Trends Customers are becoming aware of the ethical and environmental implications of the goods they buy. Companies in the rosehip extract industry are putting more emphasis on ethical and sustainable sourcing methods to gain traction in the market.

Green Tea Extract Market:

Attributes Green Tea Extract Market
CAGR (2024 to 2034) 7.0%
Growth Factor Growing demand for natural and organic supplements is pushing the green tea extract market growth.
Opportunity The high demand for functional foods and dietary supplements is providing significant opportunities for green tea extract manufacturers to develop & market products targeting specific health benefits.
Key Trends Consumers are increasingly seeking natural and plant-based ingredients in their food, beverages, and supplements. Green tea extracts, known for their antioxidant properties, align with this trend.

Moringa Extract Market:

Attributes Moringa Extract Market
CAGR (2024 to 2034) 14.9%
Growth Factor Growing demand for products with nutritional benefits is driving growth in the moringa extract market
Opportunity The rising demand for ready-to-drink refreshing and natural beverages is expected to boost sales of moringa extracts.
Key Trends Increasing demand for organic and natural ingredients due to a shift toward healthier and more sustainable options is expected to bolster sales.

Get the data you need at a Fraction of the cost

Personalize your report by choosing insights you need
and save 40%!

Country-wise Insights

The table below shows the estimated growth rates of the top five countries. The United States, China, and India are set to record high CAGRs of 4.5%, 5.6%, and 6.4%, respectively, through 2034.

Countries Projected CAGR (2024 to 2034)
United States 4.5%
United Kingdom 3.4%
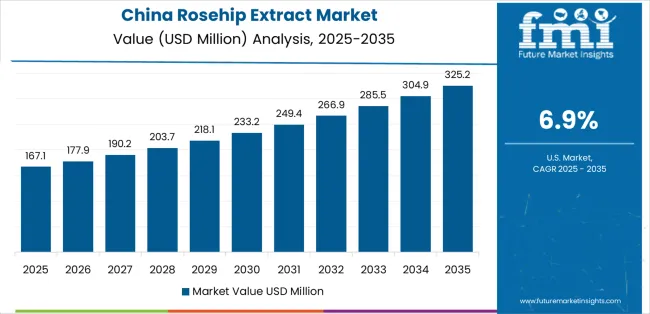
China 5.6%
India 6.4%
Japan 4.1%

The table below explains the rosehip extract market size of the top five countries for 2034. Among them, the United States is anticipated to remain at the forefront by reaching a valuation of US$ 103.9 million. The United Kingdom is expected to reach around US$ 54.7 million by 2034, less than China's US$ 98.4 million.

Countries Market Size (2034)
United States US$ 103.9 million
United Kingdom US$ 54.7 million
China US$ 98.4 million
India US$ 49.2 million
Japan US$ 38.2 million

Consumer Awareness Boosts Rosehip Extract Demand in the United States

The United States rosehip extract industry is poised to exhibit a CAGR of 4.5% during the assessment period. By 2034, the United States market is expected to reach US$ 103.9 million. Key factors supporting the market growth are:

  • Effective marketing and educational efforts are expected to propel rosehip adoption among health-conscious consumers, bolstering their role as a valuable addition to the United States wellness landscape.
  • Manufactures are focusing on marketing campaigns to explain the health advantages of rosehip extract and set themselves apart from competitors in the market.

Growing Awareness of Traditional Ingredients Propelling Demand in China

Rosehip extract demand in China is anticipated to rise at a steady CAGR of 5.6% during the forecast period. This is attributable to a combination of factors, including:

  • The cultural heritage of using plant-based ingredients for health purposes contributes to the acceptance and adoption of rosehip extracts in China.
  • Growth of the rosehip extract market in China is primarily ascribed to consumers becoming more conscious of their skin and aware of the product's potential to prevent skin-related problems.

Growing Demand for Natural Cosmetic Products to Surge Sales in Japan

Japan's rosehip extract market is expected to reach a valuation of around US$ 38.2 million by 2034. Top factors supporting the market’s expansion in the country include:

  • Growing consumer demand for natural and functional components in skincare is influencing Japan's rosehip market.
  • Several manufactures are implementing green technology to take sustainable actions such as reduce carbon emissions and adopt sustainable packaging to gain traction in the market. This is expected to increase the market growth in Japan.

Booming Cosmetic Industry in the United Kingdom Upscaling the Market

The demand for rosehip extracts is increasing in the United Kingdom, with a projected CAGR of 3.4% through 2034. Emerging patterns in the United Kingdom market are as follows:

  • The cosmetic industry in the United Kingdom has seen substantial use of rosehip extracts. Its possible advantages for skin health, including hydration and anti-aging qualities, are frequently cited as the reason for its inclusion in cosmetic products.
  • In the United Kingdom, rosehip extract is frequently utilized to create dietary supplements.
  • As a natural source of vitamins, antioxidants, and other bioactive substances, rosehip extract fits into the expanding trend of nutritional supplements.

Technological Innovations in India Paving the Road for the Market’s Success

The rosehip extract market is projected to increase in India at a CAGR of 6.4% through 2034. The factors driving the market’s growth are as follows:

  • In India, rosehip extract-based products are accessible to customers due to their availability in retail channels such as pharmacies, health food stores, and internet retailers.

Category-wise Insights

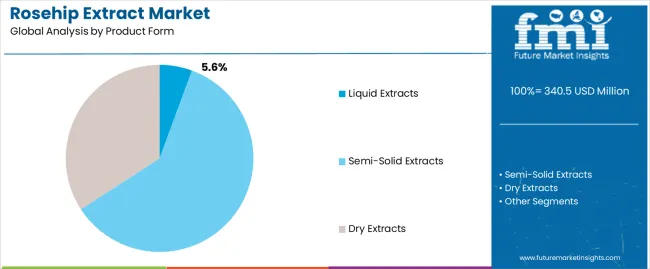
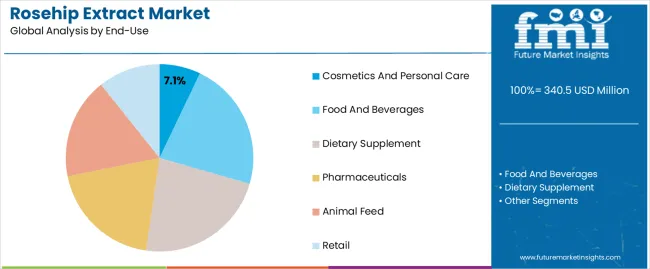
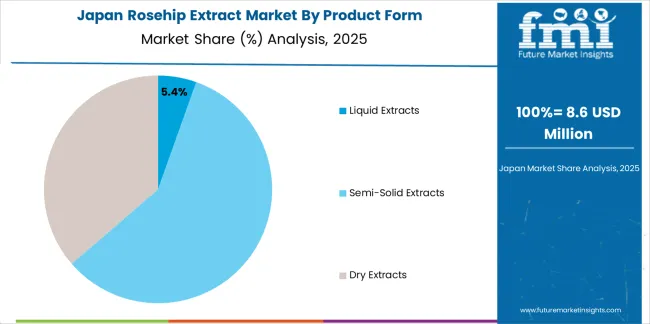
The section below shows the liquid extract segment dominating by product form. It is predicted to hold a market share of 5.6% in 2024. Based on end-use, the cosmetics and personal care segment is anticipated to generate a dominant share through 2024. It is set to hold a share of 7.1% in 2024.

Segment Market Share (2024)
Liquid Extract (Product Form) 5.6%
Cosmetics and Personal Care (End-use) 7.1%

Liquid Extract Segment Tops in Terms of Product Form Category

Based on product form, demand for liquid rosehip extracts is expected to remain high during the evaluation period.

  • Liquid rosehip extracts are convenient for immediate use and easy integration into several formulations.
  • Liquid-based rosehip extracts, particularly in the oil form, are gaining significant popularity in multiple industries due to their versatile applications and potent health & skincare benefits.
  • Due to its rich hydration traits, rosehip oil is widely used in the personal care and cosmetic industries.
  • As the awareness of rosehip's health and wellness benefits continues to rise, the liquid extract is expected to maintain its popularity as a sought-after ingredient in diverse products.

Adoption of Rosehip Extracts in Cosmetics and Personal Care to Surge by 2034

Based on end-use, the cosmetics and personal care segment is expected to hold a market share of 7.1% in 2024.

  • Consumers are increasingly gravitating toward natural and botanical-based products, further driving the demand for cosmetics enriched with rosehip extracts.
  • The rising importance of skin wellness and natural beauty solutions is driving the popularity of rosehip extract-infused cosmetics.
  • Users are actively looking for products that offer skin health and aesthetic benefits.
  • Rosehip extract is renowned for its anti-aging properties, helping reduce fine lines, improve skin elasticity, and promote a youthful complexion.
  • As customers prioritize anti-aging solutions, cosmetics featuring rosehip extracts are set to witness heightened demand.

Competitive Landscape

Leading rosehip extract manufacturers are continuously refining the quality of their products to meet evolving consumer expectations and demands. They are employing multifaceted strategies such as mergers, acquisitions, partnerships, distribution agreements, collaborations, advertisements, and celebrity endorsements to fortify their position in the market.

By leveraging these tactics, they aim to enhance brand visibility and establish credibility & trust among consumers. These are helping in ultimately gaining a competitive advantage in the increasingly dynamic landscape of rosehip supplements.

For instance,

  • In 2022, Kulfi Beauty introduced ‘Main Match,’ its first-ever concealer. The concealer, which uses South Asian-inspired ingredients such as alma fruit, rosehip extracts, and saffron flower extracts, comes in 12 shades called Kulfi flavor.
  • In 2023, Lenoir Skin Care™ introduced Rose Facial Cleanser, a science-backed formula to enhance natural beauty.

Key Companies Profiled

  • S.A. Herbal Bioactives LLP
  • Afriplex
  • Spectrum Chemical
  • Avi Naturals
  • ParkAcre Enterprises Ltd.
  • Herbal Bioactives LLP
  • FENGCHEN GROUP CO., LTD.
  • Biossance
  • Now Foods
  • Xi'an Green Spring Technology Co., Ltd
  • Leven Rose
  • HERBO NUTRA EXTRACT PRIVATE

Rosehip Extract Market Segmentation by Category

By Product Form:

  • Liquid Extracts
  • Semi-solid Extracts
  • Dry Extracts

By End-use:

  • Food and Beverages
  • Dietary Supplement
  • Cosmetics and Personal Care
  • Pharmaceuticals
  • Animal Feed
  • Retail

By Distribution Channel:

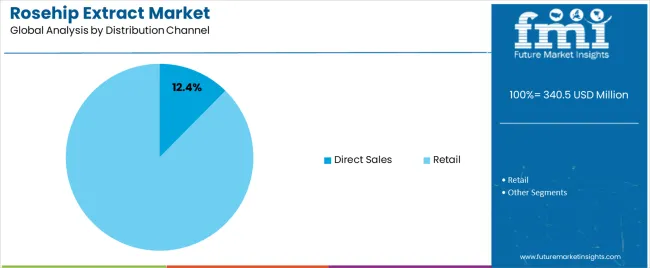
  • Direct Sales
  • Retail
    • Hypermarkets/ Supermarkets
    • Convenience Stores
    • Pharmacy and Health Stores
    • Specialty Stores
    • Independent Small Groceries
    • Online Retailing
    • Others

By Region:

  • North America
  • Latin America
  • Europe
  • East Asia
  • South Asia
  • Oceania
  • Middle East and Africa

Frequently Asked Questions

How big is the rosehip extract market?

The market is set to reach US$ 324.0 million in 2024.

What is the forecast for the rosehip extract market?

Demand for rosehip extracts is slated to expand at a 5.1% CAGR by 2034.

What is the outlook for the rosehip extract market?

The market is set to reach US$ 547.0 million in 2034.

Who are the key players in the rosehip extract market?

S.A. Herbal Bioactives LLP, Afriplex, and Spectrum Chemical are the key players.

Which product form would lead the rosehip extract market?

The liquid extract segment is estimated to hold a significant market share in 2024.

Table of Content

1. Executive Summary

    1.1. Global Market Outlook

    1.2. Demand Side Trends

    1.3. Supply Side Trends

    1.4. Technology Roadmap

    1.5. Analysis and Recommendations

2. Market Overview

    2.1. Market Coverage / Taxonomy

    2.2. Market Definition

3. Market Dynamics

    3.1. Drivers

        3.1.1. Supply Side Drivers

        3.1.2. Demand Side drivers

        3.1.3. Economic Side Drivers

    3.2. Restraints

    3.3. Opportunity

    3.4. Market Trends by Region

    3.5. Forecast Factors - Relevance & Impact

    3.6. Key Regulations and Policies

4. Value Chain Analysis

    4.1. Operating margins at each node of the supply chain

    4.2. List of Active Market Participants

5. Global Market - Pricing Analysis

    5.1. Price Point Assessment by Region

        5.1.1. Manufacturer-Level Pricing

        5.1.2. Distributor Level Pricing

        5.1.3. Retail Level Pricing

    5.2. Price Point Assessment by Product Form

    5.3. Price Forecast till 2034

6. Global Market Size (in Value (US$ million) and Volume (MT) Analysis 2019 to 2023 and Forecast, 2024 to 2034

    6.1. Historical Market Size (in Value (US$ million) and Volume (MT) Analysis, 2019 to 2023

    6.2. Current and Future Market Size (in Value (US$ million) and Volume (MT) Analysis, 2024 to 2034

        6.2.1. Y-o-Y Growth Trend Analysis

        6.2.2. Absolute $ Opportunity Analysis

7. Global Market Analysis 2019 to 2023 and Forecast 2024 to 2034, by Product Form

    7.1. Introduction / Key Findings

    7.2. Historical Market Size (in Value (US$ million) and Volume (MT) Analysis by Product Form, 2019 to 2023

    7.3. Current and Future Market Size (in Value (US$ million) and Volume (MT) Analysis and Forecast by Product Form, 2024 to 2034

        7.3.1. Liquid Extracts

        7.3.2. Semi-solid Extracts

        7.3.3. Dry Extracts

    7.4. Market Attractiveness Analysis by Product Form

8. Global Market Analysis 2019 to 2023 and Forecast 2024 to 2034, by End-use

    8.1. Introduction / Key Findings

    8.2. Historical Market Size (in Value (US$ million) and Volume (MT) Analysis by End-use, 2019 to 2023

    8.3. Current and Future Market Size (in Value (US$ million) and Volume (MT) Analysis and Forecast by End-use, 2024 to 2034

        8.3.1. Cosmetics and Personal Care

        8.3.2. Dietary Supplement

        8.3.3. Food & Beverages

        8.3.4. Pharmaceuticals

        8.3.5. Animal Feed

        8.3.6. Retail

    8.4. Market Attractiveness Analysis by End-use

9. Global Market Analysis 2019 to 2023 and Forecast 2024 to 2034, by Distribution Channel

    9.1. Introduction / Key Findings

    9.2. Historical Market Size (in Value (US$ million) and Volume (MT) Analysis by Distribution Channel, 2019 to 2023

    9.3. Current and Future Market Size (in Value (US$ million) and Volume (MT) Analysis and Forecast by Distribution Channel, 2024 to 2034

        9.3.1. Direct Sales

        9.3.2. Indirect Sales

            9.3.2.1. Hypermarkets/ Supermarkets

            9.3.2.2. Convenience Stores

            9.3.2.3. Pharmacy and Health Stores

            9.3.2.4. Specialty Stores

            9.3.2.5. Independent Small Groceries

            9.3.2.6. Online Retailing

            9.3.2.7. Others

    9.4. Market Attractiveness Analysis by Distribution Channel

10. Global Market Analysis 2019 to 2023 and Forecast 2024 to 2034, by Region

    10.1. Introduction

    10.2. Historical Market Size (in Value (US$ million) and Volume (MT) Analysis by Region, 2019 to 2023

    10.3. Current Market Size (in Value (US$ million) and Volume (MT) Analysis and Forecast by Region, 2024 to 2034

        10.3.1. North America

        10.3.2. Latin America

        10.3.3. Europe

        10.3.4. East Asia

        10.3.5. South Asia

        10.3.6. Oceania

        10.3.7. Middle East and Africa

    10.4. Market Attractiveness Analysis by Region

11. North America Market Analysis 2019 to 2023 and Forecast 2024 to 2034

    11.1. Introduction

    11.2. Historical Market Size (US$ million) and Volume Trend Analysis by Market Taxonomy, 2019 to 2023

    11.3. Market Size (US$ million) and Volume Forecast by Market Taxonomy, 2024 to 2034

        11.3.1. by Country

            11.3.1.1. United States

            11.3.1.2. Canada

        11.3.2. by Product Form

        11.3.3. by End-use

        11.3.4. by Distribution Channel

    11.4. Market Attractiveness Analysis

        11.4.1. by Country

        11.4.2. by Product Form

        11.4.3. by End-use

        11.4.4. by Distribution Channel

    11.5. Key Takeaways

12. Latin America Market Analysis 2019 to 2023 and Forecast 2024 to 2034

    12.1. Introduction

    12.2. Historical Market Size (US$ million) and Volume Trend Analysis by Market Taxonomy, 2019 to 2023

    12.3. Market Size (US$ million) and Volume Forecast by Market Taxonomy, 2024 to 2034

        12.3.1. by Country

            12.3.1.1. Brazil

            12.3.1.2. Mexico

            12.3.1.3. Argentina

            12.3.1.4. Rest of Latin America

        12.3.2. by Product Form

        12.3.3. by End-use

        12.3.4. by Distribution Channel

    12.4. Market Attractiveness Analysis

        12.4.1. by Country

        12.4.2. by Product Form

        12.4.3. by End-use

        12.4.4. by Distribution Channel

    12.5. Key Takeaways

13. Europe Market Wheat Germ Analysis 2019 to 2023 and Forecast 2024 to 2034

    13.1. Introduction

    13.2. Historical Market Size (US$ million) and Volume Trend Analysis by Market Taxonomy, 2019 to 2023

    13.3. Market Size (US$ million) and Volume Forecast by Market Taxonomy, 2024 to 2034

        13.3.1. by Country

            13.3.1.1. Germany

            13.3.1.2. United kingdom

            13.3.1.3. France

            13.3.1.4. Italy

            13.3.1.5. Spain

            13.3.1.6. BENELUX

            13.3.1.7. Nordic

            13.3.1.8. Russia

            13.3.1.9. Poland

            13.3.1.10. Rest of Europe

        13.3.2. by Product Form

        13.3.3. by End-use

        13.3.4. by Distribution Channel

    13.4. Market Attractiveness Analysis

        13.4.1. by Country

        13.4.2. by Product Form

        13.4.3. by End-use

        13.4.4. by Distribution Channel

    13.5. Key Takeaways

14. East Asia Market Analysis 2019 to 2023 and Forecast 2024 to 2034

    14.1. Introduction

    14.2. Historical Market Size (US$ million) and Volume Trend Analysis by Market Taxonomy, 2019 to 2023

    14.3. Market Size (US$ million) and Volume Forecast by Market Taxonomy, 2024 to 2034

        14.3.1. by Country

            14.3.1.1. China

            14.3.1.2. Japan

            14.3.1.3. South Korea

        14.3.2. by Product Form

        14.3.3. by End-use

        14.3.4. by Distribution Channel

    14.4. Market Attractiveness Analysis

        14.4.1. by Country

        14.4.2. by Product Form

        14.4.3. by End-use

        14.4.4. by Distribution Channel

    14.5. Key Takeaways

15. South Asia Market Analysis 2019 to 2023 and Forecast 2024 to 2034

    15.1. Introduction

    15.2. Historical Market Size (US$ million) and Volume Trend Analysis by Market Taxonomy, 2019 to 2023

    15.3. Market Size (US$ million) and Volume Forecast by Market Taxonomy, 2024 to 2034

        15.3.1. by Country

            15.3.1.1. India

            15.3.1.2. Thailand

            15.3.1.3. Malaysia

            15.3.1.4. Indonesia

            15.3.1.5. Singapore

            15.3.1.6. Vietnam

            15.3.1.7. Philippines

            15.3.1.8. Rest of South Asia

        15.3.2. by Product Form

        15.3.3. by End-use

        15.3.4. by Distribution Channel

    15.4. Market Attractiveness Analysis

        15.4.1. by Country

        15.4.2. by Product Form

        15.4.3. by End-use

        15.4.4. by Distribution Channel

    15.5. Key Takeaways

16. Oceania Market Analysis 2019 to 2023 and Forecast 2024 to 2034

    16.1. Introduction

    16.2. Historical Market Size (US$ million) and Volume Trend Analysis by Market Taxonomy, 2019 to 2023

    16.3. Market Size (US$ million) and Volume Forecast by Market Taxonomy, 2024 to 2034

        16.3.1. by Country

            16.3.1.1. Australia

            16.3.1.2. New Zealand

        16.3.2. by Product Form

        16.3.3. by End-use

        16.3.4. by Distribution Channel

    16.4. Market Attractiveness Analysis

        16.4.1. by Country

        16.4.2. by Product Form

        16.4.3. by End-use

        16.4.4. by Distribution Channel

    16.5. Key Takeaways

17. Middle East and Africa Market Analysis 2019 to 2023 and Forecast 2024 to 2034

    17.1. Introduction

    17.2. Historical Market Size (US$ million) and Volume Trend Analysis by Market Taxonomy, 2019 to 2023

    17.3. Market Size (US$ million) and Volume Forecast by Market Taxonomy, 2024 to 2034

        17.3.1. by Country

            17.3.1.1. GCC Countries

            17.3.1.2. Turkiye

            17.3.1.3. Egypt

            17.3.1.4. South Africa

            17.3.1.5. Rest of Middle East and Africa

        17.3.2. by Product Form

        17.3.3. by End-use

        17.3.4. by Distribution Channel

    17.4. Market Attractiveness Analysis

        17.4.1. by Country

        17.4.2. by Product Form

        17.4.3. by End-use

        17.4.4. by Distribution Channel

    17.5. Key Takeaways

18. Country-level Market Analysis, 2024

    18.1. United States Market Analysis

        18.1.1. by Product Form

        18.1.2. by End-use

        18.1.3. by Distribution Channel

    18.2. Canada Market Analysis

        18.2.1. by Product Form

        18.2.2. by End-use

        18.2.3. by Distribution Channel

    18.3. Brazil Market Analysis

        18.3.1. by Product Form

        18.3.2. by End-use

        18.3.3. by Distribution Channel

    18.4. Mexico Market Analysis

        18.4.1. by Product Form

        18.4.2. by End-use

        18.4.3. by Distribution Channel

    18.5. Argentina Market Analysis

        18.5.1. by Product Form

        18.5.2. by End-use

        18.5.3. by Distribution Channel

    18.6. Germany Market Analysis

        18.6.1. by Product Form

        18.6.2. by End-use

        18.6.3. by Distribution Channel

    18.7. United Kingdom Market Analysis

        18.7.1. by Product Form

        18.7.2. by End-use

        18.7.3. by Distribution Channel

    18.8. France Market Analysis

        18.8.1. by Product Form

        18.8.2. by End-use

        18.8.3. by Distribution Channel

    18.9. Italy Market Analysis

        18.9.1. by Product Form

        18.9.2. by End-use

        18.9.3. by Distribution Channel

    18.10. Spain Market Analysis

        18.10.1. by Product Form

        18.10.2. by End-use

        18.10.3. by Distribution Channel

    18.11. Belgium Market Analysis

        18.11.1. by Product Form

        18.11.2. by End-use

        18.11.3. by Distribution Channel

    18.12. Netherlands Market Analysis

        18.12.1. by Product Form

        18.12.2. by End-use

        18.12.3. by Distribution Channel

    18.13. Nordic Market Analysis

        18.13.1. by Product Form

        18.13.2. by End-use

        18.13.3. by Distribution Channel

    18.14. Russia Market Analysis

        18.14.1. by Product Form

        18.14.2. by End-use

        18.14.3. by Distribution Channel

    18.15. Poland Market Analysis

        18.15.1. by Product Form

        18.15.2. by End-use

        18.15.3. by Distribution Channel

    18.16. China Market Analysis

        18.16.1. by Product Form

        18.16.2. by End-use

        18.16.3. by Distribution Channel

    18.17. Japan Market Analysis

        18.17.1. by Product Form

        18.17.2. by End-use

        18.17.3. by Distribution Channel

    18.18. South Korea Market Analysis

        18.18.1. by Product Form

        18.18.2. by End-use

        18.18.3. by Distribution Channel

    18.19. India Market Analysis

        18.19.1. by Product Form

        18.19.2. by End-use

        18.19.3. by Distribution Channel

    18.20. Thailand Market Analysis

        18.20.1. by Product Form

        18.20.2. by End-use

        18.20.3. by Distribution Channel

    18.21. Malaysia Market Analysis

        18.21.1. by Product Form

        18.21.2. by End-use

        18.21.3. by Distribution Channel

    18.22. Vietnam Market Analysis

        18.22.1. by Product Form

        18.22.2. by End-use

        18.22.3. by Distribution Channel

    18.23. Philippines Market Analysis

        18.23.1. by Product Form

        18.23.2. by End-use

        18.23.3. by Distribution Channel

    18.24. Indonesia Market Analysis

        18.24.1. by Product Form

        18.24.2. by End-use

        18.24.3. by Distribution Channel

    18.25. Singapore Market Analysis

        18.25.1. by Product Form

        18.25.2. by End-use

        18.25.3. by Distribution Channel

    18.26. Australia Market Analysis

        18.26.1. by Product Form

        18.26.2. by End-use

        18.26.3. by Distribution Channel

    18.27. New Zealand Market Analysis

        18.27.1. by Product Form

        18.27.2. by End-use

        18.27.3. by Distribution Channel

    18.28. GCC Countries Market Analysis

        18.28.1. by Product Form

        18.28.2. by End-use

        18.28.3. by Distribution Channel

    18.29. Turkiye Market Analysis

        18.29.1. by Product Form

        18.29.2. by End-use

        18.29.3. by Distribution Channel

    18.30. Egypt Market Analysis

        18.30.1. by End-use

        18.30.2. by Distribution Channel

    18.31. South Africa Market Analysis

        18.31.1. by Product Form

        18.31.2. by End-use

        18.31.3. by Distribution Channel

19. Market Structure Analysis

    19.1. Global Wheat Germ Competition - a Dashboard View

    19.2. Industry Structure Analysis

        19.2.1. % tier 1 market players

        19.2.2. % tier 2 market players

        19.2.3. % tier 3 market players

    19.3. Global Market Company Share Analysis

        19.3.1. For Tier 1 Market Players, 2024

        19.3.2. Company Market Share Analysis of Top Players, by Region

    19.4. Key Participants Market Presence (Intensity Mapping) by Region

20. Competition Analysis

    20.1. Competition Dashboard

    20.2. Competition Benchmarking

    20.3. Competition Deep Dive

        20.3.1. S.A. Herbal Bioactives LLP

            20.3.1.1. Product Portfolio

            20.3.1.2. Product Claim

            20.3.1.3. Revenue by Market Segments

            20.3.1.4. Sales Footprint

            20.3.1.5. Strategy Overview

            20.3.1.6. SWOT Analysis

        20.3.2. Afriplex

        20.3.3. Spectrum Chemical

        20.3.4. Avi Naturals

        20.3.5. ParkAcre Enterprises Ltd.

        20.3.6. Herbal Bioactives LLP

        20.3.7. FENGCHEN GROUP CO., LTD.

        20.3.8. Biossance

        20.3.9. Now Foods

        20.3.10. Xi'an Green Spring Technology Co., Ltd

        20.3.11. Leven Rose

        20.3.12. HERBO NUTRA EXTRACT PRIVATE LIMITED

        20.3.13. Other Players (On Additional Requests)

21. Assumptions and Acronyms Used

22. Research Methodology

List of Tables

Table 1: Global Value (US$ million) Forecast by Region, 2019 to 2034

Table 2: Global Volume (MT) Forecast by Region, 2019 to 2034

Table 3: Global Value (US$ million) Forecast by Product Form, 2019 to 2034

Table 4: Global Volume (MT) Forecast by Product Form, 2019 to 2034

Table 5: Global Value (US$ million) Forecast by End-use, 2019 to 2034

Table 6: Global Volume (MT) Forecast by End-use, 2019 to 2034

Table 7: Global Value (US$ million) Forecast by Distribution Channel, 2019 to 2034

Table 8: Global Volume (MT) Forecast by Distribution Channel, 2019 to 2034

Table 9: North America Value (US$ million) Forecast by Country, 2019 to 2034

Table 10: North America Volume (MT) Forecast by Country, 2019 to 2034

Table 11: North America Value (US$ million) Forecast by Product Form, 2019 to 2034

Table 12: North America Volume (MT) Forecast by Product Form, 2019 to 2034

Table 13: North America Value (US$ million) Forecast by End-use, 2019 to 2034

Table 14: North America Volume (MT) Forecast by End-use, 2019 to 2034

Table 15: North America Value (US$ million) Forecast by Distribution Channel, 2019 to 2034

Table 16: North America Volume (MT) Forecast by Distribution Channel, 2019 to 2034

Table 17: Latin America Value (US$ million) Forecast by Country, 2019 to 2034

Table 18: Latin America Volume (MT) Forecast by Country, 2019 to 2034

Table 19: Latin America Value (US$ million) Forecast by Product Form, 2019 to 2034

Table 20: Latin America Volume (MT) Forecast by Product Form, 2019 to 2034

Table 21: Latin America Value (US$ million) Forecast by End-use, 2019 to 2034

Table 22: Latin America Volume (MT) Forecast by End-use, 2019 to 2034

Table 23: Latin America Value (US$ million) Forecast by Distribution Channel, 2019 to 2034

Table 24: Latin America Volume (MT) Forecast by Distribution Channel, 2019 to 2034

Table 25: Europe Value (US$ million) Forecast by Country, 2019 to 2034

Table 26: Europe Volume (MT) Forecast by Country, 2019 to 2034

Table 27: Europe Value (US$ million) Forecast by Product Form, 2019 to 2034

Table 28: Europe Volume (MT) Forecast by Product Form, 2019 to 2034

Table 29: Europe Value (US$ million) Forecast by End-use, 2019 to 2034

Table 30: Europe Volume (MT) Forecast by End-use, 2019 to 2034

Table 31: Europe Value (US$ million) Forecast by Distribution Channel, 2019 to 2034

Table 32: Europe Volume (MT) Forecast by Distribution Channel, 2019 to 2034

Table 33: East Asia Value (US$ million) Forecast by Country, 2019 to 2034

Table 34: East Asia Volume (MT) Forecast by Country, 2019 to 2034

Table 35: East Asia Value (US$ million) Forecast by Product Form, 2019 to 2034

Table 36: East Asia Volume (MT) Forecast by Product Form, 2019 to 2034

Table 37: East Asia Value (US$ million) Forecast by End-use, 2019 to 2034

Table 38: East Asia Volume (MT) Forecast by End-use, 2019 to 2034

Table 39: East Asia Value (US$ million) Forecast by Distribution Channel, 2019 to 2034

Table 40: East Asia Volume (MT) Forecast by Distribution Channel, 2019 to 2034

Table 41: South Asia Value (US$ million) Forecast by Country, 2019 to 2034

Table 42: South Asia Volume (MT) Forecast by Country, 2019 to 2034

Table 43: South Asia Value (US$ million) Forecast by Product Form, 2019 to 2034

Table 44: South Asia Volume (MT) Forecast by Product Form, 2019 to 2034

Table 45: South Asia Value (US$ million) Forecast by End-use, 2019 to 2034

Table 46: South Asia Volume (MT) Forecast by End-use, 2019 to 2034

Table 47: South Asia Value (US$ million) Forecast by Distribution Channel, 2019 to 2034

Table 48: South Asia Volume (MT) Forecast by Distribution Channel, 2019 to 2034

Table 49: Oceania Value (US$ million) Forecast by Country, 2019 to 2034

Table 50: Oceania Volume (MT) Forecast by Country, 2019 to 2034

Table 51: Oceania Value (US$ million) Forecast by Product Form, 2019 to 2034

Table 52: Oceania Volume (MT) Forecast by Product Form, 2019 to 2034

Table 53: Oceania Value (US$ million) Forecast by End-use, 2019 to 2034

Table 54: Oceania Volume (MT) Forecast by End-use, 2019 to 2034

Table 55: Oceania Value (US$ million) Forecast by Distribution Channel, 2019 to 2034

Table 56: Oceania Volume (MT) Forecast by Distribution Channel, 2019 to 2034

Table 57: Middle East and Africa Value (US$ million) Forecast by Country, 2019 to 2034

Table 58: Middle East and Africa Volume (MT) Forecast by Country, 2019 to 2034

Table 59: Middle East and Africa Value (US$ million) Forecast by Product Form, 2019 to 2034

Table 60: Middle East and Africa Volume (MT) Forecast by Product Form, 2019 to 2034

Table 61: Middle East and Africa Value (US$ million) Forecast by End-use, 2019 to 2034

Table 62: Middle East and Africa Volume (MT) Forecast by End-use, 2019 to 2034

Table 63: Middle East and Africa Value (US$ million) Forecast by Distribution Channel, 2019 to 2034

Table 64: Middle East and Africa Volume (MT) Forecast by Distribution Channel, 2019 to 2034

List of Charts

Figure 1: Global Market Value (US$ million) by Product Form, 2024 to 2034

Figure 2: Global Market Value (US$ million) by End-use, 2024 to 2034

Figure 3: Global Market Value (US$ million) by Distribution Channel, 2024 to 2034

Figure 4: Global Market Value (US$ million) by Region, 2024 to 2034

Figure 5: Global Market Value (US$ million) Analysis by Region, 2019 to 2034

Figure 6: Global Market Volume (MT) Analysis by Region, 2019 to 2034

Figure 7: Global Market Value Share (%) and BPS Analysis by Region, 2024 to 2034

Figure 8: Global Market Y-o-Y Growth (%) Projections by Region, 2024 to 2034

Figure 9: Global Market Value (US$ million) Analysis by Product Form, 2019 to 2034

Figure 10: Global Market Volume (MT) Analysis by Product Form, 2019 to 2034

Figure 11: Global Market Value Share (%) and BPS Analysis by Product Form, 2024 to 2034

Figure 12: Global Market Y-o-Y Growth (%) Projections by Product Form, 2024 to 2034

Figure 13: Global Market Value (US$ million) Analysis by End-use, 2019 to 2034

Figure 14: Global Market Volume (MT) Analysis by End-use, 2019 to 2034

Figure 15: Global Market Value Share (%) and BPS Analysis by End-use, 2024 to 2034

Figure 16: Global Market Y-o-Y Growth (%) Projections by End-use, 2024 to 2034

Figure 17: Global Market Value (US$ million) Analysis by Distribution Channel, 2019 to 2034

Figure 18: Global Market Volume (MT) Analysis by Distribution Channel, 2019 to 2034

Figure 19: Global Market Value Share (%) and BPS Analysis by Distribution Channel, 2024 to 2034

Figure 20: Global Market Y-o-Y Growth (%) Projections by Distribution Channel, 2024 to 2034

Figure 21: Global Market Attractiveness by Product Form, 2024 to 2034

Figure 22: Global Market Attractiveness by End-use, 2024 to 2034

Figure 23: Global Market Attractiveness by Distribution Channel, 2024 to 2034

Figure 24: Global Market Attractiveness by Region, 2024 to 2034

Figure 25: North America Market Value (US$ million) by Product Form, 2024 to 2034

Figure 26: North America Market Value (US$ million) by End-use, 2024 to 2034

Figure 27: North America Market Value (US$ million) by Distribution Channel, 2024 to 2034

Figure 28: North America Market Value (US$ million) by Country, 2024 to 2034

Figure 29: North America Market Value (US$ million) Analysis by Country, 2019 to 2034

Figure 30: North America Market Volume (MT) Analysis by Country, 2019 to 2034

Figure 31: North America Market Value Share (%) and BPS Analysis by Country, 2024 to 2034

Figure 32: North America Market Y-o-Y Growth (%) Projections by Country, 2024 to 2034

Figure 33: North America Market Value (US$ million) Analysis by Product Form, 2019 to 2034

Figure 34: North America Market Volume (MT) Analysis by Product Form, 2019 to 2034

Figure 35: North America Market Value Share (%) and BPS Analysis by Product Form, 2024 to 2034

Figure 36: North America Market Y-o-Y Growth (%) Projections by Product Form, 2024 to 2034

Figure 37: North America Market Value (US$ million) Analysis by End-use, 2019 to 2034

Figure 38: North America Market Volume (MT) Analysis by End-use, 2019 to 2034

Figure 39: North America Market Value Share (%) and BPS Analysis by End-use, 2024 to 2034

Figure 40: North America Market Y-o-Y Growth (%) Projections by End-use, 2024 to 2034

Figure 41: North America Market Value (US$ million) Analysis by Distribution Channel, 2019 to 2034

Figure 42: North America Market Volume (MT) Analysis by Distribution Channel, 2019 to 2034

Figure 43: North America Market Value Share (%) and BPS Analysis by Distribution Channel, 2024 to 2034

Figure 44: North America Market Y-o-Y Growth (%) Projections by Distribution Channel, 2024 to 2034

Figure 45: North America Market Attractiveness by Product Form, 2024 to 2034

Figure 46: North America Market Attractiveness by End-use, 2024 to 2034

Figure 47: North America Market Attractiveness by Distribution Channel, 2024 to 2034

Figure 48: North America Market Attractiveness by Country, 2024 to 2034

Figure 49: Latin America Market Value (US$ million) by Product Form, 2024 to 2034

Figure 50: Latin America Market Value (US$ million) by End-use, 2024 to 2034

Figure 51: Latin America Market Value (US$ million) by Distribution Channel, 2024 to 2034

Figure 52: Latin America Market Value (US$ million) by Country, 2024 to 2034

Figure 53: Latin America Market Value (US$ million) Analysis by Country, 2019 to 2034

Figure 54: Latin America Market Volume (MT) Analysis by Country, 2019 to 2034

Figure 55: Latin America Market Value Share (%) and BPS Analysis by Country, 2024 to 2034

Figure 56: Latin America Market Y-o-Y Growth (%) Projections by Country, 2024 to 2034

Figure 57: Latin America Market Value (US$ million) Analysis by Product Form, 2019 to 2034

Figure 58: Latin America Market Volume (MT) Analysis by Product Form, 2019 to 2034

Figure 59: Latin America Market Value Share (%) and BPS Analysis by Product Form, 2024 to 2034

Figure 60: Latin America Market Y-o-Y Growth (%) Projections by Product Form, 2024 to 2034

Figure 61: Latin America Market Value (US$ million) Analysis by End-use, 2019 to 2034

Figure 62: Latin America Market Volume (MT) Analysis by End-use, 2019 to 2034

Figure 63: Latin America Market Value Share (%) and BPS Analysis by End-use, 2024 to 2034

Figure 64: Latin America Market Y-o-Y Growth (%) Projections by End-use, 2024 to 2034

Figure 65: Latin America Market Value (US$ million) Analysis by Distribution Channel, 2019 to 2034

Figure 66: Latin America Market Volume (MT) Analysis by Distribution Channel, 2019 to 2034

Figure 67: Latin America Market Value Share (%) and BPS Analysis by Distribution Channel, 2024 to 2034

Figure 68: Latin America Market Y-o-Y Growth (%) Projections by Distribution Channel, 2024 to 2034

Figure 69: Latin America Market Attractiveness by Product Form, 2024 to 2034

Figure 70: Latin America Market Attractiveness by End-use, 2024 to 2034

Figure 71: Latin America Market Attractiveness by Distribution Channel, 2024 to 2034

Figure 72: Latin America Market Attractiveness by Country, 2024 to 2034

Figure 73: Europe Market Value (US$ million) by Product Form, 2024 to 2034

Figure 74: Europe Market Value (US$ million) by End-use, 2024 to 2034

Figure 75: Europe Market Value (US$ million) by Distribution Channel, 2024 to 2034

Figure 76: Europe Market Value (US$ million) by Country, 2024 to 2034

Figure 77: Europe Market Value (US$ million) Analysis by Country, 2019 to 2034

Figure 78: Europe Market Volume (MT) Analysis by Country, 2019 to 2034

Figure 79: Europe Market Value Share (%) and BPS Analysis by Country, 2024 to 2034

Figure 80: Europe Market Y-o-Y Growth (%) Projections by Country, 2024 to 2034

Figure 81: Europe Market Value (US$ million) Analysis by Product Form, 2019 to 2034

Figure 82: Europe Market Volume (MT) Analysis by Product Form, 2019 to 2034

Figure 83: Europe Market Value Share (%) and BPS Analysis by Product Form, 2024 to 2034

Figure 84: Europe Market Y-o-Y Growth (%) Projections by Product Form, 2024 to 2034

Figure 85: Europe Market Value (US$ million) Analysis by End-use, 2019 to 2034

Figure 86: Europe Market Volume (MT) Analysis by End-use, 2019 to 2034

Figure 87: Europe Market Value Share (%) and BPS Analysis by End-use, 2024 to 2034

Figure 88: Europe Market Y-o-Y Growth (%) Projections by End-use, 2024 to 2034

Figure 89: Europe Market Value (US$ million) Analysis by Distribution Channel, 2019 to 2034

Figure 90: Europe Market Volume (MT) Analysis by Distribution Channel, 2019 to 2034

Figure 91: Europe Market Value Share (%) and BPS Analysis by Distribution Channel, 2024 to 2034

Figure 92: Europe Market Y-o-Y Growth (%) Projections by Distribution Channel, 2024 to 2034

Figure 93: Europe Market Attractiveness by Product Form, 2024 to 2034

Figure 94: Europe Market Attractiveness by End-use, 2024 to 2034

Figure 95: Europe Market Attractiveness by Distribution Channel, 2024 to 2034

Figure 96: Europe Market Attractiveness by Country, 2024 to 2034

Figure 97: East Asia Market Value (US$ million) by Product Form, 2024 to 2034

Figure 98: East Asia Market Value (US$ million) by End-use, 2024 to 2034

Figure 99: East Asia Market Value (US$ million) by Distribution Channel, 2024 to 2034

Figure 100: East Asia Market Value (US$ million) by Country, 2024 to 2034

Figure 101: East Asia Market Value (US$ million) Analysis by Country, 2019 to 2034

Figure 102: East Asia Market Volume (MT) Analysis by Country, 2019 to 2034

Figure 103: East Asia Market Value Share (%) and BPS Analysis by Country, 2024 to 2034

Figure 104: East Asia Market Y-o-Y Growth (%) Projections by Country, 2024 to 2034

Figure 105: East Asia Market Value (US$ million) Analysis by Product Form, 2019 to 2034

Figure 106: East Asia Market Volume (MT) Analysis by Product Form, 2019 to 2034

Figure 107: East Asia Market Value Share (%) and BPS Analysis by Product Form, 2024 to 2034

Figure 108: East Asia Market Y-o-Y Growth (%) Projections by Product Form, 2024 to 2034

Figure 109: East Asia Market Value (US$ million) Analysis by End-use, 2019 to 2034

Figure 110: East Asia Market Volume (MT) Analysis by End-use, 2019 to 2034

Figure 111: East Asia Market Value Share (%) and BPS Analysis by End-use, 2024 to 2034

Figure 112: East Asia Market Y-o-Y Growth (%) Projections by End-use, 2024 to 2034

Figure 113: East Asia Market Value (US$ million) Analysis by Distribution Channel, 2019 to 2034

Figure 114: East Asia Market Volume (MT) Analysis by Distribution Channel, 2019 to 2034

Figure 115: East Asia Market Value Share (%) and BPS Analysis by Distribution Channel, 2024 to 2034

Figure 116: East Asia Market Y-o-Y Growth (%) Projections by Distribution Channel, 2024 to 2034

Figure 117: East Asia Market Attractiveness by Product Form, 2024 to 2034

Figure 118: East Asia Market Attractiveness by End-use, 2024 to 2034

Figure 119: East Asia Market Attractiveness by Distribution Channel, 2024 to 2034

Figure 120: East Asia Market Attractiveness by Country, 2024 to 2034

Figure 121: South Asia Market Value (US$ million) by Product Form, 2024 to 2034

Figure 122: South Asia Market Value (US$ million) by End-use, 2024 to 2034

Figure 123: South Asia Market Value (US$ million) by Distribution Channel, 2024 to 2034

Figure 124: South Asia Market Value (US$ million) by Country, 2024 to 2034

Figure 125: South Asia Market Value (US$ million) Analysis by Country, 2019 to 2034

Figure 126: South Asia Market Volume (MT) Analysis by Country, 2019 to 2034

Figure 127: South Asia Market Value Share (%) and BPS Analysis by Country, 2024 to 2034

Figure 128: South Asia Market Y-o-Y Growth (%) Projections by Country, 2024 to 2034

Figure 129: South Asia Market Value (US$ million) Analysis by Product Form, 2019 to 2034

Figure 130: South Asia Market Volume (MT) Analysis by Product Form, 2019 to 2034

Figure 131: South Asia Market Value Share (%) and BPS Analysis by Product Form, 2024 to 2034

Figure 132: South Asia Market Y-o-Y Growth (%) Projections by Product Form, 2024 to 2034

Figure 133: South Asia Market Value (US$ million) Analysis by End-use, 2019 to 2034

Figure 134: South Asia Market Volume (MT) Analysis by End-use, 2019 to 2034

Figure 135: South Asia Market Value Share (%) and BPS Analysis by End-use, 2024 to 2034

Figure 136: South Asia Market Y-o-Y Growth (%) Projections by End-use, 2024 to 2034

Figure 137: South Asia Market Value (US$ million) Analysis by Distribution Channel, 2019 to 2034

Figure 138: South Asia Market Volume (MT) Analysis by Distribution Channel, 2019 to 2034

Figure 139: South Asia Market Value Share (%) and BPS Analysis by Distribution Channel, 2024 to 2034

Figure 140: South Asia Market Y-o-Y Growth (%) Projections by Distribution Channel, 2024 to 2034

Figure 141: South Asia Market Attractiveness by Product Form, 2024 to 2034

Figure 142: South Asia Market Attractiveness by End-use, 2024 to 2034

Figure 143: South Asia Market Attractiveness by Distribution Channel, 2024 to 2034

Figure 144: South Asia Market Attractiveness by Country, 2024 to 2034

Figure 145: Oceania Market Value (US$ million) by Product Form, 2024 to 2034

Figure 146: Oceania Market Value (US$ million) by End-use, 2024 to 2034

Figure 147: Oceania Market Value (US$ million) by Distribution Channel, 2024 to 2034

Figure 148: Oceania Market Value (US$ million) by Country, 2024 to 2034

Figure 149: Oceania Market Value (US$ million) Analysis by Country, 2019 to 2034

Figure 150: Oceania Market Volume (MT) Analysis by Country, 2019 to 2034

Figure 151: Oceania Market Value Share (%) and BPS Analysis by Country, 2024 to 2034

Figure 152: Oceania Market Y-o-Y Growth (%) Projections by Country, 2024 to 2034

Figure 153: Oceania Market Value (US$ million) Analysis by Product Form, 2019 to 2034

Figure 154: Oceania Market Volume (MT) Analysis by Product Form, 2019 to 2034

Figure 155: Oceania Market Value Share (%) and BPS Analysis by Product Form, 2024 to 2034

Figure 156: Oceania Market Y-o-Y Growth (%) Projections by Product Form, 2024 to 2034

Figure 157: Oceania Market Value (US$ million) Analysis by End-use, 2019 to 2034

Figure 158: Oceania Market Volume (MT) Analysis by End-use, 2019 to 2034

Figure 159: Oceania Market Value Share (%) and BPS Analysis by End-use, 2024 to 2034

Figure 160: Oceania Market Y-o-Y Growth (%) Projections by End-use, 2024 to 2034

Figure 161: Oceania Market Value (US$ million) Analysis by Distribution Channel, 2019 to 2034

Figure 162: Oceania Market Volume (MT) Analysis by Distribution Channel, 2019 to 2034

Figure 163: Oceania Market Value Share (%) and BPS Analysis by Distribution Channel, 2024 to 2034

Figure 164: Oceania Market Y-o-Y Growth (%) Projections by Distribution Channel, 2024 to 2034

Figure 165: Oceania Market Attractiveness by Product Form, 2024 to 2034

Figure 166: Oceania Market Attractiveness by End-use, 2024 to 2034

Figure 167: Oceania Market Attractiveness by Distribution Channel, 2024 to 2034

Figure 168: Oceania Market Attractiveness by Country, 2024 to 2034

Figure 169: Middle East and Africa Market Value (US$ million) by Product Form, 2024 to 2034

Figure 170: Middle East and Africa Market Value (US$ million) by End-use, 2024 to 2034

Figure 171: Middle East and Africa Market Value (US$ million) by Distribution Channel, 2024 to 2034

Figure 172: Middle East and Africa Market Value (US$ million) by Country, 2024 to 2034

Figure 173: Middle East and Africa Market Value (US$ million) Analysis by Country, 2019 to 2034

Figure 174: Middle East and Africa Market Volume (MT) Analysis by Country, 2019 to 2034

Figure 175: Middle East and Africa Market Value Share (%) and BPS Analysis by Country, 2024 to 2034

Figure 176: Middle East and Africa Market Y-o-Y Growth (%) Projections by Country, 2024 to 2034

Figure 177: Middle East and Africa Market Value (US$ million) Analysis by Product Form, 2019 to 2034

Figure 178: Middle East and Africa Market Volume (MT) Analysis by Product Form, 2019 to 2034

Figure 179: Middle East and Africa Market Value Share (%) and BPS Analysis by Product Form, 2024 to 2034

Figure 180: Middle East and Africa Market Y-o-Y Growth (%) Projections by Product Form, 2024 to 2034

Figure 181: Middle East and Africa Market Value (US$ million) Analysis by End-use, 2019 to 2034

Figure 182: Middle East and Africa Market Volume (MT) Analysis by End-use, 2019 to 2034

Figure 183: Middle East and Africa Market Value Share (%) and BPS Analysis by End-use, 2024 to 2034

Figure 184: Middle East and Africa Market Y-o-Y Growth (%) Projections by End-use, 2024 to 2034

Figure 185: Middle East and Africa Market Value (US$ million) Analysis by Distribution Channel, 2019 to 2034

Figure 186: Middle East and Africa Market Volume (MT) Analysis by Distribution Channel, 2019 to 2034

Figure 187: Middle East and Africa Market Value Share (%) and BPS Analysis by Distribution Channel, 2024 to 2034

Figure 188: Middle East and Africa Market Y-o-Y Growth (%) Projections by Distribution Channel, 2024 to 2034

Figure 189: Middle East and Africa Market Attractiveness by Product Form, 2024 to 2034

Figure 190: Middle East and Africa Market Attractiveness by End-use, 2024 to 2034

Figure 191: Middle East and Africa Market Attractiveness by Distribution Channel, 2024 to 2034

Figure 192: Middle East and Africa Market Attractiveness by Country, 2024 to 2034

Recommendations

Food and Beverage

Moringa Extract Market

Published : October 2023

Food and Beverage

Amla Extract Market

Published : June 2023

Food and Beverage

Green Tea Extracts Market

Published : February 2023

Food and Beverage

GCC Functional Food Market

Published : December 2014

Explore Food and Beverage Insights

View Reports