Revenues for pharmaceuticals industry in Saudi Arabia are estimated to rise at a 5.20% CAGR through 2034
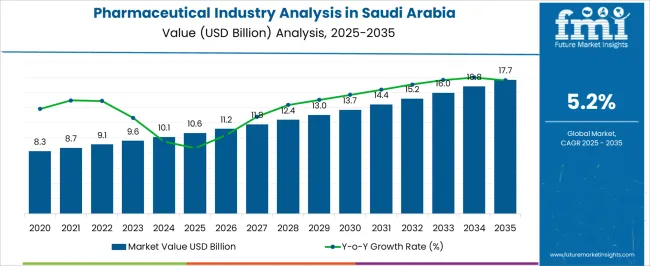
Revenues for pharmaceuticals industry in Saudi Arabia are estimated to rise at a 5.20% CAGR through 2034. The overall demand for pharmaceuticals in Saudi Arabia is likely to surge, crossing a valuation of USD 10,113.1 million in 2024. By 2034, sales projections for pharmaceuticals in Saudi Arabia indicate attaining a valuation of USD 16,789.6 million.
Key Trends Boosting Sales through 2034:
Attributes | Details |
---|---|
Industry Size in Saudi Arabia in 2024 | USD 10,113.1 million |
Expected Industry Size of Saudi Arabia in 2034 | USD 16.789.6 million |
Forecasted CAGR between 2024 and 2034 | 5.20% |
Attributes | Details |
---|---|
Historical CAGR (2019 to 2023) | 9.0% |
Forecasted CAGR (2024 to 2034) | 5.20% |
The Saudi Arabian pharmaceutical industry expanded at a 9.0% CAGR from 2019 to 2023. The Saudi government has aggressively promoted economic diversification and the growth of the healthcare industry. Initiatives like Vision 2030, unveiled in 2016, attempt to minimize the Kingdom’s reliance on oil while also focusing on developing a more varied and sustainable economy. The expansion of the pharmaceutical sector in Saudi Arabia is facilitated by investments in research and development as well as infrastructure related to healthcare.
Saudi Arabia's population is expanding quickly, and the country is seeing a rise in the frequency of chronic illnesses and pharmaceutical products. Due to the expanding healthcare demands, pharmaceutical firms now have more opportunities to grow and satisfy the demand for drugs.
By enacting reforms, Saudi Arabia has liberalized its economy and opened it up to international investment, particularly in the pharmaceutical industry. As a result, more foreign pharmaceutical businesses are now present in the Saudi pharmaceutical sector, contributing knowledge, funds, and technology.
Access to healthcare services has increased throughout Saudi Arabia due to investments in the country's healthcare infrastructure, which includes clinics, hospitals, and pharmacies. As a result, there is now a greater need than ever for pharmaceuticals to satisfy the demands of an expanding patient base.
The demand for pharmaceuticals in Saudi Arabia is predicted to rise at 5.20% through 2034. Although the growth rate is lower than the historical period, ongoing investments in healthcare infrastructure are likely to bolster pharmaceutical demand in Saudi Arabia.
Saudi Arabia can anticipate an increase in medical tourism as the nation works to establish itself as a regional center for healthcare. As a result, pharmaceutical enterprises are going to have more chances to offer medical services and goods to a global patient population.
Leading Drug Type for Pharmaceuticals in Saudi Arabia | Branded Drugs |
---|---|
Total Value Share (2024) | 72% |
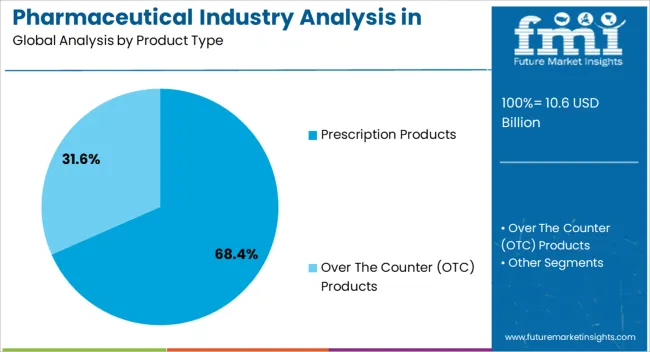
Eighty percent of Saudi Arabia's pharmaceuticals are imported from foreign nations. Merely thirty percent of Saudi Arabia's medicines and a small fraction of branded medication output are domestically manufactured. Branded drugs from various leading giants are highly preferred in Saudi Arabia due to their perceived quality and efficacy over generic drugs.
Even when generic medications have the same active components as their branded equivalents, consumers tend to see branded medications as more inventive and potent. In economies where consumers place a premium on perceived efficacy, the notion that branded medications provide better outcomes can increase demand.
Certain pharmaceutical firms provide patients discounts or financial help through their loyalty programs or assistance programs for branded medications. These initiatives affect patient decisions and raise the demand for branded pharmaceuticals.
Leading Drug Class for Pharmaceuticals in Saudi Arabia | Small Molecules |
---|---|
Total Value Share (2024) | 86% |
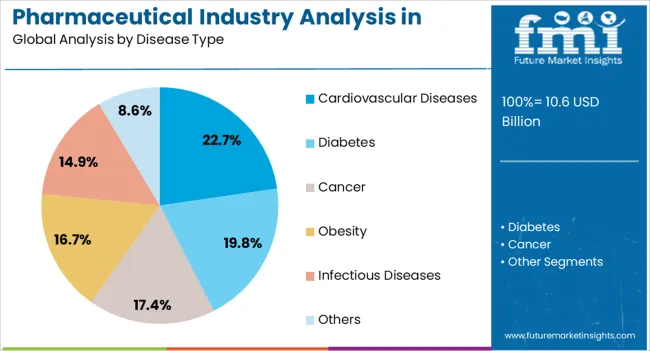
It is normal practice to treat common health issues, including infections, diabetes, and cardiovascular illnesses, with small molecules. Since these illnesses are becoming more common in Saudi Arabia, there is likely to be an enormous demand for small-molecule medications that target these medical disorders.
Small molecule medications are often accessible and available, particularly in generic form. When it comes to healthcare systems that strive for universal coverage and availability of pharmaceutical treatments, this accessibility guarantees a consistent supply of necessary pharmaceuticals, which adds to their appeal.
Complex biologics are typically more expensive to develop than small molecules, especially generic variants. Small molecules' affordability fuels demand in healthcare systems where cost is an integral factor, particularly when treating common health issues.
Regulatory bodies around the globe, including Saudi Arabia, typically have well-defined procedures implemented for examining and approving small molecule medications. Small molecules are in high demand in this sector because their regulatory routes are well-known, which helps speed up and simplify the clearance procedure.
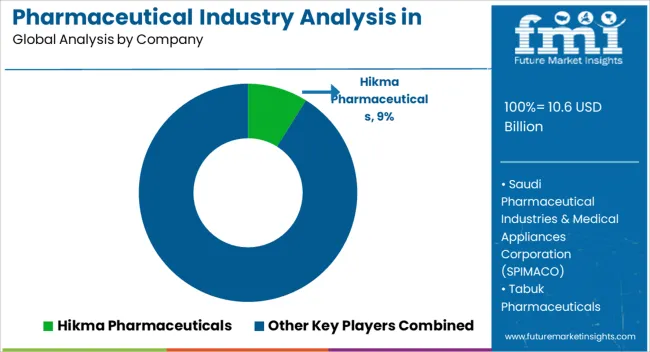
The pharmaceutical industry in Saudi Arabia is marked by a competitive and dynamic environment that both domestic and foreign firms fuel. Various businesses compete for dominance in this industry, hoping to take advantage of the nation's changing healthcare requirements.
Companies like Tabuk Pharmaceuticals, Jamjoom Pharma, and Saudi Pharmaceutical Industries & Medical Appliances Corporation (SPIMACO) are important participants in the domestic market and significantly affect the sector's expansion. These businesses use their knowledge of the local market, well-established distribution networks, and compliance with laws and regulations to stay one step ahead of the competition.
Strategies for Key Players to Tap into Potential Growth Opportunities
Recent Developments:
Attribute | Details |
---|---|
Estimated Industry Size in 2024 | USD 10,113.1 million |
Projected Industry Size in 2034 | USD 16,789.6 million |
Anticipated CAGR between 2024 to 2034 | 5.20% CAGR |
Historical Analysis of Demand for Pharmaceuticals in Saudi Arabia | 2019 to 2023 |
Demand Forecast for Pharmaceuticals in Saudi Arabia | 2024 to 2034 |
Report Coverage | Industry Size, Industry Trends, Analysis of key factors influencing Pharmaceuticals Adoption in Saudi Arabia, Insights on Global Players and their Industry Strategy in Saudi Arabia, Ecosystem Analysis of Local and Regional Saudi Arabia Manufacturers |
Key Companies Profiled | Saudi Pharmaceutical Industries & Medical Appliances Corporation (SPIMACO); Tabuk Pharmaceuticals; Hikma Pharmaceuticals; Julphar Saudi Arabia; Jamjoom Pharma; Modern Pharmaceutical Company (MPC); Ameco Pharmaceutical Company; Tadawi; Al Nahdi Medical Company; Sipco (Saudi Industrial Products Company) |
Table 1: Market Value (US$ Million) Forecast by Region, 2019 to 2034
Table 2: Market Volume (Units) Forecast by Region, 2019 to 2034
Table 3: Market Value (US$ Million) Forecast by Product Type, 2019 to 2034
Table 4: Market Volume (Units) Forecast by Product Type, 2019 to 2034
Table 5: Market Value (US$ Million) Forecast by Disease Type, 2019 to 2034
Table 6: Market Volume (Units) Forecast by Disease Type, 2019 to 2034
Table 7: Market Value (US$ Million) Forecast by Distribution Channel, 2019 to 2034
Table 8: Market Volume (Units) Forecast by Distribution Channel, 2019 to 2034
Table 9: Riyadh Province Market Value (US$ Million) Forecast by Region, 2019 to 2034
Table 10: Riyadh Province Market Volume (Units) Forecast by Region, 2019 to 2034
Table 11: Riyadh Province Market Value (US$ Million) Forecast by Product Type, 2019 to 2034
Table 12: Riyadh Province Market Volume (Units) Forecast by Product Type, 2019 to 2034
Table 13: Riyadh Province Market Value (US$ Million) Forecast by Disease Type, 2019 to 2034
Table 14: Riyadh Province Market Volume (Units) Forecast by Disease Type, 2019 to 2034
Table 15: Riyadh Province Market Value (US$ Million) Forecast by Distribution Channel, 2019 to 2034
Table 16: Riyadh Province Market Volume (Units) Forecast by Distribution Channel, 2019 to 2034
Table 17: Mecca Province Market Value (US$ Million) Forecast by Region, 2019 to 2034
Table 18: Mecca Province Market Volume (Units) Forecast by Region, 2019 to 2034
Table 19: Mecca Province Market Value (US$ Million) Forecast by Product Type, 2019 to 2034
Table 20: Mecca Province Market Volume (Units) Forecast by Product Type, 2019 to 2034
Table 21: Mecca Province Market Value (US$ Million) Forecast by Disease Type, 2019 to 2034
Table 22: Mecca Province Market Volume (Units) Forecast by Disease Type, 2019 to 2034
Table 23: Mecca Province Market Value (US$ Million) Forecast by Distribution Channel, 2019 to 2034
Table 24: Mecca Province Market Volume (Units) Forecast by Distribution Channel, 2019 to 2034
Table 25: Eastern Province Market Value (US$ Million) Forecast by Region, 2019 to 2034
Table 26: Eastern Province Market Volume (Units) Forecast by Region, 2019 to 2034
Table 27: Eastern Province Market Value (US$ Million) Forecast by Product Type, 2019 to 2034
Table 28: Eastern Province Market Volume (Units) Forecast by Product Type, 2019 to 2034
Table 29: Eastern Province Market Value (US$ Million) Forecast by Disease Type, 2019 to 2034
Table 30: Eastern Province Market Volume (Units) Forecast by Disease Type, 2019 to 2034
Table 31: Eastern Province Market Value (US$ Million) Forecast by Distribution Channel, 2019 to 2034
Table 32: Eastern Province Market Volume (Units) Forecast by Distribution Channel, 2019 to 2034
Table 33: Medina Province Market Value (US$ Million) Forecast by Region, 2019 to 2034
Table 34: Medina Province Market Volume (Units) Forecast by Region, 2019 to 2034
Table 35: Medina Province Market Value (US$ Million) Forecast by Product Type, 2019 to 2034
Table 36: Medina Province Market Volume (Units) Forecast by Product Type, 2019 to 2034
Table 37: Medina Province Market Value (US$ Million) Forecast by Disease Type, 2019 to 2034
Table 38: Medina Province Market Volume (Units) Forecast by Disease Type, 2019 to 2034
Table 39: Medina Province Market Value (US$ Million) Forecast by Distribution Channel, 2019 to 2034
Table 40: Medina Province Market Volume (Units) Forecast by Distribution Channel, 2019 to 2034
Table 41: Jazan Province Market Value (US$ Million) Forecast by Region, 2019 to 2034
Table 42: Jazan Province Market Volume (Units) Forecast by Region, 2019 to 2034
Table 43: Jazan Province Market Value (US$ Million) Forecast by Product Type, 2019 to 2034
Table 44: Jazan Province Market Volume (Units) Forecast by Product Type, 2019 to 2034
Table 45: Jazan Province Market Value (US$ Million) Forecast by Disease Type, 2019 to 2034
Table 46: Jazan Province Market Volume (Units) Forecast by Disease Type, 2019 to 2034
Table 47: Jazan Province Market Value (US$ Million) Forecast by Distribution Channel, 2019 to 2034
Table 48: Jazan Province Market Volume (Units) Forecast by Distribution Channel, 2019 to 2034
Table 49: Asir Province Market Value (US$ Million) Forecast by Region, 2019 to 2034
Table 50: Asir Province Market Volume (Units) Forecast by Region, 2019 to 2034
Table 51: Asir Province Market Value (US$ Million) Forecast by Product Type, 2019 to 2034
Table 52: Asir Province Market Volume (Units) Forecast by Product Type, 2019 to 2034
Table 53: Asir Province Market Value (US$ Million) Forecast by Disease Type, 2019 to 2034
Table 54: Asir Province Market Volume (Units) Forecast by Disease Type, 2019 to 2034
Table 55: Asir Province Market Value (US$ Million) Forecast by Distribution Channel, 2019 to 2034
Table 56: Asir Province Market Volume (Units) Forecast by Distribution Channel, 2019 to 2034
Table 57: Rest of Market Value (US$ Million) Forecast by Region, 2019 to 2034
Table 58: Rest of Market Volume (Units) Forecast by Region, 2019 to 2034
Table 59: Rest of Market Value (US$ Million) Forecast by Product Type, 2019 to 2034
Table 60: Rest of Market Volume (Units) Forecast by Product Type, 2019 to 2034
Table 61: Rest of Market Value (US$ Million) Forecast by Disease Type, 2019 to 2034
Table 62: Rest of Market Volume (Units) Forecast by Disease Type, 2019 to 2034
Table 63: Rest of Market Value (US$ Million) Forecast by Distribution Channel, 2019 to 2034
Table 64: Rest of Market Volume (Units) Forecast by Distribution Channel, 2019 to 2034
Figure 1: Market Value (US$ Million) by Product Type, 2024 to 2034
Figure 2: Market Value (US$ Million) by Disease Type, 2024 to 2034
Figure 3: Market Value (US$ Million) by Distribution Channel, 2024 to 2034
Figure 4: Market Value (US$ Million) by Region, 2024 to 2034
Figure 5: Market Value (US$ Million) Analysis by Region, 2019 to 2034
Figure 6: Market Volume (Units) Analysis by Region, 2019 to 2034
Figure 7: Market Value Share (%) and BPS Analysis by Region, 2024 to 2034
Figure 8: Market Y-o-Y Growth (%) Projections by Region, 2024 to 2034
Figure 9: Market Value (US$ Million) Analysis by Product Type, 2019 to 2034
Figure 10: Market Volume (Units) Analysis by Product Type, 2019 to 2034
Figure 11: Market Value Share (%) and BPS Analysis by Product Type, 2024 to 2034
Figure 12: Market Y-o-Y Growth (%) Projections by Product Type, 2024 to 2034
Figure 13: Market Value (US$ Million) Analysis by Disease Type, 2019 to 2034
Figure 14: Market Volume (Units) Analysis by Disease Type, 2019 to 2034
Figure 15: Market Value Share (%) and BPS Analysis by Disease Type, 2024 to 2034
Figure 16: Market Y-o-Y Growth (%) Projections by Disease Type, 2024 to 2034
Figure 17: Market Value (US$ Million) Analysis by Distribution Channel, 2019 to 2034
Figure 18: Market Volume (Units) Analysis by Distribution Channel, 2019 to 2034
Figure 19: Market Value Share (%) and BPS Analysis by Distribution Channel, 2024 to 2034
Figure 20: Market Y-o-Y Growth (%) Projections by Distribution Channel, 2024 to 2034
Figure 21: Market Attractiveness by Product Type, 2024 to 2034
Figure 22: Market Attractiveness by Disease Type, 2024 to 2034
Figure 23: Market Attractiveness by Distribution Channel, 2024 to 2034
Figure 24: Market Attractiveness by Region, 2024 to 2034
Figure 25: Riyadh Province Market Value (US$ Million) by Product Type, 2024 to 2034
Figure 26: Riyadh Province Market Value (US$ Million) by Disease Type, 2024 to 2034
Figure 27: Riyadh Province Market Value (US$ Million) by Distribution Channel, 2024 to 2034
Figure 28: Riyadh Province Market Value (US$ Million) by Region, 2024 to 2034
Figure 29: Riyadh Province Market Value (US$ Million) Analysis by Region, 2019 to 2034
Figure 30: Riyadh Province Market Volume (Units) Analysis by Region, 2019 to 2034
Figure 31: Riyadh Province Market Value Share (%) and BPS Analysis by Region, 2024 to 2034
Figure 32: Riyadh Province Market Y-o-Y Growth (%) Projections by Region, 2024 to 2034
Figure 33: Riyadh Province Market Value (US$ Million) Analysis by Product Type, 2019 to 2034
Figure 34: Riyadh Province Market Volume (Units) Analysis by Product Type, 2019 to 2034
Figure 35: Riyadh Province Market Value Share (%) and BPS Analysis by Product Type, 2024 to 2034
Figure 36: Riyadh Province Market Y-o-Y Growth (%) Projections by Product Type, 2024 to 2034
Figure 37: Riyadh Province Market Value (US$ Million) Analysis by Disease Type, 2019 to 2034
Figure 38: Riyadh Province Market Volume (Units) Analysis by Disease Type, 2019 to 2034
Figure 39: Riyadh Province Market Value Share (%) and BPS Analysis by Disease Type, 2024 to 2034
Figure 40: Riyadh Province Market Y-o-Y Growth (%) Projections by Disease Type, 2024 to 2034
Figure 41: Riyadh Province Market Value (US$ Million) Analysis by Distribution Channel, 2019 to 2034
Figure 42: Riyadh Province Market Volume (Units) Analysis by Distribution Channel, 2019 to 2034
Figure 43: Riyadh Province Market Value Share (%) and BPS Analysis by Distribution Channel, 2024 to 2034
Figure 44: Riyadh Province Market Y-o-Y Growth (%) Projections by Distribution Channel, 2024 to 2034
Figure 45: Riyadh Province Market Attractiveness by Product Type, 2024 to 2034
Figure 46: Riyadh Province Market Attractiveness by Disease Type, 2024 to 2034
Figure 47: Riyadh Province Market Attractiveness by Distribution Channel, 2024 to 2034
Figure 48: Riyadh Province Market Attractiveness by Region, 2024 to 2034
Figure 49: Mecca Province Market Value (US$ Million) by Product Type, 2024 to 2034
Figure 50: Mecca Province Market Value (US$ Million) by Disease Type, 2024 to 2034
Figure 51: Mecca Province Market Value (US$ Million) by Distribution Channel, 2024 to 2034
Figure 52: Mecca Province Market Value (US$ Million) by Region, 2024 to 2034
Figure 53: Mecca Province Market Value (US$ Million) Analysis by Region, 2019 to 2034
Figure 54: Mecca Province Market Volume (Units) Analysis by Region, 2019 to 2034
Figure 55: Mecca Province Market Value Share (%) and BPS Analysis by Region, 2024 to 2034
Figure 56: Mecca Province Market Y-o-Y Growth (%) Projections by Region, 2024 to 2034
Figure 57: Mecca Province Market Value (US$ Million) Analysis by Product Type, 2019 to 2034
Figure 58: Mecca Province Market Volume (Units) Analysis by Product Type, 2019 to 2034
Figure 59: Mecca Province Market Value Share (%) and BPS Analysis by Product Type, 2024 to 2034
Figure 60: Mecca Province Market Y-o-Y Growth (%) Projections by Product Type, 2024 to 2034
Figure 61: Mecca Province Market Value (US$ Million) Analysis by Disease Type, 2019 to 2034
Figure 62: Mecca Province Market Volume (Units) Analysis by Disease Type, 2019 to 2034
Figure 63: Mecca Province Market Value Share (%) and BPS Analysis by Disease Type, 2024 to 2034
Figure 64: Mecca Province Market Y-o-Y Growth (%) Projections by Disease Type, 2024 to 2034
Figure 65: Mecca Province Market Value (US$ Million) Analysis by Distribution Channel, 2019 to 2034
Figure 66: Mecca Province Market Volume (Units) Analysis by Distribution Channel, 2019 to 2034
Figure 67: Mecca Province Market Value Share (%) and BPS Analysis by Distribution Channel, 2024 to 2034
Figure 68: Mecca Province Market Y-o-Y Growth (%) Projections by Distribution Channel, 2024 to 2034
Figure 69: Mecca Province Market Attractiveness by Product Type, 2024 to 2034
Figure 70: Mecca Province Market Attractiveness by Disease Type, 2024 to 2034
Figure 71: Mecca Province Market Attractiveness by Distribution Channel, 2024 to 2034
Figure 72: Mecca Province Market Attractiveness by Region, 2024 to 2034
Figure 73: Eastern Province Market Value (US$ Million) by Product Type, 2024 to 2034
Figure 74: Eastern Province Market Value (US$ Million) by Disease Type, 2024 to 2034
Figure 75: Eastern Province Market Value (US$ Million) by Distribution Channel, 2024 to 2034
Figure 76: Eastern Province Market Value (US$ Million) by Region, 2024 to 2034
Figure 77: Eastern Province Market Value (US$ Million) Analysis by Region, 2019 to 2034
Figure 78: Eastern Province Market Volume (Units) Analysis by Region, 2019 to 2034
Figure 79: Eastern Province Market Value Share (%) and BPS Analysis by Region, 2024 to 2034
Figure 80: Eastern Province Market Y-o-Y Growth (%) Projections by Region, 2024 to 2034
Figure 81: Eastern Province Market Value (US$ Million) Analysis by Product Type, 2019 to 2034
Figure 82: Eastern Province Market Volume (Units) Analysis by Product Type, 2019 to 2034
Figure 83: Eastern Province Market Value Share (%) and BPS Analysis by Product Type, 2024 to 2034
Figure 84: Eastern Province Market Y-o-Y Growth (%) Projections by Product Type, 2024 to 2034
Figure 85: Eastern Province Market Value (US$ Million) Analysis by Disease Type, 2019 to 2034
Figure 86: Eastern Province Market Volume (Units) Analysis by Disease Type, 2019 to 2034
Figure 87: Eastern Province Market Value Share (%) and BPS Analysis by Disease Type, 2024 to 2034
Figure 88: Eastern Province Market Y-o-Y Growth (%) Projections by Disease Type, 2024 to 2034
Figure 89: Eastern Province Market Value (US$ Million) Analysis by Distribution Channel, 2019 to 2034
Figure 90: Eastern Province Market Volume (Units) Analysis by Distribution Channel, 2019 to 2034
Figure 91: Eastern Province Market Value Share (%) and BPS Analysis by Distribution Channel, 2024 to 2034
Figure 92: Eastern Province Market Y-o-Y Growth (%) Projections by Distribution Channel, 2024 to 2034
Figure 93: Eastern Province Market Attractiveness by Product Type, 2024 to 2034
Figure 94: Eastern Province Market Attractiveness by Disease Type, 2024 to 2034
Figure 95: Eastern Province Market Attractiveness by Distribution Channel, 2024 to 2034
Figure 96: Eastern Province Market Attractiveness by Region, 2024 to 2034
Figure 97: Medina Province Market Value (US$ Million) by Product Type, 2024 to 2034
Figure 98: Medina Province Market Value (US$ Million) by Disease Type, 2024 to 2034
Figure 99: Medina Province Market Value (US$ Million) by Distribution Channel, 2024 to 2034
Figure 100: Medina Province Market Value (US$ Million) by Region, 2024 to 2034
Figure 101: Medina Province Market Value (US$ Million) Analysis by Region, 2019 to 2034
Figure 102: Medina Province Market Volume (Units) Analysis by Region, 2019 to 2034
Figure 103: Medina Province Market Value Share (%) and BPS Analysis by Region, 2024 to 2034
Figure 104: Medina Province Market Y-o-Y Growth (%) Projections by Region, 2024 to 2034
Figure 105: Medina Province Market Value (US$ Million) Analysis by Product Type, 2019 to 2034
Figure 106: Medina Province Market Volume (Units) Analysis by Product Type, 2019 to 2034
Figure 107: Medina Province Market Value Share (%) and BPS Analysis by Product Type, 2024 to 2034
Figure 108: Medina Province Market Y-o-Y Growth (%) Projections by Product Type, 2024 to 2034
Figure 109: Medina Province Market Value (US$ Million) Analysis by Disease Type, 2019 to 2034
Figure 110: Medina Province Market Volume (Units) Analysis by Disease Type, 2019 to 2034
Figure 111: Medina Province Market Value Share (%) and BPS Analysis by Disease Type, 2024 to 2034
Figure 112: Medina Province Market Y-o-Y Growth (%) Projections by Disease Type, 2024 to 2034
Figure 113: Medina Province Market Value (US$ Million) Analysis by Distribution Channel, 2019 to 2034
Figure 114: Medina Province Market Volume (Units) Analysis by Distribution Channel, 2019 to 2034
Figure 115: Medina Province Market Value Share (%) and BPS Analysis by Distribution Channel, 2024 to 2034
Figure 116: Medina Province Market Y-o-Y Growth (%) Projections by Distribution Channel, 2024 to 2034
Figure 117: Medina Province Market Attractiveness by Product Type, 2024 to 2034
Figure 118: Medina Province Market Attractiveness by Disease Type, 2024 to 2034
Figure 119: Medina Province Market Attractiveness by Distribution Channel, 2024 to 2034
Figure 120: Medina Province Market Attractiveness by Region, 2024 to 2034
Figure 121: Jazan Province Market Value (US$ Million) by Product Type, 2024 to 2034
Figure 122: Jazan Province Market Value (US$ Million) by Disease Type, 2024 to 2034
Figure 123: Jazan Province Market Value (US$ Million) by Distribution Channel, 2024 to 2034
Figure 124: Jazan Province Market Value (US$ Million) by Region, 2024 to 2034
Figure 125: Jazan Province Market Value (US$ Million) Analysis by Region, 2019 to 2034
Figure 126: Jazan Province Market Volume (Units) Analysis by Region, 2019 to 2034
Figure 127: Jazan Province Market Value Share (%) and BPS Analysis by Region, 2024 to 2034
Figure 128: Jazan Province Market Y-o-Y Growth (%) Projections by Region, 2024 to 2034
Figure 129: Jazan Province Market Value (US$ Million) Analysis by Product Type, 2019 to 2034
Figure 130: Jazan Province Market Volume (Units) Analysis by Product Type, 2019 to 2034
Figure 131: Jazan Province Market Value Share (%) and BPS Analysis by Product Type, 2024 to 2034
Figure 132: Jazan Province Market Y-o-Y Growth (%) Projections by Product Type, 2024 to 2034
Figure 133: Jazan Province Market Value (US$ Million) Analysis by Disease Type, 2019 to 2034
Figure 134: Jazan Province Market Volume (Units) Analysis by Disease Type, 2019 to 2034
Figure 135: Jazan Province Market Value Share (%) and BPS Analysis by Disease Type, 2024 to 2034
Figure 136: Jazan Province Market Y-o-Y Growth (%) Projections by Disease Type, 2024 to 2034
Figure 137: Jazan Province Market Value (US$ Million) Analysis by Distribution Channel, 2019 to 2034
Figure 138: Jazan Province Market Volume (Units) Analysis by Distribution Channel, 2019 to 2034
Figure 139: Jazan Province Market Value Share (%) and BPS Analysis by Distribution Channel, 2024 to 2034
Figure 140: Jazan Province Market Y-o-Y Growth (%) Projections by Distribution Channel, 2024 to 2034
Figure 141: Jazan Province Market Attractiveness by Product Type, 2024 to 2034
Figure 142: Jazan Province Market Attractiveness by Disease Type, 2024 to 2034
Figure 143: Jazan Province Market Attractiveness by Distribution Channel, 2024 to 2034
Figure 144: Jazan Province Market Attractiveness by Region, 2024 to 2034
Figure 145: Asir Province Market Value (US$ Million) by Product Type, 2024 to 2034
Figure 146: Asir Province Market Value (US$ Million) by Disease Type, 2024 to 2034
Figure 147: Asir Province Market Value (US$ Million) by Distribution Channel, 2024 to 2034
Figure 148: Asir Province Market Value (US$ Million) by Region, 2024 to 2034
Figure 149: Asir Province Market Value (US$ Million) Analysis by Region, 2019 to 2034
Figure 150: Asir Province Market Volume (Units) Analysis by Region, 2019 to 2034
Figure 151: Asir Province Market Value Share (%) and BPS Analysis by Region, 2024 to 2034
Figure 152: Asir Province Market Y-o-Y Growth (%) Projections by Region, 2024 to 2034
Figure 153: Asir Province Market Value (US$ Million) Analysis by Product Type, 2019 to 2034
Figure 154: Asir Province Market Volume (Units) Analysis by Product Type, 2019 to 2034
Figure 155: Asir Province Market Value Share (%) and BPS Analysis by Product Type, 2024 to 2034
Figure 156: Asir Province Market Y-o-Y Growth (%) Projections by Product Type, 2024 to 2034
Figure 157: Asir Province Market Value (US$ Million) Analysis by Disease Type, 2019 to 2034
Figure 158: Asir Province Market Volume (Units) Analysis by Disease Type, 2019 to 2034
Figure 159: Asir Province Market Value Share (%) and BPS Analysis by Disease Type, 2024 to 2034
Figure 160: Asir Province Market Y-o-Y Growth (%) Projections by Disease Type, 2024 to 2034
Figure 161: Asir Province Market Value (US$ Million) Analysis by Distribution Channel, 2019 to 2034
Figure 162: Asir Province Market Volume (Units) Analysis by Distribution Channel, 2019 to 2034
Figure 163: Asir Province Market Value Share (%) and BPS Analysis by Distribution Channel, 2024 to 2034
Figure 164: Asir Province Market Y-o-Y Growth (%) Projections by Distribution Channel, 2024 to 2034
Figure 165: Asir Province Market Attractiveness by Product Type, 2024 to 2034
Figure 166: Asir Province Market Attractiveness by Disease Type, 2024 to 2034
Figure 167: Asir Province Market Attractiveness by Distribution Channel, 2024 to 2034
Figure 168: Asir Province Market Attractiveness by Region, 2024 to 2034
Figure 169: Rest of Market Value (US$ Million) by Product Type, 2024 to 2034
Figure 170: Rest of Market Value (US$ Million) by Disease Type, 2024 to 2034
Figure 171: Rest of Market Value (US$ Million) by Distribution Channel, 2024 to 2034
Figure 172: Rest of Market Value (US$ Million) by Region, 2024 to 2034
Figure 173: Rest of Market Value (US$ Million) Analysis by Region, 2019 to 2034
Figure 174: Rest of Market Volume (Units) Analysis by Region, 2019 to 2034
Figure 175: Rest of Market Value Share (%) and BPS Analysis by Region, 2024 to 2034
Figure 176: Rest of Market Y-o-Y Growth (%) Projections by Region, 2024 to 2034
Figure 177: Rest of Market Value (US$ Million) Analysis by Product Type, 2019 to 2034
Figure 178: Rest of Market Volume (Units) Analysis by Product Type, 2019 to 2034
Figure 179: Rest of Market Value Share (%) and BPS Analysis by Product Type, 2024 to 2034
Figure 180: Rest of Market Y-o-Y Growth (%) Projections by Product Type, 2024 to 2034
Figure 181: Rest of Market Value (US$ Million) Analysis by Disease Type, 2019 to 2034
Figure 182: Rest of Market Volume (Units) Analysis by Disease Type, 2019 to 2034
Figure 183: Rest of Market Value Share (%) and BPS Analysis by Disease Type, 2024 to 2034
Figure 184: Rest of Market Y-o-Y Growth (%) Projections by Disease Type, 2024 to 2034
Figure 185: Rest of Market Value (US$ Million) Analysis by Distribution Channel, 2019 to 2034
Figure 186: Rest of Market Volume (Units) Analysis by Distribution Channel, 2019 to 2034
Figure 187: Rest of Market Value Share (%) and BPS Analysis by Distribution Channel, 2024 to 2034
Figure 188: Rest of Market Y-o-Y Growth (%) Projections by Distribution Channel, 2024 to 2034
Figure 189: Rest of Market Attractiveness by Product Type, 2024 to 2034
Figure 190: Rest of Market Attractiveness by Disease Type, 2024 to 2034
Figure 191: Rest of Market Attractiveness by Distribution Channel, 2024 to 2034
Figure 192: Rest of Market Attractiveness by Region, 2024 to 2034
The expected CAGR until 2034 stands at 5.20%.
Anticipated demand for pharmaceuticals in Saudi Arabia is projected to reach USD 16,789.6 million by 2034.
The rising prevalence of chronic diseases highly influences demand in Saudi Arabia.
Pharmaceutical manufacturers emphasize continuous innovation in product offerings.
Branded drugs are highly popular in Saudi Arabia.
Explore Similar Insights
Thank you!
You will receive an email from our Business Development Manager. Please be sure to check your SPAM/JUNK folder too.