Reports

- Global Locations -

Headquarters

Future Market Insights, Inc.

Christiana Corporate, 200
Continental Drive, Suite 401,
Newark, Delaware - 19713,
United States

T: +1-845-579-5705

Americas

Future Market Insights, Inc.

616 Corporate Way, Suite 2-9018,
Valley Cottage, NY 10989, United States

T: +1-347-918-3531

MEA

Future Market Insights

1602-6 Jumeirah Bay X2 Tower, Plot No: JLT-PH2-X2A,
Jumeirah Lakes Towers, Dubai,
United Arab Emirates

Europe

Future Market Insights

3rd Floor, 207 Regent Street,
W1B 3HH London
United Kingdom

T: + 44 (0) 20 8123 9659
D: +44 (0) 20 3287 4268

Asia Pacific

Future Market Insights

IndiaLand Global Tech Park, Unit UG-1, Behind Grand HighStreet, Phase 1, Hinjawadi, MH, Pune – 411057, India

Pharmaceutical Vials Market Outlook

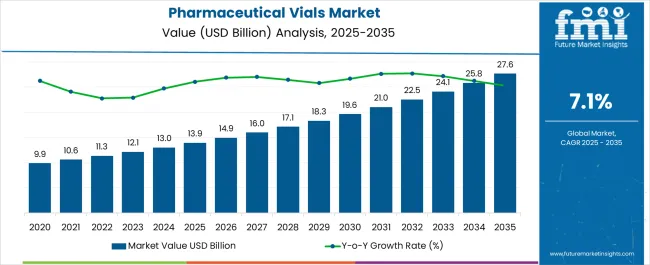
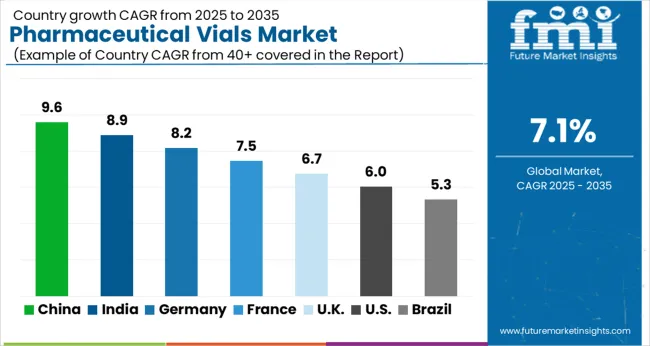
The global pharmaceutical vials market is expected to be valued at US$ 12,137.2 million in 2023 and reach a valuation of US$ 24,099.7 million by 2033. The demand for pharmaceutical vials is estimated to grow at a steady 7.10% CAGR, with the United Kingdom, the USA, China, and India emerging as key producers.

The market for pharmaceutical vials has seen increased demand as a result of the rise in requirements for pharmaceutical products. Advances in pharmaceutical packaging have accelerated the adoption of environmentally friendly materials. One class of materials that has gained popularity is Type I molded glass vials, largely because of their exceptional chemical makeup.

Numerous significant developments in the healthcare sector are creating new demand potential for pharmaceutical vials. The popularity of pharmaceutical vials has also been boosted by healthcare professionals and care takers' emphasis on making sure that patients take the right dosage of medication. The market for manufacturers in the biotechnology and pharmaceutical sectors has benefited from the demand for new formulations for chronic diseases in hospitalized patients.

Vials and ampoules are expected to grow, primarily due to increased consumption from emerging markets like China and India, as a result of the complexity of drugs and the rise in diseases like diabetes. About 422 million people worldwide have diabetes, according to the World Health Organization (WHO). Additionally, the use of glass vials is anticipated to increase over the forecast period as a result of factors like the rise in medical care costs caused by improper medication consumption and the growing propensity of different end-users, including hospitals and drug manufacturers.

During the coronavirus outbreak, market vendors tried their best to assist as much as they could. For example, Corning provided its products, such as glass tubing for diagnostic test kits and vials for vaccine clinical drug trials, to provide corning valor glass packaging and fill the gap for the anticipated drug shortages. Additionally, the business added glass packaging and any consumable requirements from its Life Sciences portfolio for vaccine process development.

Attributes Details
Pharmaceutical Vials Market CAGR (2023 to 2033) 7.10%
Pharmaceutical Vials Market Size (2023) US$ 12137.2 million
Pharmaceutical Vials Market Size (2033) US$ 24,099.7 million

Don't pay for what you don't need

Customize your report by selecting specific countries or regions and save 30%!

2016 to 2020 Pharmaceutical Vials Market Outlook in Comparison to 2023 to 2033 Forecasts

Increasing demand for parenteral drugs has been a key factor enabling the expansion of the pharmaceutical vials market in recent years. Between 2016 and 2020, the market grew at around 8% CAGR, says Future Market Insights (FMI) in its recent report.

Particulars Details
Jan-Jun (H1), 2021 (A) 7.50%
Jan-Jun (H1), 2022 Projected (P) 7.30%
Jan-Jun (H1), 2022 Outlook (O) 7.70%
BPS: H1,2022 (O) - H1,2022 (P) 20
BPS: H1,2022 (O) - H1,2021 (P) 40

Short-term growth (2023 to 2026): National Cancer Institute reports that in 2020, around 1.8 million new cancer cases were diagnosed in the USA. Rise of new cancer cases across the globe has further elevated the demand for pharmaceutical vials, especially for chemotherapy drugs.

In June 2021, Zydus Cadila Healthcare received tentative approval from the USA Food and Drug Administration (FDA) to market and sell pemetrexed in 100mg/vial, 500 mg/vial, and 1000 mg/vial, and single-dose vials for injection. Pemetrexed is a chemotherapy drug and is found effective in slowing or stopping the growth of cancer cells.

Medium-term growth (2027 to 2030): Unprecedented outbreak of the COVID-19 pandemic has increased the demand for parenteral drugs, encouraging market players to develop new pharmaceutical vials that are safe, sterile, and remain contamination free before administration. This is expected to create lucrative growth opportunities for the market.

Responding to the high demand for COVID-19 parenteral drugs, in 2021, SGD Pharma launched its new ready-to-use 20ml EasyLyo molded glass Type I vials packed in its modern secondary packaging format called “SG EZ-fill® Nest & Tub.”

The company claims that this new primary and secondary packaging combination is likely to offer biopharmaceutical producers the necessary flexibility in terms of delivering innovative medicines to patients at a faster rate.

Long-term growth (2031 to 2033): Increasing vaccination drives and high demand for parenteral drugs like insulin and corticosteroids are expected to drive the demand for pharmaceutical vials globally in the forthcoming decade.

Pharmaceutical Vials Market Analysis

Pharmaceutical vials are a type of small containers that are used for the purpose of storing liquid medications. They are made up of plastic or glass and are mainly used for unit dose packaging of medications. Pharmaceutical vials also help patients in consuming their medications in the right dosage and at the right time.

Ever since the last few decades, low medical adherence by patients has posed a critical situation for the healthcare industry as it involves the safety of the patients and causes increased healthcare spending.

To solve these issues, the healthcare industry is making constant efforts to improve the intake of medications by patients and ensure that the patients take the right dosage of drugs at the right time. In this process, the packaging of drugs and various medicines plays an important part.

Particularly in the United States, it has been reported that around 50 percent of the prescribed medications are taken incorrectly by patients. In addition, in an independent study, it was found that since patients don’t take their medications in the right manner, there are increased medical costs to the tune of US$ 200 billion.

Due to this situation, there is a demand created for such kind of pharmaceutical products that contain medications in such form that can be easily taken by the patients. This helps the patients to take the right dosage of medicines at the correct time, thus reducing their time of recovery and reducing the burden on the healthcare system as well.
Ismail Sutaria
Ismail Sutaria

Principal Consultant

Talk to Analyst

Find your sweet spots for generating winning opportunities in this market.

Comparative View of Pharmaceutical Vials Market

Pharmaceutical Vials Market:

Attributes Pharmaceutical Vials Market
CAGR (2023 to 2033) 7.10%
Market Value (2033) US$ 24,099.7 million
Growth Factor Growing demand for injectable drugs
Opportunity Advancements in vial technology
Restraint High cost of production

Vials and Ampoules Market:

Attributes Vials and Ampoules Market
CAGR (2023 to 2033) 10.5%
Market Value (2033) US$ 21.97 billion
Growth Factor Increasing demand for biologics and biosimilars
Opportunity The growing demand for vials and ampoules in emerging markets such as Asia and Latin America is creating new opportunities for manufacturers to expand their reach.
Restraint The use of plastic vials and ampoules is a concern for the environment.

Pharmaceutical Packaging Market:

Attributes Pharmaceutical Packaging Market
CAGR (2023 to 2033) 7.50%
Market Value (2033) US$ 206.6 billion
Growth Factor Growing emphasis on patient safety and compliance
Opportunity Increasing demand for eco-friendly packaging
Restraint Stringent regulatory requirements

Country-wise Insights

What are the factors contributing to the growth of the Pharmaceutical Vials market in the United States?

The demand for injectable drugs is growing due to the increasing prevalence of chronic diseases such as cancer and diabetes. As vials are a popular choice for packaging and delivering injectable drugs, this is driving the demand for pharmaceutical vials in the USA market.
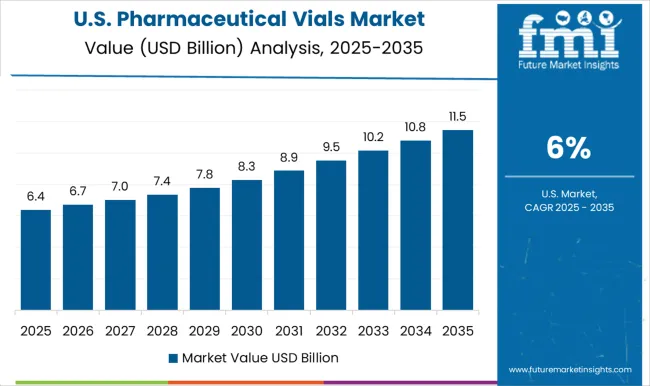
There is a growing emphasis on safety and compliance in the pharmaceutical industry, driven by regulatory requirements, as well as the desire to reduce medication errors and improve patient outcomes. This is driving the demand for high-quality pharmaceutical vials that can ensure the safe and accurate delivery of medications.

Technological advancements in the production of vials, such as the use of automation and robotics, are creating new opportunities for manufacturers to produce high-quality vials at a faster rate while reducing costs. The trend toward personalized medicine is driving the demand for customized vials that can accommodate specific dosages and delivery requirements.

Overall, these factors are contributing to the growth of the pharmaceutical vials market in the United States and are expected to continue to do so in the coming years.

Why China is Considered an Attractive Pharmaceutical Vials Market?

China is the second-largest market for pharmaceuticals globally, and it is expected to expand significantly in the upcoming years. The rising demand for medications in China is leading to an increased requirement for pharmaceutical packaging, which includes vials. There is a growing need for superior quality packaging products, including vials, as the Chinese pharmaceutical sector is developing and becoming more mature. This is because it is essential to guarantee that medications are safe and effective, and that they meet regulatory requirements.

The Chinese government has implemented policies to promote the growth of the pharmaceutical industry, such as offering tax incentives and making regulatory procedures efficient. As a result, this is making it easier for manufacturers of pharmaceutical packaging, including vials, to operate in a more favorable environment. China's middle class is expanding, which is driving the demand for high-quality healthcare products, including medicines and packaging. This presents an opportunity for manufacturers of pharmaceutical vials to offer premium and valuable products.

Is India poised to become a lucrative market?

The pharmaceutical vials market is expected to continue to offer lucrative opportunities, and Asia Pacific is expected to play a significant role in their expansion. Outstanding developments in the pharmaceutical manufacturing sector in emerging economies, particularly India, have prodded businesses to extend their supply chains there. Over the years, the expansion of hospitals and pharmaceutical companies in those economies has increased the regional market's potential for revenue.

India is a desirable market for pharmaceutical packaging manufacturers seeking to cut costs while maintaining high standards because it has historically had lower labor and production costs than other nations. The demand for pharmaceutical packaging, including vials, is anticipated to increase further as a result of India's expanding pharmaceutical export market, opening up new business opportunities for suppliers.

Get the data you need at a Fraction of the cost

Personalize your report by choosing insights you need
and save 40%!

Category Insights

Plastics to Remain Preferred Material Type

The plastic sub-segment in the material type category is anticipated to grow at a robust growth rate and register a CAGR of 5.1% during the period of assessment. This is a highly lucrative segment in the material type category.

As per the projections of Future Market Insights, the plastic sub-segment is estimated to touch a value of nearly US$ 7,700 million at the end of the year 2021 and is expected to touch a value of nearly US$ 12,000 million at the end of the year 2031.

Demand for Glass Pharmaceutical Vials to Surge

The glass sub-segment is trailing the plastic sub-segment in the material type category and is projected to register a CAGR of 3.8% during the period of assessment.

The glass sub-segment is estimated to be valued at nearly US$ 2,450 million in the year 2021 and is expected to touch a value of nearly US$ 3,400 million at the end of the period of assessment in the year 2031.

Competitive Landscape

As a result of the concentration of numerous pharmaceutical glass manufacturing businesses in developed regions like Europe and North America, these areas have well-established supply chains and production systems. The low labor costs and expanding opportunities offered by these nations, however, are causing manufacturers to relocate their headquarters to nations like Brazil, India, and China. In these nations, the demand for pharmaceutical glass packaging is anticipated to be driven primarily by the generic sector over the forecast period.

For instance, Gennova Biopharmaceuticals, a subsidiary of Indian pharmaceutical company Emcure Pharmaceuticals, began producing the Covid-19 vaccine in February 2022. This vaccine uses mRNA technology to target the Omicron variant. The business intends to request permission from the Drug Controller General of India (DCGI) for the clinical trials of the mRNA vaccine booster shot.

Top Companies in the Pharmaceutical Vials Market

Gerresheimer AG: A global manufacturer of pharmaceutical packaging and drug delivery devices, including vials made of glass and plastic. They offer a variety of services, including design, development, and manufacturing.

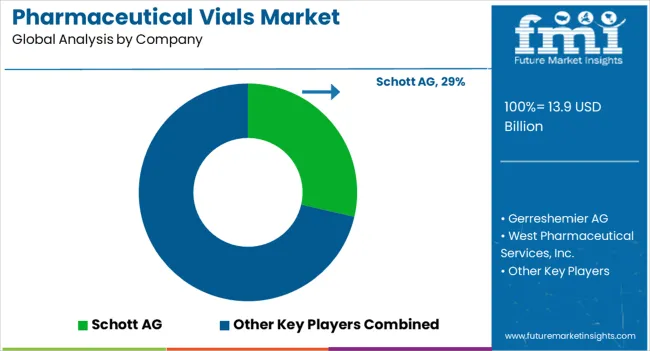
Schott AG: Another global company that produces high-quality glass packaging for pharmaceuticals, including vials. They also offer services such as quality control, testing, and customization.

DWK Life Sciences Inc.: A leading manufacturer of laboratory glassware and packaging products, including vials for the pharmaceutical industry. They offer a range of materials, such as glass, plastic, and hybrid vials.

Berry Global Inc.: A key player in the plastic packaging industry, including the production of vials for pharmaceuticals. They offer a range of plastic vials, including those made of PET, PVC, and HDPE.

SGD Pharma: A European company specializing in the production of glass packaging for pharmaceuticals, including vials. They offer various types of vials made of glass, including molded and tubular vials.

Key Segments Covered in Pharmaceutical Vials Market Study

By Product Type:

  • Self-Standing
  • Round Bottom

By Material Type:

  • Glass
  • Plastic

By Capacity Size:

  • 0-1ml
  • 1-10ml
  • 10-50ml
  • 50-100ml

By Region:

  • North America
  • Latin America
  • Europe
  • Asia Pacific Excluding Japan
  • Japan
  • Middle East & Africa (MEA)

Frequently Asked Questions

How Big is the Pharmaceutical Vials Market?

The pharmaceutical vials market is slated to attain US$ 12,137.2 million in 2023.

What is the Growth Potential of the Pharmaceutical Vials Market?

The growth potential of the pharmaceutical vials market is 7.1% CAGR through 2033.

Which Factors are Propelling the Market Forward?

Surging demand for injectable drugs and increasing innovation in vial technology.

Who are the Top Market Players?

Gerresheimer AG, Schott AG, and SGD Pharma are the top market players.

Which Strategies are Consolidating Manufacturers’ Place?

Mergers and acquisitions are key strategies consolidating the key players’ position.

Table of Content

1. Executive Summary | Pharmaceutical Vials Market

    1.1. Global Market Outlook

    1.2. Demand-side Trends

    1.3. Supply-side Trends

    1.4. Technology Roadmap Analysis

    1.5. Analysis and Recommendations

2. Market Overview

    2.1. Market Coverage / Taxonomy

    2.2. Market Definition / Scope / Limitations

3. Market Background

    3.1. Market Dynamics

        3.1.1. Drivers

        3.1.2. Restraints

        3.1.3. Opportunity

        3.1.4. Trends

    3.2. Scenario Forecast

        3.2.1. Demand in Optimistic Scenario

        3.2.2. Demand in Likely Scenario

        3.2.3. Demand in Conservative Scenario

    3.3. Opportunity Map Analysis

    3.4. Product Life Cycle Analysis

    3.5. Supply Chain Analysis

        3.5.1. Supply Side Participants and their Roles

            3.5.1.1. Producers

            3.5.1.2. Mid-Level Participants (Traders/ Agents/ Brokers)

            3.5.1.3. Wholesalers and Distributors

        3.5.2. Value Added and Value Created at Node in the Supply Chain

        3.5.3. List of Raw Material Suppliers

        3.5.4. List of Existing and Potential Buyer’s

    3.6. Investment Feasibility Matrix

    3.7. Value Chain Analysis

        3.7.1. Profit Margin Analysis

        3.7.2. Wholesalers and Distributors

        3.7.3. Retailers

    3.8. PESTLE and Porter’s Analysis

    3.9. Regulatory Landscape

        3.9.1. By Key Regions

        3.9.2. By Key Countries

    3.10. Regional Parent Market Outlook

    3.11. Production and Consumption Statistics

    3.12. Import and Export Statistics

4. Global Market Analysis 2018 to 2022 and Forecast, 2023 to 2033

    4.1. Historical Market Size Value (US$ Million) & Volume (Units) Analysis, 2018 to 2022

    4.2. Current and Future Market Size Value (US$ Million) & Volume (Units) Projections, 2023 to 2033

        4.2.1. Y-o-Y Growth Trend Analysis

        4.2.2. Absolute $ Opportunity Analysis

5. Global Market Analysis 2018 to 2022 and Forecast 2023 to 2033, By Product Type

    5.1. Introduction / Key Findings

    5.2. Historical Market Size Value (US$ Million) & Volume (Units) Analysis By Product Type, 2018 to 2022

    5.3. Current and Future Market Size Value (US$ Million) & Volume (Units) Analysis and Forecast By Product Type, 2023 to 2033

        5.3.1. Self-Standing

        5.3.2. Round Bottom

    5.4. Y-o-Y Growth Trend Analysis By Product Type, 2018 to 2022

    5.5. Absolute $ Opportunity Analysis By Product Type, 2023 to 2033

6. Global Market Analysis 2018 to 2022 and Forecast 2023 to 2033, By Material Type

    6.1. Introduction / Key Findings

    6.2. Historical Market Size Value (US$ Million) & Volume (Units) Analysis By Material Type, 2018 to 2022

    6.3. Current and Future Market Size Value (US$ Million) & Volume (Units) Analysis and Forecast By Material Type, 2023 to 2033

        6.3.1. Glass

        6.3.2. Plastic

    6.4. Y-o-Y Growth Trend Analysis By Material Type, 2018 to 2022

    6.5. Absolute $ Opportunity Analysis By Material Type, 2023 to 2033

7. Global Market Analysis 2018 to 2022 and Forecast 2023 to 2033, By Capacity Size

    7.1. Introduction / Key Findings

    7.2. Historical Market Size Value (US$ Million) & Volume (Units) Analysis By Capacity Size, 2018 to 2022

    7.3. Current and Future Market Size Value (US$ Million) & Volume (Units) Analysis and Forecast By Capacity Size, 2023 to 2033

        7.3.1. 0-1ml

        7.3.2. 1-10ml

        7.3.3. 10-50ml

        7.3.4. 50-100ml

    7.4. Y-o-Y Growth Trend Analysis By Capacity Size, 2018 to 2022

    7.5. Absolute $ Opportunity Analysis By Capacity Size, 2023 to 2033

8. Global Market Analysis 2018 to 2022 and Forecast 2023 to 2033, By Region

    8.1. Introduction

    8.2. Historical Market Size Value (US$ Million) & Volume (Units) Analysis By Region, 2018 to 2022

    8.3. Current Market Size Value (US$ Million) & Volume (Units) Analysis and Forecast By Region, 2023 to 2033

        8.3.1. North America

        8.3.2. Latin America

        8.3.3. Europe

        8.3.4. Asia Pacific

        8.3.5. MEA

    8.4. Market Attractiveness Analysis By Region

9. North America Market Analysis 2018 to 2022 and Forecast 2023 to 2033, By Country

    9.1. Historical Market Size Value (US$ Million) & Volume (Units) Trend Analysis By Market Taxonomy, 2018 to 2022

    9.2. Market Size Value (US$ Million) & Volume (Units) Forecast By Market Taxonomy, 2023 to 2033

        9.2.1. By Country

            9.2.1.1. The USA

            9.2.1.2. Canada

        9.2.2. By Product Type

        9.2.3. By Material Type

        9.2.4. By Capacity Size

    9.3. Market Attractiveness Analysis

        9.3.1. By Country

        9.3.2. By Product Type

        9.3.3. By Material Type

        9.3.4. By Capacity Size

    9.4. Key Takeaways

10. Latin America Market Analysis 2018 to 2022 and Forecast 2023 to 2033, By Country

    10.1. Historical Market Size Value (US$ Million) & Volume (Units) Trend Analysis By Market Taxonomy, 2018 to 2022

    10.2. Market Size Value (US$ Million) & Volume (Units) Forecast By Market Taxonomy, 2023 to 2033

        10.2.1. By Country

            10.2.1.1. Brazil

            10.2.1.2. Mexico

            10.2.1.3. Rest of Latin America

        10.2.2. By Product Type

        10.2.3. By Material Type

        10.2.4. By Capacity Size

    10.3. Market Attractiveness Analysis

        10.3.1. By Country

        10.3.2. By Product Type

        10.3.3. By Material Type

        10.3.4. By Capacity Size

    10.4. Key Takeaways

11. Europe Market Analysis 2018 to 2022 and Forecast 2023 to 2033, By Country

    11.1. Historical Market Size Value (US$ Million) & Volume (Units) Trend Analysis By Market Taxonomy, 2018 to 2022

    11.2. Market Size Value (US$ Million) & Volume (Units) Forecast By Market Taxonomy, 2023 to 2033

        11.2.1. By Country

            11.2.1.1. Germany

            11.2.1.2. United Kingdom

            11.2.1.3. France

            11.2.1.4. Spain

            11.2.1.5. Italy

            11.2.1.6. Rest of Europe

        11.2.2. By Product Type

        11.2.3. By Material Type

        11.2.4. By Capacity Size

    11.3. Market Attractiveness Analysis

        11.3.1. By Country

        11.3.2. By Product Type

        11.3.3. By Material Type

        11.3.4. By Capacity Size

    11.4. Key Takeaways

12. Asia Pacific Market Analysis 2018 to 2022 and Forecast 2023 to 2033, By Country

    12.1. Historical Market Size Value (US$ Million) & Volume (Units) Trend Analysis By Market Taxonomy, 2018 to 2022

    12.2. Market Size Value (US$ Million) & Volume (Units) Forecast By Market Taxonomy, 2023 to 2033

        12.2.1. By Country

            12.2.1.1. China

            12.2.1.2. Japan

            12.2.1.3. South Korea

            12.2.1.4. Singapore

            12.2.1.5. Thailand

            12.2.1.6. Indonesia

            12.2.1.7. Australia

            12.2.1.8. New Zealand

            12.2.1.9. Rest of Asia Pacific

        12.2.2. By Product Type

        12.2.3. By Material Type

        12.2.4. By Capacity Size

    12.3. Market Attractiveness Analysis

        12.3.1. By Country

        12.3.2. By Product Type

        12.3.3. By Material Type

        12.3.4. By Capacity Size

    12.4. Key Takeaways

13. MEA Market Analysis 2018 to 2022 and Forecast 2023 to 2033, By Country

    13.1. Historical Market Size Value (US$ Million) & Volume (Units) Trend Analysis By Market Taxonomy, 2018 to 2022

    13.2. Market Size Value (US$ Million) & Volume (Units) Forecast By Market Taxonomy, 2023 to 2033

        13.2.1. By Country

            13.2.1.1. GCC Countries

            13.2.1.2. South Africa

            13.2.1.3. Israel

            13.2.1.4. Rest of MEA

        13.2.2. By Product Type

        13.2.3. By Material Type

        13.2.4. By Capacity Size

    13.3. Market Attractiveness Analysis

        13.3.1. By Country

        13.3.2. By Product Type

        13.3.3. By Material Type

        13.3.4. By Capacity Size

    13.4. Key Takeaways

14. Key Countries Market Analysis

    14.1. USA

        14.1.1. Pricing Analysis

        14.1.2. Market Share Analysis, 2022

            14.1.2.1. By Product Type

            14.1.2.2. By Material Type

            14.1.2.3. By Capacity Size

    14.2. Canada

        14.2.1. Pricing Analysis

        14.2.2. Market Share Analysis, 2022

            14.2.2.1. By Product Type

            14.2.2.2. By Material Type

            14.2.2.3. By Capacity Size

    14.3. Brazil

        14.3.1. Pricing Analysis

        14.3.2. Market Share Analysis, 2022

            14.3.2.1. By Product Type

            14.3.2.2. By Material Type

            14.3.2.3. By Capacity Size

    14.4. Mexico

        14.4.1. Pricing Analysis

        14.4.2. Market Share Analysis, 2022

            14.4.2.1. By Product Type

            14.4.2.2. By Material Type

            14.4.2.3. By Capacity Size

    14.5. Germany

        14.5.1. Pricing Analysis

        14.5.2. Market Share Analysis, 2022

            14.5.2.1. By Product Type

            14.5.2.2. By Material Type

            14.5.2.3. By Capacity Size

    14.6. United Kingdom

        14.6.1. Pricing Analysis

        14.6.2. Market Share Analysis, 2022

            14.6.2.1. By Product Type

            14.6.2.2. By Material Type

            14.6.2.3. By Capacity Size

    14.7. France

        14.7.1. Pricing Analysis

        14.7.2. Market Share Analysis, 2022

            14.7.2.1. By Product Type

            14.7.2.2. By Material Type

            14.7.2.3. By Capacity Size

    14.8. Spain

        14.8.1. Pricing Analysis

        14.8.2. Market Share Analysis, 2022

            14.8.2.1. By Product Type

            14.8.2.2. By Material Type

            14.8.2.3. By Capacity Size

    14.9. Italy

        14.9.1. Pricing Analysis

        14.9.2. Market Share Analysis, 2022

            14.9.2.1. By Product Type

            14.9.2.2. By Material Type

            14.9.2.3. By Capacity Size

    14.10. China

        14.10.1. Pricing Analysis

        14.10.2. Market Share Analysis, 2022

            14.10.2.1. By Product Type

            14.10.2.2. By Material Type

            14.10.2.3. By Capacity Size

    14.11. Japan

        14.11.1. Pricing Analysis

        14.11.2. Market Share Analysis, 2022

            14.11.2.1. By Product Type

            14.11.2.2. By Material Type

            14.11.2.3. By Capacity Size

    14.12. South Korea

        14.12.1. Pricing Analysis

        14.12.2. Market Share Analysis, 2022

            14.12.2.1. By Product Type

            14.12.2.2. By Material Type

            14.12.2.3. By Capacity Size

    14.13. Singapore

        14.13.1. Pricing Analysis

        14.13.2. Market Share Analysis, 2022

            14.13.2.1. By Product Type

            14.13.2.2. By Material Type

            14.13.2.3. By Capacity Size

    14.14. Thailand

        14.14.1. Pricing Analysis

        14.14.2. Market Share Analysis, 2022

            14.14.2.1. By Product Type

            14.14.2.2. By Material Type

            14.14.2.3. By Capacity Size

    14.15. Indonesia

        14.15.1. Pricing Analysis

        14.15.2. Market Share Analysis, 2022

            14.15.2.1. By Product Type

            14.15.2.2. By Material Type

            14.15.2.3. By Capacity Size

    14.16. Australia

        14.16.1. Pricing Analysis

        14.16.2. Market Share Analysis, 2022

            14.16.2.1. By Product Type

            14.16.2.2. By Material Type

            14.16.2.3. By Capacity Size

    14.17. New Zealand

        14.17.1. Pricing Analysis

        14.17.2. Market Share Analysis, 2022

            14.17.2.1. By Product Type

            14.17.2.2. By Material Type

            14.17.2.3. By Capacity Size

    14.18. GCC Countries

        14.18.1. Pricing Analysis

        14.18.2. Market Share Analysis, 2022

            14.18.2.1. By Product Type

            14.18.2.2. By Material Type

            14.18.2.3. By Capacity Size

    14.19. South Africa

        14.19.1. Pricing Analysis

        14.19.2. Market Share Analysis, 2022

            14.19.2.1. By Product Type

            14.19.2.2. By Material Type

            14.19.2.3. By Capacity Size

    14.20. Israel

        14.20.1. Pricing Analysis

        14.20.2. Market Share Analysis, 2022

            14.20.2.1. By Product Type

            14.20.2.2. By Material Type

            14.20.2.3. By Capacity Size

15. Market Structure Analysis

    15.1. Competition Dashboard

    15.2. Competition Benchmarking

    15.3. Market Share Analysis of Top Players

        15.3.1. By Regional

        15.3.2. By Product Type

        15.3.3. By Material Type

        15.3.4. By Capacity Size

16. Competition Analysis

    16.1. Competition Deep Dive

        16.1.1. Schott AG

            16.1.1.1. Overview

            16.1.1.2. Product Portfolio

            16.1.1.3. Profitability by Market Segments

            16.1.1.4. Sales Footprint

            16.1.1.5. Strategy Overview

                16.1.1.5.1. Marketing Strategy

                16.1.1.5.2. Product Strategy

                16.1.1.5.3. Channel Strategy

        16.1.2. Gerreshemier AG

            16.1.2.1. Overview

            16.1.2.2. Product Portfolio

            16.1.2.3. Profitability by Market Segments

            16.1.2.4. Sales Footprint

            16.1.2.5. Strategy Overview

                16.1.2.5.1. Marketing Strategy

                16.1.2.5.2. Product Strategy

                16.1.2.5.3. Channel Strategy

        16.1.3. West Pharmaceutical Services, Inc.

            16.1.3.1. Overview

            16.1.3.2. Product Portfolio

            16.1.3.3. Profitability by Market Segments

            16.1.3.4. Sales Footprint

            16.1.3.5. Strategy Overview

                16.1.3.5.1. Marketing Strategy

                16.1.3.5.2. Product Strategy

                16.1.3.5.3. Channel Strategy

        16.1.4. O.BERK COMPANY, LLC

            16.1.4.1. Overview

            16.1.4.2. Product Portfolio

            16.1.4.3. Profitability by Market Segments

            16.1.4.4. Sales Footprint

            16.1.4.5. Strategy Overview

                16.1.4.5.1. Marketing Strategy

                16.1.4.5.2. Product Strategy

                16.1.4.5.3. Channel Strategy

        16.1.5. Adelphi Healthcare Packaging

            16.1.5.1. Overview

            16.1.5.2. Product Portfolio

            16.1.5.3. Profitability by Market Segments

            16.1.5.4. Sales Footprint

            16.1.5.5. Strategy Overview

                16.1.5.5.1. Marketing Strategy

                16.1.5.5.2. Product Strategy

                16.1.5.5.3. Channel Strategy

        16.1.6. Pacific Vial Manufacturing Inc.

            16.1.6.1. Overview

            16.1.6.2. Product Portfolio

            16.1.6.3. Profitability by Market Segments

            16.1.6.4. Sales Footprint

            16.1.6.5. Strategy Overview

                16.1.6.5.1. Marketing Strategy

                16.1.6.5.2. Product Strategy

                16.1.6.5.3. Channel Strategy

        16.1.7. Piramal Glass

            16.1.7.1. Overview

            16.1.7.2. Product Portfolio

            16.1.7.3. Profitability by Market Segments

            16.1.7.4. Sales Footprint

            16.1.7.5. Strategy Overview

                16.1.7.5.1. Marketing Strategy

                16.1.7.5.2. Product Strategy

                16.1.7.5.3. Channel Strategy

        16.1.8. SGD SA

            16.1.8.1. Overview

            16.1.8.2. Product Portfolio

            16.1.8.3. Profitability by Market Segments

            16.1.8.4. Sales Footprint

            16.1.8.5. Strategy Overview

                16.1.8.5.1. Marketing Strategy

                16.1.8.5.2. Product Strategy

                16.1.8.5.3. Channel Strategy

        16.1.9. Stevanato Group S.p.a

            16.1.9.1. Overview

            16.1.9.2. Product Portfolio

            16.1.9.3. Profitability by Market Segments

            16.1.9.4. Sales Footprint

            16.1.9.5. Strategy Overview

                16.1.9.5.1. Marketing Strategy

                16.1.9.5.2. Product Strategy

                16.1.9.5.3. Channel Strategy

        16.1.10. Nipro Europe

            16.1.10.1. Overview

            16.1.10.2. Product Portfolio

            16.1.10.3. Profitability by Market Segments

            16.1.10.4. Sales Footprint

            16.1.10.5. Strategy Overview

                16.1.10.5.1. Marketing Strategy

                16.1.10.5.2. Product Strategy

                16.1.10.5.3. Channel Strategy

17. Assumptions & Acronyms Used

18. Research Methodology

Don't pay for what you don't need

Customize your report by selecting specific countries or regions and save 30%!

List of Tables

Table 1: Global Market Value (US$ Million) Forecast by Region, 2018 to 2033

Table 2: Global Market Volume (Units) Forecast by Region, 2018 to 2033

Table 3: Global Market Value (US$ Million) Forecast by Product Type, 2018 to 2033

Table 4: Global Market Volume (Units) Forecast by Product Type, 2018 to 2033

Table 5: Global Market Value (US$ Million) Forecast by Material Type, 2018 to 2033

Table 6: Global Market Volume (Units) Forecast by Material Type, 2018 to 2033

Table 7: Global Market Value (US$ Million) Forecast by Capacity Size, 2018 to 2033

Table 8: Global Market Volume (Units) Forecast by Capacity Size, 2018 to 2033

Table 9: North America Market Value (US$ Million) Forecast by Country, 2018 to 2033

Table 10: North America Market Volume (Units) Forecast by Country, 2018 to 2033

Table 11: North America Market Value (US$ Million) Forecast by Product Type, 2018 to 2033

Table 12: North America Market Volume (Units) Forecast by Product Type, 2018 to 2033

Table 13: North America Market Value (US$ Million) Forecast by Material Type, 2018 to 2033

Table 14: North America Market Volume (Units) Forecast by Material Type, 2018 to 2033

Table 15: North America Market Value (US$ Million) Forecast by Capacity Size, 2018 to 2033

Table 16: North America Market Volume (Units) Forecast by Capacity Size, 2018 to 2033

Table 17: Latin America Market Value (US$ Million) Forecast by Country, 2018 to 2033

Table 18: Latin America Market Volume (Units) Forecast by Country, 2018 to 2033

Table 19: Latin America Market Value (US$ Million) Forecast by Product Type, 2018 to 2033

Table 20: Latin America Market Volume (Units) Forecast by Product Type, 2018 to 2033

Table 21: Latin America Market Value (US$ Million) Forecast by Material Type, 2018 to 2033

Table 22: Latin America Market Volume (Units) Forecast by Material Type, 2018 to 2033

Table 23: Latin America Market Value (US$ Million) Forecast by Capacity Size, 2018 to 2033

Table 24: Latin America Market Volume (Units) Forecast by Capacity Size, 2018 to 2033

Table 25: Europe Market Value (US$ Million) Forecast by Country, 2018 to 2033

Table 26: Europe Market Volume (Units) Forecast by Country, 2018 to 2033

Table 27: Europe Market Value (US$ Million) Forecast by Product Type, 2018 to 2033

Table 28: Europe Market Volume (Units) Forecast by Product Type, 2018 to 2033

Table 29: Europe Market Value (US$ Million) Forecast by Material Type, 2018 to 2033

Table 30: Europe Market Volume (Units) Forecast by Material Type, 2018 to 2033

Table 31: Europe Market Value (US$ Million) Forecast by Capacity Size, 2018 to 2033

Table 32: Europe Market Volume (Units) Forecast by Capacity Size, 2018 to 2033

Table 33: Asia Pacific Market Value (US$ Million) Forecast by Country, 2018 to 2033

Table 34: Asia Pacific Market Volume (Units) Forecast by Country, 2018 to 2033

Table 35: Asia Pacific Market Value (US$ Million) Forecast by Product Type, 2018 to 2033

Table 36: Asia Pacific Market Volume (Units) Forecast by Product Type, 2018 to 2033

Table 37: Asia Pacific Market Value (US$ Million) Forecast by Material Type, 2018 to 2033

Table 38: Asia Pacific Market Volume (Units) Forecast by Material Type, 2018 to 2033

Table 39: Asia Pacific Market Value (US$ Million) Forecast by Capacity Size, 2018 to 2033

Table 40: Asia Pacific Market Volume (Units) Forecast by Capacity Size, 2018 to 2033

Table 41: MEA Market Value (US$ Million) Forecast by Country, 2018 to 2033

Table 42: MEA Market Volume (Units) Forecast by Country, 2018 to 2033

Table 43: MEA Market Value (US$ Million) Forecast by Product Type, 2018 to 2033

Table 44: MEA Market Volume (Units) Forecast by Product Type, 2018 to 2033

Table 45: MEA Market Value (US$ Million) Forecast by Material Type, 2018 to 2033

Table 46: MEA Market Volume (Units) Forecast by Material Type, 2018 to 2033

Table 47: MEA Market Value (US$ Million) Forecast by Capacity Size, 2018 to 2033

Table 48: MEA Market Volume (Units) Forecast by Capacity Size, 2018 to 2033
Ismail Sutaria
Ismail Sutaria

Principal Consultant

Talk to Analyst

Find your sweet spots for generating winning opportunities in this market.

List of Charts

Figure 1: Global Market Value (US$ Million) by Product Type, 2023 to 2033

Figure 2: Global Market Value (US$ Million) by Material Type, 2023 to 2033

Figure 3: Global Market Value (US$ Million) by Capacity Size, 2023 to 2033

Figure 4: Global Market Value (US$ Million) by Region, 2023 to 2033

Figure 5: Global Market Value (US$ Million) Analysis by Region, 2018 to 2033

Figure 6: Global Market Volume (Units) Analysis by Region, 2018 to 2033

Figure 7: Global Market Value Share (%) and BPS Analysis by Region, 2023 to 2033

Figure 8: Global Market Y-o-Y Growth (%) Projections by Region, 2023 to 2033

Figure 9: Global Market Value (US$ Million) Analysis by Product Type, 2018 to 2033

Figure 10: Global Market Volume (Units) Analysis by Product Type, 2018 to 2033

Figure 11: Global Market Value Share (%) and BPS Analysis by Product Type, 2023 to 2033

Figure 12: Global Market Y-o-Y Growth (%) Projections by Product Type, 2023 to 2033

Figure 13: Global Market Value (US$ Million) Analysis by Material Type, 2018 to 2033

Figure 14: Global Market Volume (Units) Analysis by Material Type, 2018 to 2033

Figure 15: Global Market Value Share (%) and BPS Analysis by Material Type, 2023 to 2033

Figure 16: Global Market Y-o-Y Growth (%) Projections by Material Type, 2023 to 2033

Figure 17: Global Market Value (US$ Million) Analysis by Capacity Size, 2018 to 2033

Figure 18: Global Market Volume (Units) Analysis by Capacity Size, 2018 to 2033

Figure 19: Global Market Value Share (%) and BPS Analysis by Capacity Size, 2023 to 2033

Figure 20: Global Market Y-o-Y Growth (%) Projections by Capacity Size, 2023 to 2033

Figure 21: Global Market Attractiveness by Product Type, 2023 to 2033

Figure 22: Global Market Attractiveness by Material Type, 2023 to 2033

Figure 23: Global Market Attractiveness by Capacity Size, 2023 to 2033

Figure 24: Global Market Attractiveness by Region, 2023 to 2033

Figure 25: North America Market Value (US$ Million) by Product Type, 2023 to 2033

Figure 26: North America Market Value (US$ Million) by Material Type, 2023 to 2033

Figure 27: North America Market Value (US$ Million) by Capacity Size, 2023 to 2033

Figure 28: North America Market Value (US$ Million) by Country, 2023 to 2033

Figure 29: North America Market Value (US$ Million) Analysis by Country, 2018 to 2033

Figure 30: North America Market Volume (Units) Analysis by Country, 2018 to 2033

Figure 31: North America Market Value Share (%) and BPS Analysis by Country, 2023 to 2033

Figure 32: North America Market Y-o-Y Growth (%) Projections by Country, 2023 to 2033

Figure 33: North America Market Value (US$ Million) Analysis by Product Type, 2018 to 2033

Figure 34: North America Market Volume (Units) Analysis by Product Type, 2018 to 2033

Figure 35: North America Market Value Share (%) and BPS Analysis by Product Type, 2023 to 2033

Figure 36: North America Market Y-o-Y Growth (%) Projections by Product Type, 2023 to 2033

Figure 37: North America Market Value (US$ Million) Analysis by Material Type, 2018 to 2033

Figure 38: North America Market Volume (Units) Analysis by Material Type, 2018 to 2033

Figure 39: North America Market Value Share (%) and BPS Analysis by Material Type, 2023 to 2033

Figure 40: North America Market Y-o-Y Growth (%) Projections by Material Type, 2023 to 2033

Figure 41: North America Market Value (US$ Million) Analysis by Capacity Size, 2018 to 2033

Figure 42: North America Market Volume (Units) Analysis by Capacity Size, 2018 to 2033

Figure 43: North America Market Value Share (%) and BPS Analysis by Capacity Size, 2023 to 2033

Figure 44: North America Market Y-o-Y Growth (%) Projections by Capacity Size, 2023 to 2033

Figure 45: North America Market Attractiveness by Product Type, 2023 to 2033

Figure 46: North America Market Attractiveness by Material Type, 2023 to 2033

Figure 47: North America Market Attractiveness by Capacity Size, 2023 to 2033

Figure 48: North America Market Attractiveness by Country, 2023 to 2033

Figure 49: Latin America Market Value (US$ Million) by Product Type, 2023 to 2033

Figure 50: Latin America Market Value (US$ Million) by Material Type, 2023 to 2033

Figure 51: Latin America Market Value (US$ Million) by Capacity Size, 2023 to 2033

Figure 52: Latin America Market Value (US$ Million) by Country, 2023 to 2033

Figure 53: Latin America Market Value (US$ Million) Analysis by Country, 2018 to 2033

Figure 54: Latin America Market Volume (Units) Analysis by Country, 2018 to 2033

Figure 55: Latin America Market Value Share (%) and BPS Analysis by Country, 2023 to 2033

Figure 56: Latin America Market Y-o-Y Growth (%) Projections by Country, 2023 to 2033

Figure 57: Latin America Market Value (US$ Million) Analysis by Product Type, 2018 to 2033

Figure 58: Latin America Market Volume (Units) Analysis by Product Type, 2018 to 2033

Figure 59: Latin America Market Value Share (%) and BPS Analysis by Product Type, 2023 to 2033

Figure 60: Latin America Market Y-o-Y Growth (%) Projections by Product Type, 2023 to 2033

Figure 61: Latin America Market Value (US$ Million) Analysis by Material Type, 2018 to 2033

Figure 62: Latin America Market Volume (Units) Analysis by Material Type, 2018 to 2033

Figure 63: Latin America Market Value Share (%) and BPS Analysis by Material Type, 2023 to 2033

Figure 64: Latin America Market Y-o-Y Growth (%) Projections by Material Type, 2023 to 2033

Figure 65: Latin America Market Value (US$ Million) Analysis by Capacity Size, 2018 to 2033

Figure 66: Latin America Market Volume (Units) Analysis by Capacity Size, 2018 to 2033

Figure 67: Latin America Market Value Share (%) and BPS Analysis by Capacity Size, 2023 to 2033

Figure 68: Latin America Market Y-o-Y Growth (%) Projections by Capacity Size, 2023 to 2033

Figure 69: Latin America Market Attractiveness by Product Type, 2023 to 2033

Figure 70: Latin America Market Attractiveness by Material Type, 2023 to 2033

Figure 71: Latin America Market Attractiveness by Capacity Size, 2023 to 2033

Figure 72: Latin America Market Attractiveness by Country, 2023 to 2033

Figure 73: Europe Market Value (US$ Million) by Product Type, 2023 to 2033

Figure 74: Europe Market Value (US$ Million) by Material Type, 2023 to 2033

Figure 75: Europe Market Value (US$ Million) by Capacity Size, 2023 to 2033

Figure 76: Europe Market Value (US$ Million) by Country, 2023 to 2033

Figure 77: Europe Market Value (US$ Million) Analysis by Country, 2018 to 2033

Figure 78: Europe Market Volume (Units) Analysis by Country, 2018 to 2033

Figure 79: Europe Market Value Share (%) and BPS Analysis by Country, 2023 to 2033

Figure 80: Europe Market Y-o-Y Growth (%) Projections by Country, 2023 to 2033

Figure 81: Europe Market Value (US$ Million) Analysis by Product Type, 2018 to 2033

Figure 82: Europe Market Volume (Units) Analysis by Product Type, 2018 to 2033

Figure 83: Europe Market Value Share (%) and BPS Analysis by Product Type, 2023 to 2033

Figure 84: Europe Market Y-o-Y Growth (%) Projections by Product Type, 2023 to 2033

Figure 85: Europe Market Value (US$ Million) Analysis by Material Type, 2018 to 2033

Figure 86: Europe Market Volume (Units) Analysis by Material Type, 2018 to 2033

Figure 87: Europe Market Value Share (%) and BPS Analysis by Material Type, 2023 to 2033

Figure 88: Europe Market Y-o-Y Growth (%) Projections by Material Type, 2023 to 2033

Figure 89: Europe Market Value (US$ Million) Analysis by Capacity Size, 2018 to 2033

Figure 90: Europe Market Volume (Units) Analysis by Capacity Size, 2018 to 2033

Figure 91: Europe Market Value Share (%) and BPS Analysis by Capacity Size, 2023 to 2033

Figure 92: Europe Market Y-o-Y Growth (%) Projections by Capacity Size, 2023 to 2033

Figure 93: Europe Market Attractiveness by Product Type, 2023 to 2033

Figure 94: Europe Market Attractiveness by Material Type, 2023 to 2033

Figure 95: Europe Market Attractiveness by Capacity Size, 2023 to 2033

Figure 96: Europe Market Attractiveness by Country, 2023 to 2033

Figure 97: Asia Pacific Market Value (US$ Million) by Product Type, 2023 to 2033

Figure 98: Asia Pacific Market Value (US$ Million) by Material Type, 2023 to 2033

Figure 99: Asia Pacific Market Value (US$ Million) by Capacity Size, 2023 to 2033

Figure 100: Asia Pacific Market Value (US$ Million) by Country, 2023 to 2033

Figure 101: Asia Pacific Market Value (US$ Million) Analysis by Country, 2018 to 2033

Figure 102: Asia Pacific Market Volume (Units) Analysis by Country, 2018 to 2033

Figure 103: Asia Pacific Market Value Share (%) and BPS Analysis by Country, 2023 to 2033

Figure 104: Asia Pacific Market Y-o-Y Growth (%) Projections by Country, 2023 to 2033

Figure 105: Asia Pacific Market Value (US$ Million) Analysis by Product Type, 2018 to 2033

Figure 106: Asia Pacific Market Volume (Units) Analysis by Product Type, 2018 to 2033

Figure 107: Asia Pacific Market Value Share (%) and BPS Analysis by Product Type, 2023 to 2033

Figure 108: Asia Pacific Market Y-o-Y Growth (%) Projections by Product Type, 2023 to 2033

Figure 109: Asia Pacific Market Value (US$ Million) Analysis by Material Type, 2018 to 2033

Figure 110: Asia Pacific Market Volume (Units) Analysis by Material Type, 2018 to 2033

Figure 111: Asia Pacific Market Value Share (%) and BPS Analysis by Material Type, 2023 to 2033

Figure 112: Asia Pacific Market Y-o-Y Growth (%) Projections by Material Type, 2023 to 2033

Figure 113: Asia Pacific Market Value (US$ Million) Analysis by Capacity Size, 2018 to 2033

Figure 114: Asia Pacific Market Volume (Units) Analysis by Capacity Size, 2018 to 2033

Figure 115: Asia Pacific Market Value Share (%) and BPS Analysis by Capacity Size, 2023 to 2033

Figure 116: Asia Pacific Market Y-o-Y Growth (%) Projections by Capacity Size, 2023 to 2033

Figure 117: Asia Pacific Market Attractiveness by Product Type, 2023 to 2033

Figure 118: Asia Pacific Market Attractiveness by Material Type, 2023 to 2033

Figure 119: Asia Pacific Market Attractiveness by Capacity Size, 2023 to 2033

Figure 120: Asia Pacific Market Attractiveness by Country, 2023 to 2033

Figure 121: MEA Market Value (US$ Million) by Product Type, 2023 to 2033

Figure 122: MEA Market Value (US$ Million) by Material Type, 2023 to 2033

Figure 123: MEA Market Value (US$ Million) by Capacity Size, 2023 to 2033

Figure 124: MEA Market Value (US$ Million) by Country, 2023 to 2033

Figure 125: MEA Market Value (US$ Million) Analysis by Country, 2018 to 2033

Figure 126: MEA Market Volume (Units) Analysis by Country, 2018 to 2033

Figure 127: MEA Market Value Share (%) and BPS Analysis by Country, 2023 to 2033

Figure 128: MEA Market Y-o-Y Growth (%) Projections by Country, 2023 to 2033

Figure 129: MEA Market Value (US$ Million) Analysis by Product Type, 2018 to 2033

Figure 130: MEA Market Volume (Units) Analysis by Product Type, 2018 to 2033

Figure 131: MEA Market Value Share (%) and BPS Analysis by Product Type, 2023 to 2033

Figure 132: MEA Market Y-o-Y Growth (%) Projections by Product Type, 2023 to 2033

Figure 133: MEA Market Value (US$ Million) Analysis by Material Type, 2018 to 2033

Figure 134: MEA Market Volume (Units) Analysis by Material Type, 2018 to 2033

Figure 135: MEA Market Value Share (%) and BPS Analysis by Material Type, 2023 to 2033

Figure 136: MEA Market Y-o-Y Growth (%) Projections by Material Type, 2023 to 2033

Figure 137: MEA Market Value (US$ Million) Analysis by Capacity Size, 2018 to 2033

Figure 138: MEA Market Volume (Units) Analysis by Capacity Size, 2018 to 2033

Figure 139: MEA Market Value Share (%) and BPS Analysis by Capacity Size, 2023 to 2033

Figure 140: MEA Market Y-o-Y Growth (%) Projections by Capacity Size, 2023 to 2033

Figure 141: MEA Market Attractiveness by Product Type, 2023 to 2033

Figure 142: MEA Market Attractiveness by Material Type, 2023 to 2033

Figure 143: MEA Market Attractiveness by Capacity Size, 2023 to 2033

Figure 144: MEA Market Attractiveness by Country, 2023 to 2033

Recommendations

Packaging

Pharmaceutical Packaging Market

Published : January 2024

Packaging

Pharmaceutical Contract Packaging Market

Published : October 2023

Packaging

Pharmaceuticals Pouch Market

Published : October 2022

Packaging

Pharmaceutical Ampoules Market

Published : July 2021

Explore Packaging Insights

View Reports

Pharmaceutical Vials Market