
- Market Size (2026)
- USD 196.2 Mn
- Forecast (2036)
- USD 443.6 Mn
- CAGR (2026 to 2036)
- 8.5%
How big is the Sea Moss Market in 2026?
The global sea moss market is valued at USD 196.2 million in 2026 and is projected to reach USD 443.6 million by 2036, growing at a CAGR of 8.5%. The market was valued at USD 180.0 million in 2025.
Demand for sea moss is rising due to its use as a daily source of minerals and fiber among consumers in the United States and Europe, a habit that moved from Caribbean food culture into mainstream wellness through social media and online retail. The shift from raw dried seaweed toward capsules and gummies is also contributing to demand, as these formats deliver a measured dose without preparation and sell at higher prices per kilogram. However, unresolved questions over quality and safety can create challenges for growth, as the health benefits promoted for sea moss have not been confirmed in clinical trials and iodine content varies widely between products. Much of the gel on sale is also made by small producers without validated processes, which is likely to bring closer scrutiny from retailers and regulators. Sales through supermarkets and pharmacies are projected to grow at 8.5% a year as test results and named origin become listing requirements, and FMI projects gummies to grow at 11.4% a year. Certified and traceable supply offers the clearest opportunity, and Caribbean producers are well placed as governments fund farming standards and export controls. By form, raw dried sea moss accounts for 30.0% of 2026 revenue, while golden sea moss holds 55.0% by seaweed type and dietary supplements account for 58.0% by application. Key companies include Acadian Seaplants, Maine Coast Sea Vegetables, Micro Ingredients and TrueSeaMoss.
Sea Moss Market Size and Forecast
Table 1: Sea Moss Market Size and Forecast
| Market size and forecast | Value |
|---|---|
| Market size in 2025 | USD 180.0 million |
| Estimated market size in 2026 | USD 196.2 million |
| Projected market size by 2036 | USD 443.6 million |
| CAGR from 2026 to 2036 | 8.5% |
| Dominant form (2026) | Raw dried sea moss, 30.0% of revenue |
| High-growth country markets | South Africa (10.1% CAGR), Germany (9.6%), Australia (9.6%) |
| Leading Tier-1 companies | Acadian Seaplants, Maine Coast Sea Vegetables, Micro Ingredients, TrueSeaMoss |
Source: Future Market Insights analysis of the sea moss market, 2026.

Key Market Trends & Insights
- Sea moss is expected to move from a home-prepared food to a dosed supplement. Buyers who started by soaking and blending dried seaweed are switching to capsules and gummies that need no preparation and give the same amount in every serving. FMI projects gummies to grow at 11.4% a year and capsules and tablets at 9.4%, while raw dried sea moss grows at 6.4% and its share of revenue falls from 30.0% in 2026 to 24.7% by 2036.
- Test results and origin are becoming part of the product. As sea moss moves onto supermarket and pharmacy shelves, buyers and retailers want proof of heavy metal limits, iodine content and microbial safety, along with a named source. FMI projects sales through supermarkets and pharmacies to grow at 8.5% a year, faster than through health food and specialty stores at 7.0%.
- Personal care is likely to grow into a steady second outlet. Sea moss is used in creams, masks and hair products for its gel texture and mineral content, and skincare brands use it to carry the same natural positioning that sells supplements. FMI projects personal care and cosmetics to grow at 8.4% a year and hold about 12% of revenue through 2036.
Regional Highlights
- North America is expected to account for 68.0% of revenue in 2026 and 67.0% by 2036. The United States alone is projected to add USD 148.7 million, about 60% of the market's increase, so US online demand is likely to set the pace for the whole category.
- Europe is projected to hold its share at about 15% while more than doubling in value, from USD 29.4 million in 2026 to USD 68.1 million by 2036 across the United Kingdom, Ireland, Germany and France. Germany is likely to grow fastest of the four, at 9.6% a year, as sea moss moves from Caribbean grocers into mainstream health stores and online.
- The Caribbean producing markets are expected to grow more slowly at home than abroad. Jamaica and Trinidad and Tobago are projected to grow at 5.1% a year, and their combined share of revenue is likely to fall from 4.5% to 3.3%. South Africa and markets outside the ten largest are projected to grow fastest of all, at 10.1% a year.
Analyst Perspective
"Sea moss is passing from a social media trend into a regular supplement category, and that changes who wins. The brands that grow from here will be the ones that can show tested, traceable supply and a dose consumers can trust, because retailers and regulators are starting to ask for both."
- Nandini Roy Choudhury, Principal Consultant, FMI
How is the Sea Moss Market segmented?
The Sea Moss Market is segmented by form, seaweed type, application, distribution channel and region. Form covers raw dried sea moss, gel, capsules and tablets, gummies and powder. Seaweed type covers Eucheuma and Kappaphycus (golden sea moss), Chondrus crispus (Irish moss), Gracilaria and other red seaweeds. Application covers dietary supplements, drinks and smoothies, foods and desserts, and personal care and cosmetics. Distribution channel covers online retail, health food and specialty stores, supermarkets and pharmacies, and direct sales and markets.
Why does the Raw Dried Sea Moss segment lead by Form?
Nearly one in three dollars spent on sea moss in 2026 goes to raw dried seaweed, which accounts for 30.0% of revenue by form.
The format leads because it is where the habit began and where the cost per serving is lowest. Caribbean households have long soaked dried sea moss and blended it into drinks and porridge, and the recipes that spread the trend online teach new buyers to do the same at home. A bag of dried seaweed keeps for months without refrigeration, which suits online sellers that ship over long distances, and one purchase can be turned into gel, smoothies and desserts. Entry is also easy for sellers. A small brand can import dried sea moss in bulk and repackage it under its own label without any processing, so the format carries the widest range of brands and prices. That ease of entry has a cost, because it leaves most quality checks to the buyer.
Product counts show how far the format has spread. Of 66 commercial sea moss products bought from online retailers such as Amazon and Etsy for a 2026 Cornell AgriTech study, 53 were dried products.
Why does the Eucheuma and Kappaphycus segment lead by Seaweed Type?
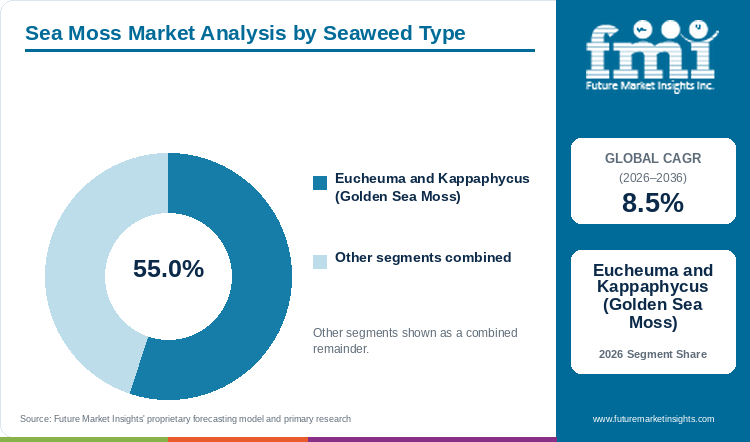
Golden sea moss from Eucheuma and Kappaphycus accounts for 55.0% of 2026 revenue by seaweed type, more than the other three types combined.
Supply decides this segment. Eucheuma and Kappaphycus are farmed on ropes in warm, shallow water across Southeast Asia and East Africa, where the carrageenan industry built large farming bases over several decades. Sea moss brands buy from that base at lower and steadier prices than Irish moss, which comes mainly from licensed wild harvests on cold Atlantic coasts and cannot be scaled quickly. Golden sea moss also produces a light, mild gel that blends easily into drinks and gummies, which suits the formats growing fastest. Caribbean farms sell their sea moss on origin and command higher prices, but their output is small next to Asian supply. The link to the wider carrageenan market also keeps raw material available in most years, since the same seaweeds feed both industries.
The scale gap is large. Indonesia produces about 150,000 tonnes and the Philippines about 100,000 tonnes of these seaweeds a year in dry weight, while Jamaica's commercial sea moss output was 1,400 kilograms in 2025.
Why does the Dietary Supplements segment lead by Application?
Most sea moss is bought as a supplement, and dietary supplements account for 58.0% of 2026 revenue by application.
Buyers take sea moss for minerals, iodine, digestion and skin, so they treat it as part of a daily routine, closer to a vitamin than to a food. That habit favors formats that fit the routine, such as a capsule with breakfast or a gummy in the afternoon. Supplement formats also earn more per gram, because brands can combine sea moss with bladderwrack, burdock root or vitamins and sell the blend at a higher price. Distribution follows the same logic. Supplements are sold online, in pharmacies and in health stores next to other wellness products, which gives sea moss a place on shelves that a raw seaweed would not reach. The category is growing inside the wider dietary supplements market, and gummies in particular are drawing buyers who dislike the taste and texture of gel, a shift seen across the gummy supplements market.
Mainstream retailers are now backing these formats. Whole Foods Market featured sea moss and spirulina gummies and a flavored sea moss gel among the products in its trend predictions for 2027.
What are the key drivers, restraints and opportunities?
Online retail and Caribbean supply programs are expected to drive growth, while unproven health claims and uneven product safety are likely to slow it. Certified, traceable supply offers producers the clearest way to earn higher prices.
Driver
Online retail and social media are expected to drive demand. Sea moss spread through recipe videos and wellness creators, and most buyers first meet it on a screen, not on a store shelf. Online sellers can launch a sea moss brand with little capital and reach buyers in many countries at once, which keeps product choice wide and prices competitive. Online retail accounts for 52.0% of 2026 revenue, and that reach has turned a regional food into an export crop for several Caribbean islands. Saint Lucia shows the effect on supply. Its sea moss exports grew from tens of thousands of dollars in 2018 to millions of dollars a year, making sea moss the island's most lucrative agricultural export.
Restraint
Unproven health claims and uneven product safety are likely to restrain growth. Sea moss is sold on promises about immunity, thyroid health and digestion, and those promises leave brands exposed if regulators or the media question them. Safety is the larger risk. Seaweed absorbs metals from the water it grows in, and gel is a moist, low-acid food that needs controlled processing, yet much of it is made in small kitchens. A single recall or study can hit sales across the category. Recent evidence shows both risks. None of the promoted health benefits of sea moss has been confirmed in clinical studies, and a 2026 Cornell AgriTech study found arsenic, cobalt and mercury in dried products along with wide variation in microbial content.
Opportunity
Certified and traceable supply is the clearest opportunity. Buyers who worry about contamination will pay more for sea moss with a named origin, a test certificate and a farming record, and retailers need that paperwork before they list a product. Caribbean producers are well placed, because governments and development agencies are already funding farming standards, packhouses and export controls. Two programs show the direction. Saint Lucia introduced a Sea Moss Export Certificate and is pursuing a geographical indication for its sea moss, and FAO published a practical guide to sea moss cultivation for Caribbean farmers in 2025.
Sea Moss Market by Country (2026 to 2036)
The United States accounts for most revenue, but the fastest growth is projected in South Africa, Germany, Australia and markets outside the ten largest. FMI projects the ten countries below to hold 89.2% of global revenue in 2036, against 90.7% in 2026.
Table 2: Sea Moss Market CAGR by Country, 2026 to 2036
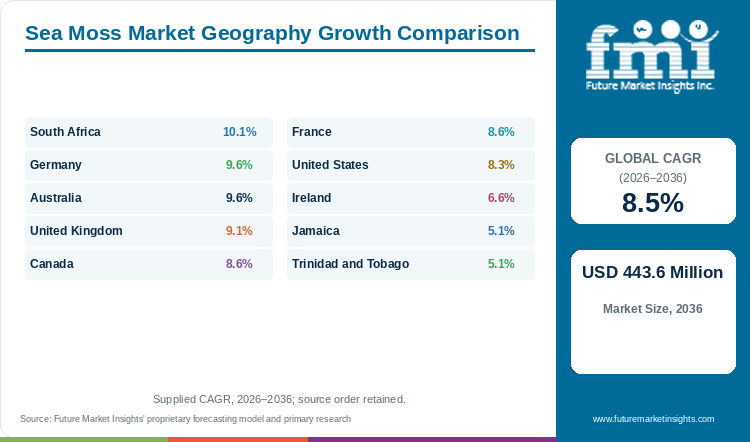
| Country | CAGR, 2026 to 2036 |
|---|---|
| South Africa | 10.1% |
| Germany | 9.6% |
| Australia | 9.6% |
| United Kingdom | 9.1% |
| Canada | 8.6% |
| France | 8.6% |
| United States | 8.3% |
| Ireland | 6.6% |
| Jamaica | 5.1% |
| Trinidad and Tobago | 5.1% |
Source: Future Market Insights analysis of the sea moss market, 2026.
United States
The United States is likely to add about 60% of the market's growth to 2036, with revenue projected to rise from USD 121.6 million in 2026 to USD 270.3 million. Its share of global revenue is expected to edge down from 62.0% to 60.9%.
American demand grew out of Caribbean communities in New York, Florida and other cities, and moved into the mainstream when wellness creators promoted sea moss gel during the pandemic. Online retail carries most of the category, and marketplaces host many small brands that import dried seaweed and sell it as raw sea moss, gel, capsules or gummies. That structure keeps prices low and choice wide, but it also makes quality hard to judge for the average buyer. Growth is expected to shift toward capsules and gummies sold by larger supplement brands and through grocery and pharmacy chains, because these channels can meet the testing and labeling requirements that many small gel makers cannot. State food safety inspections of gel producers are likely to become more frequent, which will push out sellers that lack approved processes and help established brands gain share.
Home preparation remains a weak point. A Cornell review of 112 YouTube videos found that about half recommended refrigerating home-made sea moss gel, while nearly a third gave no storage guidance at all.
United Kingdom
The United Kingdom is the second-largest market, with revenue projected to grow at 9.1% a year from USD 17.7 million in 2026 to USD 42.2 million by 2036. Its share of global revenue rises from 9.0% to 9.5%.
British demand rests on a large Caribbean community, especially in London and Birmingham, where sea moss drinks have long been sold in grocers and takeaways. The wellness trend has carried that habit into the wider population, and sea moss gels, capsules and gummies now sell online and through health food chains. Market stalls and festival vendors also sell fresh sea moss smoothies, which keeps the product visible to new buyers. Growth is likely to come from supplement formats, because UK buyers already purchase vitamins and minerals in capsule form and the same shelves can carry sea moss. The main constraint is labeling. Food supplements in the UK must avoid medicinal claims, so brands that rely on bold health promises are likely to face pressure from regulators and retailers. Suppliers that name their origin and publish iodine and heavy metal test results are likely to gain listings with the larger health chains.
Caribbean exporters see the United Kingdom as a priority market. Export Saint Lucia has helped local producers enter markets including London, Toronto, New York and Miami.
Canada
Canada ranks third, with revenue projected to rise from USD 11.8 million in 2026 to USD 26.9 million by 2036, a CAGR of 8.6%. Its share of global revenue stays close to 6%.
Canadian demand follows the US pattern, with a Caribbean community in Toronto and Montreal that brought the habit and an online wellness audience that spread it. Canada also sits on the supply side. Its Atlantic provinces have harvested Irish moss for decades, and processors there, which also supply the wider commercial seaweed market, have the drying, testing and export systems that smaller sea moss brands lack. That gives Canadian suppliers a credible origin story at a time when buyers want traceable seaweed from cold, clean water. Growth is likely to come from supplements and personal care products made with North Atlantic red seaweeds and sold at premium prices, alongside imported golden sea moss sold at lower prices online. Health Canada's rules for natural health products add cost and time for supplement brands, which is likely to favor established suppliers with regulatory experience over new online sellers. Toronto is also a gateway for Caribbean exporters, which brings Saint Lucian and Jamaican sea moss into the same stores as North Atlantic products.
The supply base is moving toward wellness products. Nova Scotia-based Acadian Seaplants said in May 2026 that it is expanding its human wellness portfolio built on red seaweeds, including Chondrus crispus.
Jamaica
Jamaica is the largest market in the Caribbean, with revenue projected to grow from USD 5.9 million in 2026 to USD 9.7 million by 2036. Growth of 5.1% a year is slower than in the importing countries, so Jamaica's share of global revenue is likely to fall from 3.0% to 2.2%.
Sea moss has a long place in Jamaican food, where it is boiled with milk, spices and sweeteners into a drink sold by street vendors and in shops. Demand at home is mature, and the larger opportunity lies in supplying tourists and export buyers who will pay for Jamaican origin. Most supply has come from wild harvest along the coast, which limits volume and makes quality uneven. Farming is now being developed to change that, with fishers trained to grow sea moss on lines in sheltered bays. Coastal farming carries weather risk, since a single storm can destroy lines, boats and drying equipment. If farming targets are met, Jamaica is likely to become a more reliable exporter of branded and processed sea moss, earning more from each kilogram it ships.
The government is backing that shift. Jamaica has trained 200 fishers in sea moss husbandry over the past three years, and the National Fisheries Authority expects commercial output to reach 5,000 kilograms by 2027, even after Hurricane Melissa destroyed oyster farms in the western parishes of Westmoreland and Hanover.
Ireland
Ireland is projected to grow at 6.6% a year, from USD 4.9 million in 2026 to USD 9.3 million by 2036, with its share of global revenue easing from 2.5% to 2.1%.
Irish moss is named after the country, and carrageen moss has a long history in Irish cooking as a setting agent for puddings and as a home remedy. That heritage gives Irish suppliers a recognized origin to sell, both at home and to export buyers who want Atlantic seaweed from a named coast. Domestic demand is smaller than in the United Kingdom, but it is growing as health stores and online sellers bring sea moss supplements to younger buyers. Supply is the constraint. Wild harvest along the west coast requires licensing, and new seaweed farms face a slow approval process, which limits how quickly producers can scale. Growth is likely to come from premium dried Irish moss and from supplements and skincare made with Irish seaweed, sold on provenance and at higher prices than imported golden sea moss. Close trade ties with the United Kingdom also let Irish brands reach the larger British market through the same distributors and online stores.
The industry has started to organize. The Irish Seaweed Association launched in February 2025, and researchers behind it named complex licensing procedures and limited access to processing among the main barriers to growth.
A full deep-dive analysis of 40+ countries is available in the full report.
Who are the notable companies in the Sea Moss Market?
Notable companies in the Sea Moss Market include Acadian Seaplants, Maine Coast Sea Vegetables, Micro Ingredients, TrueSeaMoss and NutraChamps.
The market has two layers. Upstream sit harvesters, farmers and processors, such as North Atlantic seaweed companies and the farming cooperatives of Southeast Asia, East Africa and the Caribbean, which dry, clean and test the seaweed. Downstream sit consumer brands, most of them young companies that sell online and buy their raw material from importers. The downstream layer is crowded and easy to enter, because a brand needs little more than a supplier, a label and a marketplace account. That makes competition intense on price and marketing, and it means many products that look different share the same source. The upstream layer is more concentrated and is gaining importance as retailers ask for test certificates and traceable supply that only established processors can provide.
Both layers were tested in 2026. A leading gel brand recalled its entire range in January over missing regulatory authorization, and Cornell researchers noted that several of the products they tested may have come from a single supplier and been repackaged under different labels.
Key Developments in the Sea Moss Market
- In January 2026, Diva Fam Inc. voluntarily recalled all lots and flavors of its True Sea Moss Sea Moss Gel Superfood after a California Department of Public Health inspection raised questions about regulatory authorization and temperature monitoring records.
- In May 2026, Acadian Seaplants said it is expanding its human wellness portfolio built on brown and red seaweeds, including Chondrus crispus.
- In May 2026, Jamaica's Minister of Agriculture, Fisheries and Mining said the National Fisheries Authority expects commercial sea moss production to triple by 2027.
- In October 2026, Whole Foods Market featured Kuli Kuli Sea Moss and Blue Spirulina Superfood Gummies and True Sea Moss gel in its trend predictions for 2027.
Key Players in the Sea Moss Market
- Acadian Seaplants
- Maine Coast Sea Vegetables
- Micro Ingredients
- TrueSeaMoss
- NutraChamps
Sea Moss Market Report Scope
Table 3: Sea Moss Market Report Scope
| Coverage field | Report scope |
|---|---|
| Market definition | Edible red seaweeds sold as sea moss, including Chondrus crispus (Irish moss), Eucheuma, Kappaphycus and Gracilaria, for food, supplement and personal care use. |
| Forms | Raw dried sea moss, gel, capsules and tablets, gummies and powder. |
| Seaweed types | Eucheuma and Kappaphycus (golden sea moss), Chondrus crispus (Irish moss), Gracilaria and other red seaweeds. |
| Applications | Dietary supplements, drinks and smoothies, foods and desserts, and personal care and cosmetics. |
| Distribution channels | Online retail, health food and specialty stores, supermarkets and pharmacies, and direct sales and markets. |
| Supply base | Farmed and wild-harvested red seaweeds from Southeast Asia, East Africa, the Caribbean and the North Atlantic. |
| Exclusions | Refined carrageenan and agar sold as food additives, brown seaweeds such as kelp and bladderwrack sold on their own, and seaweed snacks. |
| Quantitative units | USD million for value, tonnes of dried seaweed equivalent for volume. |
| Value basis | Supplier selling prices across all sales channels, counted in the country where the product is sold. |
| Volume basis | Tonnes of dried seaweed equivalent contained in products sold. |
| Forecast period | 2026 to 2036, with 2025 as the base year. |
| Regions covered | North America, Latin America and the Caribbean, Europe, East Asia, South Asia and Pacific, and Middle East and Africa. |
| National coverage | United States, United Kingdom, Canada, Jamaica, Ireland, Germany, Australia, France, Trinidad and Tobago, and South Africa. |
| Companies covered | Acadian Seaplants, Maine Coast Sea Vegetables, Micro Ingredients, TrueSeaMoss and NutraChamps. |
Source: Future Market Insights analysis of the sea moss market, 2026.
Sea Moss Market Research Methodology
FMI sizes the market from the volume of sea moss sold, stated in tonnes of dried seaweed equivalent, and the price paid by buyers at supplier level, and checks the result against seaweed production data, export records from producing countries and the size of the wider supplement and seaweed markets. Country revenue is counted where the product is sold, and segment and country figures sum to the market total in every year. Form and application splits reflect each format's share of products sold and its price relative to raw dried sea moss. Forecasts reflect expected changes in demand, supply, regulation and product mix, and they are estimates subject to a margin of error.
Sea Moss Market by Segments
Sea Moss Market segmented by Form:
- Raw Dried Sea Moss
- Gel
- Capsules and Tablets
- Gummies
- Powder
Sea Moss Market segmented by Seaweed Type:
- Eucheuma and Kappaphycus (Golden Sea Moss)
- Chondrus crispus (Irish Moss)
- Gracilaria
- Other Red Seaweeds
Sea Moss Market segmented by Application:
- Dietary Supplements
- Drinks and Smoothies
- Foods and Desserts
- Personal Care and Cosmetics
Sea Moss Market segmented by Distribution Channel:
- Online Retail
- Health Food and Specialty Stores
- Supermarkets and Pharmacies
- Direct Sales and Markets
Sea Moss Market by Region
- North America
- Latin America and the Caribbean
- Europe
- East Asia
- South Asia and Pacific
- Middle East and Africa
Research Sources and Bibliography
- Acadian Seaplants. (2026, May 18). Powering the Next Wave of Human Wellness. https://acadianhumanwellness.com/powering-the-next-wave-of-human-wellness/
- ConsumerLab.com. (2025, November 20). Sea Moss & Carrageenan: Health Benefits & Safety. https://www.consumerlab.com/answers/why-is-carrageenan-in-my-supplement/carrageenan/
- Cornell University College of Agriculture and Life Sciences. (2026, October 27). Sea moss is trending. The science is just catching up. cals.cornell.edu
- Food and Agriculture Organization of the United Nations. (2025, April 23). Sea Moss Rising. www.fao.org
- Jamaica Information Service. (2026, May 14). Gov't to Advance Blue Economy with Sea Moss Focus. jis.gov.jm
- RTÉ News. (2025, February 28). New seaweed association to unlock industry potential. https://www.rte.ie/news/ireland/2025/0228/1499515-ireland-seaweed-association/
- Supply Chain Outlook. (2025, July 21). Export St Lucia: Spotlight. https://www.supplychain-outlook.com/supply-chain-spotlights/export-st-lucia-spotlight
- U.S. Food and Drug Administration. (2026, January 9). Diva Fam Inc. Announces Voluntary Recall of Sea Moss Gel Superfood Products Due to Possible Health Risk. www.fda.gov
- Whole Foods Market. (2026, October 14). Whole Foods Market Reveals Its Top Food and Beverage Trend Predictions for 2027. https://press.aboutamazon.com/2026/10/whole-foods-market-reveals-its-top-food-and-beverage-trend-predictions-for-2027
- World Bank. (2025). Seaweed Power: Unlocking Tanzania's Potential. https://documents1.worldbank.org/curated/en/099705408252542161/pdf/IDU-e0822fb8-ef49-4ad2-b250-0b17ee272b97.pdf
Table of Content
- Key Takeaways
- Market Size and CAGR
- Top Growth Driver
- Fastest Growing Segment
- Leading Region
- Key Companies
- Emerging Opportunities
- Executive Summary
- Global Market Outlook
- Demand-side Trends
- Supply-side Trends
- Technology Roadmap Analysis
- Analysis and Recommendations
- Analyst Perspective (What is happening? Why now? What should investors know?)
- Key Questions Answered
- How large is the market?
- What is the CAGR?
- What are key trends?
- Which region dominates?
- Who are the leaders?
Read More...
- Market Overview
- Market Coverage / Taxonomy
- Market Definition / Scope / Limitations
- Research Methodology
- Chapter Orientation
- Analytical Lens and Working Hypotheses
- Market Structure, Signals, and Trend Drivers
- Benchmarking and Cross-market Comparability
- Market Sizing, Forecasting, and Opportunity Mapping
- Research Design and Evidence Framework
- Desk Research Programme (Secondary Evidence)
- Expert Input and Fieldwork (Primary Evidence)
- Tooling, Models, and Reference Databases
- Data Engineering and Model Build
- Quality Assurance and Audit Trail
- Market Background
- Market Dynamics (Drivers, Restraints, Opportunity, Trends)
- Scenario Forecast (Optimistic, Likely, Conservative)
- Impact Analysis
- AI Impact
- Sustainability Impact
- Regulatory Impact
- Technology Impact
- Consumer / Buyer Analysis
- Purchase Drivers
- Adoption Barriers
- Buyer Journey
- Opportunity Map Analysis
- Product Life Cycle Analysis
- Supply Chain Analysis
- Investment Feasibility Matrix
- Value Chain Analysis
- PESTLE and Porter's Analysis
- Regulatory Landscape
- Regional Parent Market Outlook
- Production and Consumption Statistics
- Import and Export Statistics
- Global Market Analysis and Forecast, 2021 to 2036
- Historical Market Size Value (USD Million) Analysis, 2021 to 2025
- Current and Future Market Size Value (USD Million) Projections, 2026 to 2036
- Y-o-Y Growth Trend Analysis
- Absolute $ Opportunity Analysis
- Global Market Pricing Analysis, 2021 to 2036
- Global Market Analysis and Forecast, By Form, 2021 to 2036
- Introduction / Key Findings
- Historical Market Size Value (USD Million) Analysis By Form, 2021 to 2025
- Current and Future Market Size Value (USD Million) Analysis and Forecast By Form, 2026 to 2036
- Raw Dried Sea Moss
- Gel
- Capsules and Tablets
- Gummies
- Powder
- Y-o-Y Growth Trend Analysis By Form, 2021 to 2025
- Absolute $ Opportunity Analysis By Form, 2026 to 2036
- Global Market Analysis and Forecast, By Seaweed Type, 2021 to 2036
- Introduction / Key Findings
- Historical Market Size Value (USD Million) Analysis By Seaweed Type, 2021 to 2025
- Current and Future Market Size Value (USD Million) Analysis and Forecast By Seaweed Type, 2026 to 2036
- Eucheuma and Kappaphycus (Golden Sea Moss)
- Chondrus crispus (Irish Moss)
- Gracilaria
- Other Red Seaweeds
- Y-o-Y Growth Trend Analysis By Seaweed Type, 2021 to 2025
- Absolute $ Opportunity Analysis By Seaweed Type, 2026 to 2036
- Global Market Analysis and Forecast, By Application, 2021 to 2036
- Introduction / Key Findings
- Historical Market Size Value (USD Million) Analysis By Application, 2021 to 2025
- Current and Future Market Size Value (USD Million) Analysis and Forecast By Application, 2026 to 2036
- Dietary Supplements
- Drinks and Smoothies
- Foods and Desserts
- Personal Care and Cosmetics
- Y-o-Y Growth Trend Analysis By Application, 2021 to 2025
- Absolute $ Opportunity Analysis By Application, 2026 to 2036
- Global Market Analysis and Forecast, By Distribution Channel, 2021 to 2036
- Introduction / Key Findings
- Historical Market Size Value (USD Million) Analysis By Distribution Channel, 2021 to 2025
- Current and Future Market Size Value (USD Million) Analysis and Forecast By Distribution Channel, 2026 to 2036
- Online Retail
- Health Food and Specialty Stores
- Supermarkets and Pharmacies
- Direct Sales and Markets
- Y-o-Y Growth Trend Analysis By Distribution Channel, 2021 to 2025
- Absolute $ Opportunity Analysis By Distribution Channel, 2026 to 2036
- Global Market Analysis and Forecast, By Region, 2021 to 2036
- Introduction
- Historical Market Size Value (USD Million) Analysis By Region, 2021 to 2025
- Current Market Size Value (USD Million) Analysis and Forecast By Region, 2026 to 2036
- North America
- Europe
- East Asia
- South Asia and Pacific
- Middle East and Africa
- Market Attractiveness Analysis By Region
- North America Market Analysis and Forecast, By Country, 2021 to 2036
- Historical Market Size Value (USD Million) Trend Analysis By Market Taxonomy, 2021 to 2025
- Market Size Value (USD Million) Forecast By Market Taxonomy, 2026 to 2036
- By Country
- Latin America and the Caribbean
- By Form
- By Seaweed Type
- By Application
- By Distribution Channel
- By Country
- Market Attractiveness Analysis
- By Country
- By Form
- By Seaweed Type
- By Application
- By Distribution Channel
- Key Takeaways
- Europe Market Analysis and Forecast, By Country
- Historical Market Size Value (USD Million) Trend Analysis By Market Taxonomy, 2021 to 2025
- Market Size Value (USD Million) Forecast By Market Taxonomy, 2026 to 2036
- By Country
- By Form
- By Seaweed Type
- By Application
- By Distribution Channel
- Market Attractiveness Analysis
- By Country
- By Form
- By Seaweed Type
- By Application
- By Distribution Channel
- Key Takeaways
- East Asia Market Analysis and Forecast, By Country
- Historical Market Size Value (USD Million) Trend Analysis By Market Taxonomy, 2021 to 2025
- Market Size Value (USD Million) Forecast By Market Taxonomy, 2026 to 2036
- By Country
- By Form
- By Seaweed Type
- By Application
- By Distribution Channel
- Market Attractiveness Analysis
- By Country
- By Form
- By Seaweed Type
- By Application
- By Distribution Channel
- Key Takeaways
- South Asia and Pacific Market Analysis and Forecast, By Country
- Historical Market Size Value (USD Million) Trend Analysis By Market Taxonomy, 2021 to 2025
- Market Size Value (USD Million) Forecast By Market Taxonomy, 2026 to 2036
- By Country
- By Form
- By Seaweed Type
- By Application
- By Distribution Channel
- Market Attractiveness Analysis
- By Country
- By Form
- By Seaweed Type
- By Application
- By Distribution Channel
- Key Takeaways
- Middle East and Africa Market Analysis and Forecast, By Country
- Historical Market Size Value (USD Million) Trend Analysis By Market Taxonomy, 2021 to 2025
- Market Size Value (USD Million) Forecast By Market Taxonomy, 2026 to 2036
- By Country
- By Form
- By Seaweed Type
- By Application
- By Distribution Channel
- Market Attractiveness Analysis
- By Country
- By Form
- By Seaweed Type
- By Application
- By Distribution Channel
- Key Takeaways
- Key Countries Market Analysis
- South Africa
- Pricing Analysis
- Market Share Analysis, 2025
- By Form
- By Seaweed Type
- By Application
- By Distribution Channel
- Germany
- Pricing Analysis
- Market Share Analysis, 2025
- By Form
- By Seaweed Type
- By Application
- By Distribution Channel
- Australia
- Pricing Analysis
- Market Share Analysis, 2025
- By Form
- By Seaweed Type
- By Application
- By Distribution Channel
- United Kingdom
- Pricing Analysis
- Market Share Analysis, 2025
- By Form
- By Seaweed Type
- By Application
- By Distribution Channel
- Canada
- Pricing Analysis
- Market Share Analysis, 2025
- By Form
- By Seaweed Type
- By Application
- By Distribution Channel
- France
- Pricing Analysis
- Market Share Analysis, 2025
- By Form
- By Seaweed Type
- By Application
- By Distribution Channel
- United States
- Pricing Analysis
- Market Share Analysis, 2025
- By Form
- By Seaweed Type
- By Application
- By Distribution Channel
- Ireland
- Pricing Analysis
- Market Share Analysis, 2025
- By Form
- By Seaweed Type
- By Application
- By Distribution Channel
- Jamaica
- Pricing Analysis
- Market Share Analysis, 2025
- By Form
- By Seaweed Type
- By Application
- By Distribution Channel
- Trinidad and Tobago
- Pricing Analysis
- Market Share Analysis, 2025
- By Form
- By Seaweed Type
- By Application
- By Distribution Channel
- South Africa
- Market Structure Analysis
- Competition Dashboard
- Competition Benchmarking
- Market Share Analysis of Top Players
- By Regional
- By Form
- By Seaweed Type
- By Application
- By Distribution Channel
- Emerging Startups
- Innovation Benchmarking
- Competition Analysis
- Competition Deep Dive
- Acadian Seaplants
- Overview
- Product Portfolio
- Profitability by Market Segments
- Sales Footprint
- Strategy Overview
- Marketing Strategy
- Product Strategy
- Channel Strategy
- TrueSeaMoss
- Kuli Kuli
- Maine Coast Sea Vegetables
- Micro Ingredients
- NutraChamps
- Acadian Seaplants
- Case Studies
- Success Stories
- Recent Developments
- Competition Deep Dive
- Assumptions & Acronyms Used
List of Tables
- Table 1: Global Market Value (USD Million) Forecast by Region, 2021 to 2036
- Table 2: Global Market Value (USD Million) Forecast by Form, 2021 to 2036
- Table 3: Global Market Value (USD Million) Forecast by Seaweed Type, 2021 to 2036
- Table 4: Global Market Value (USD Million) Forecast by Application, 2021 to 2036
- Table 5: Global Market Value (USD Million) Forecast by Distribution Channel, 2021 to 2036
- Table 6: North America Market Value (USD Million) Forecast by Country, 2021 to 2036
- Table 7: North America Market Value (USD Million) Forecast by Form, 2021 to 2036
- Table 8: North America Market Value (USD Million) Forecast by Seaweed Type, 2021 to 2036
- Table 9: North America Market Value (USD Million) Forecast by Application, 2021 to 2036
- Table 10: North America Market Value (USD Million) Forecast by Distribution Channel, 2021 to 2036
- Table 11: Europe Market Value (USD Million) Forecast by Country, 2021 to 2036
- Table 12: Europe Market Value (USD Million) Forecast by Form, 2021 to 2036
- Table 13: Europe Market Value (USD Million) Forecast by Seaweed Type, 2021 to 2036
- Table 14: Europe Market Value (USD Million) Forecast by Application, 2021 to 2036
- Table 15: Europe Market Value (USD Million) Forecast by Distribution Channel, 2021 to 2036
- Table 16: East Asia Market Value (USD Million) Forecast by Country, 2021 to 2036
- Table 17: East Asia Market Value (USD Million) Forecast by Form, 2021 to 2036
- Table 18: East Asia Market Value (USD Million) Forecast by Seaweed Type, 2021 to 2036
- Table 19: East Asia Market Value (USD Million) Forecast by Application, 2021 to 2036
- Table 20: East Asia Market Value (USD Million) Forecast by Distribution Channel, 2021 to 2036
- Table 21: South Asia and Pacific Market Value (USD Million) Forecast by Country, 2021 to 2036
- Table 22: South Asia and Pacific Market Value (USD Million) Forecast by Form, 2021 to 2036
- Table 23: South Asia and Pacific Market Value (USD Million) Forecast by Seaweed Type, 2021 to 2036
- Table 24: South Asia and Pacific Market Value (USD Million) Forecast by Application, 2021 to 2036
- Table 25: South Asia and Pacific Market Value (USD Million) Forecast by Distribution Channel, 2021 to 2036
- Table 26: Middle East and Africa Market Value (USD Million) Forecast by Country, 2021 to 2036
- Table 27: Middle East and Africa Market Value (USD Million) Forecast by Form, 2021 to 2036
- Table 28: Middle East and Africa Market Value (USD Million) Forecast by Seaweed Type, 2021 to 2036
- Table 29: Middle East and Africa Market Value (USD Million) Forecast by Application, 2021 to 2036
- Table 30: Middle East and Africa Market Value (USD Million) Forecast by Distribution Channel, 2021 to 2036
List of Figures
- Figure 1: Global Market Pricing Analysis
- Figure 2: Global Market Value (USD Million) Forecast 2021-2036
- Figure 3: Global Market Value Share and BPS Analysis by Form, 2026 and 2036
- Figure 4: Global Market Y-o-Y Growth Comparison by Form, 2026-2036
- Figure 5: Global Market Attractiveness Analysis by Form
- Figure 6: Global Market Value Share and BPS Analysis by Seaweed Type, 2026 and 2036
- Figure 7: Global Market Y-o-Y Growth Comparison by Seaweed Type, 2026-2036
- Figure 8: Global Market Attractiveness Analysis by Seaweed Type
- Figure 9: Global Market Value Share and BPS Analysis by Application, 2026 and 2036
- Figure 10: Global Market Y-o-Y Growth Comparison by Application, 2026-2036
- Figure 11: Global Market Attractiveness Analysis by Application
- Figure 12: Global Market Value Share and BPS Analysis by Distribution Channel, 2026 and 2036
- Figure 13: Global Market Y-o-Y Growth Comparison by Distribution Channel, 2026-2036
- Figure 14: Global Market Attractiveness Analysis by Distribution Channel
- Figure 15: Global Market Value (USD Million) Share and BPS Analysis by Region, 2026 and 2036
- Figure 16: Global Market Y-o-Y Growth Comparison by Region, 2026-2036
- Figure 17: Global Market Attractiveness Analysis by Region
- Figure 18: North America Market Incremental Dollar Opportunity, 2026-2036
- Figure 19: Europe Market Incremental Dollar Opportunity, 2026-2036
- Figure 20: East Asia Market Incremental Dollar Opportunity, 2026-2036
- Figure 21: South Asia and Pacific Market Incremental Dollar Opportunity, 2026-2036
- Figure 22: Middle East and Africa Market Incremental Dollar Opportunity, 2026-2036
- Figure 23: North America Market Value Share and BPS Analysis by Country, 2026 and 2036
- Figure 24: North America Market Value Share and BPS Analysis by Form, 2026 and 2036
- Figure 25: North America Market Y-o-Y Growth Comparison by Form, 2026-2036
- Figure 26: North America Market Attractiveness Analysis by Form
- Figure 27: North America Market Value Share and BPS Analysis by Seaweed Type, 2026 and 2036
- Figure 28: North America Market Y-o-Y Growth Comparison by Seaweed Type, 2026-2036
- Figure 29: North America Market Attractiveness Analysis by Seaweed Type
- Figure 30: North America Market Value Share and BPS Analysis by Application, 2026 and 2036
- Figure 31: North America Market Y-o-Y Growth Comparison by Application, 2026-2036
- Figure 32: North America Market Attractiveness Analysis by Application
- Figure 33: North America Market Value Share and BPS Analysis by Distribution Channel, 2026 and 2036
- Figure 34: North America Market Y-o-Y Growth Comparison by Distribution Channel, 2026-2036
- Figure 35: North America Market Attractiveness Analysis by Distribution Channel
- Figure 36: Europe Market Value Share and BPS Analysis by Country, 2026 and 2036
- Figure 37: Europe Market Value Share and BPS Analysis by Form, 2026 and 2036
- Figure 38: Europe Market Y-o-Y Growth Comparison by Form, 2026-2036
- Figure 39: Europe Market Attractiveness Analysis by Form
- Figure 40: Europe Market Value Share and BPS Analysis by Seaweed Type, 2026 and 2036
- Figure 41: Europe Market Y-o-Y Growth Comparison by Seaweed Type, 2026-2036
- Figure 42: Europe Market Attractiveness Analysis by Seaweed Type
- Figure 43: Europe Market Value Share and BPS Analysis by Application, 2026 and 2036
- Figure 44: Europe Market Y-o-Y Growth Comparison by Application, 2026-2036
- Figure 45: Europe Market Attractiveness Analysis by Application
- Figure 46: Europe Market Value Share and BPS Analysis by Distribution Channel, 2026 and 2036
- Figure 47: Europe Market Y-o-Y Growth Comparison by Distribution Channel, 2026-2036
- Figure 48: Europe Market Attractiveness Analysis by Distribution Channel
- Figure 49: East Asia Market Value Share and BPS Analysis by Country, 2026 and 2036
- Figure 50: East Asia Market Value Share and BPS Analysis by Form, 2026 and 2036
- Figure 51: East Asia Market Y-o-Y Growth Comparison by Form, 2026-2036
- Figure 52: East Asia Market Attractiveness Analysis by Form
- Figure 53: East Asia Market Value Share and BPS Analysis by Seaweed Type, 2026 and 2036
- Figure 54: East Asia Market Y-o-Y Growth Comparison by Seaweed Type, 2026-2036
- Figure 55: East Asia Market Attractiveness Analysis by Seaweed Type
- Figure 56: East Asia Market Value Share and BPS Analysis by Application, 2026 and 2036
- Figure 57: East Asia Market Y-o-Y Growth Comparison by Application, 2026-2036
- Figure 58: East Asia Market Attractiveness Analysis by Application
- Figure 59: East Asia Market Value Share and BPS Analysis by Distribution Channel, 2026 and 2036
- Figure 60: East Asia Market Y-o-Y Growth Comparison by Distribution Channel, 2026-2036
- Figure 61: East Asia Market Attractiveness Analysis by Distribution Channel
- Figure 62: South Asia and Pacific Market Value Share and BPS Analysis by Country, 2026 and 2036
- Figure 63: South Asia and Pacific Market Value Share and BPS Analysis by Form, 2026 and 2036
- Figure 64: South Asia and Pacific Market Y-o-Y Growth Comparison by Form, 2026-2036
- Figure 65: South Asia and Pacific Market Attractiveness Analysis by Form
- Figure 66: South Asia and Pacific Market Value Share and BPS Analysis by Seaweed Type, 2026 and 2036
- Figure 67: South Asia and Pacific Market Y-o-Y Growth Comparison by Seaweed Type, 2026-2036
- Figure 68: South Asia and Pacific Market Attractiveness Analysis by Seaweed Type
- Figure 69: South Asia and Pacific Market Value Share and BPS Analysis by Application, 2026 and 2036
- Figure 70: South Asia and Pacific Market Y-o-Y Growth Comparison by Application, 2026-2036
- Figure 71: South Asia and Pacific Market Attractiveness Analysis by Application
- Figure 72: South Asia and Pacific Market Value Share and BPS Analysis by Distribution Channel, 2026 and 2036
- Figure 73: South Asia and Pacific Market Y-o-Y Growth Comparison by Distribution Channel, 2026-2036
- Figure 74: South Asia and Pacific Market Attractiveness Analysis by Distribution Channel
- Figure 75: Middle East and Africa Market Value Share and BPS Analysis by Country, 2026 and 2036
- Figure 76: Middle East and Africa Market Value Share and BPS Analysis by Form, 2026 and 2036
- Figure 77: Middle East and Africa Market Y-o-Y Growth Comparison by Form, 2026-2036
- Figure 78: Middle East and Africa Market Attractiveness Analysis by Form
- Figure 79: Middle East and Africa Market Value Share and BPS Analysis by Seaweed Type, 2026 and 2036
- Figure 80: Middle East and Africa Market Y-o-Y Growth Comparison by Seaweed Type, 2026-2036
- Figure 81: Middle East and Africa Market Attractiveness Analysis by Seaweed Type
- Figure 82: Middle East and Africa Market Value Share and BPS Analysis by Application, 2026 and 2036
- Figure 83: Middle East and Africa Market Y-o-Y Growth Comparison by Application, 2026-2036
- Figure 84: Middle East and Africa Market Attractiveness Analysis by Application
- Figure 85: Middle East and Africa Market Value Share and BPS Analysis by Distribution Channel, 2026 and 2036
- Figure 86: Middle East and Africa Market Y-o-Y Growth Comparison by Distribution Channel, 2026-2036
- Figure 87: Middle East and Africa Market Attractiveness Analysis by Distribution Channel
- Figure 88: Global Market - Tier Structure Analysis
- Figure 89: Global Market - Company Share Analysis
Frequently Asked Questions
How big is the sea moss market in 2026?
The global sea moss market is valued at USD 196.2 million in 2026, up from USD 180.0 million in 2025.
What is the forecast for the sea moss market?
The market is projected to reach USD 443.6 million by 2036, growing at a CAGR of 8.5% from 2026.
Which form of sea moss is growing fastest?
Gummies are projected to grow fastest, at 11.4% a year, while raw dried sea moss keeps the largest share at 30.0% in 2026.
Which seaweed type leads the sea moss market?
Golden sea moss from Eucheuma and Kappaphycus leads with 55.0% of 2026 revenue. Gracilaria is projected to grow fastest among the main types, at 9.0% a year.
Which country is the largest sea moss market?
The United States is the largest market, with 62.0% of global revenue in 2026. The United Kingdom follows with 9.0% and Canada with 6.0%.
Which countries are expected to grow fastest?
South Africa is projected to grow fastest among the ten largest markets, at 10.1% a year, followed by Germany and Australia at 9.6% each.
Why is online retail so important for sea moss?
Online retail accounts for 52.0% of 2026 revenue because most buyers discover sea moss through social media and buy from small brands that sell mainly online. Its share is projected to rise to 56.8% by 2036.
What are the main risks for sea moss suppliers?
The main risks are unproven health claims, variable iodine content, and contamination with heavy metals or microbes. Tighter food safety enforcement is likely to favor suppliers with tested, traceable supply.
Preview the report firsthand - request a free sample
Get SampleGet the brochure for pricing and purchase details.
Get PDF
