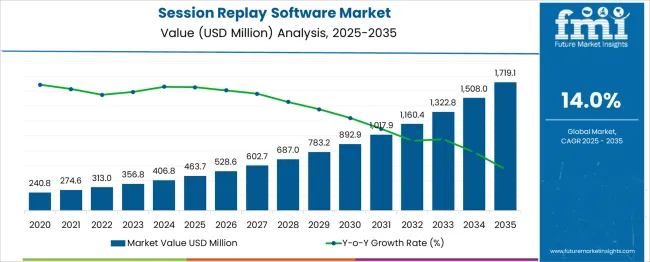
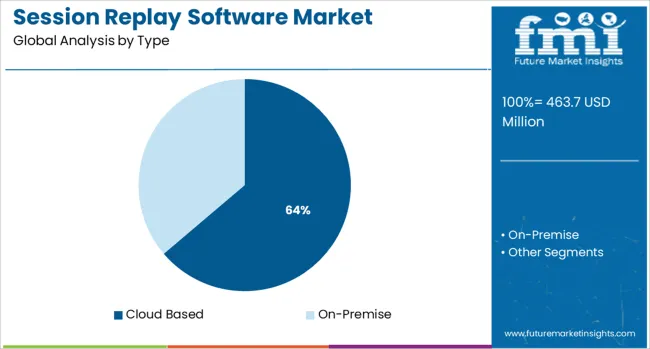
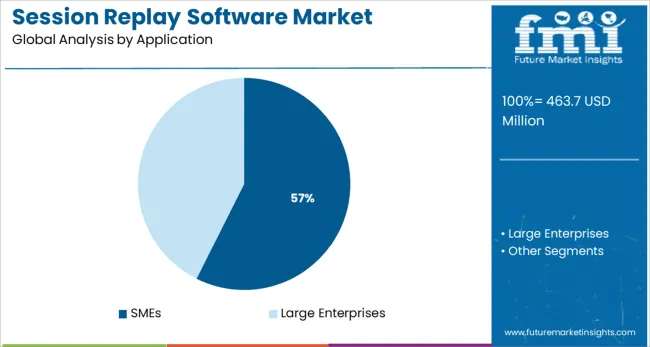
The session replay software market is valued at USD 463.7 million in 2025 and is expected to reach USD 1,719.1 million by 2035 at a CAGR of 14.0%. Growth is driven by rising adoption of digital experience optimization tools, increasing focus on conversion analytics, and the need for real-time visibility into user behavior across websites and applications. Cloud-based deployment accounts for 63.8% share in 2025, supported by flexible scaling, faster data processing, and easier integration with analytics and CRO platforms. SMEs lead the application segment with 57.4% share as smaller businesses increasingly invest in UX enhancement tools to improve customer journeys, reduce drop-offs, and optimize performance without large development teams.
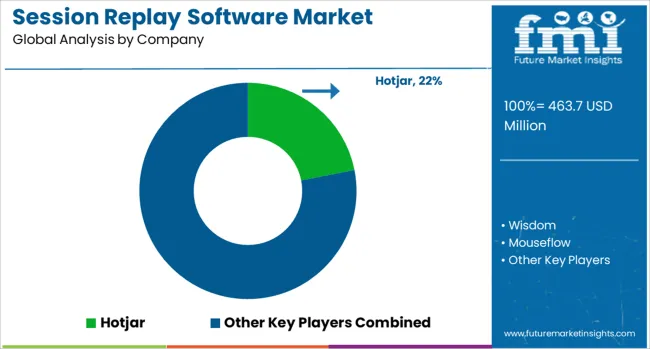
Global expansion continues as organizations shift toward data-backed decision-making and product teams adopt replay tools for rapid debugging, friction detection, and UX enhancements. North America, Asia-Pacific, and Europe remain the strongest contributors, fueled by widespread digitization and growing urgency to improve online user engagement. While concerns about data privacy, device performance impact, and time-consuming session analysis act as constraints, growing adoption of AI-driven filtering, heatmapping, and automated insight extraction strengthens market traction. Leading companies including Hotjar, FullStory, Mouseflow, Smartlook, and IBM Tealeaf are advancing session analysis capabilities, enabling more granular replay insights, precise issue detection, and improved customer experience optimization.

| Metric | Value |
|---|---|
| Session Replay Software Market Estimated Value in (2025 E) | USD 463.7 million |
| Session Replay Software Market Forecast Value in (2035 F) | USD 1719.1 million |
| Forecast CAGR (2025 to 2035) | 14.0% |

The cloud-based segment holds 63.8% share in 2025, driven by rising demand for flexible, scalable, and easily deployable solutions that support real-time session capture and analysis. Cloud deployment enables faster processing of large behavioral datasets and allows teams to access session videos and heatmaps from any location. As digital channels evolve rapidly, businesses prefer cloud architectures for their lower upfront costs, quick integration with analytics platforms, and enhanced collaboration features. Cloud-based software also supports advanced capabilities such as AI-driven tagging, automated anomaly detection, and real-time UX segmentation, strengthening its position as the preferred deployment model.

SMEs account for 57.4% share in 2025 due to increasing reliance on session replay solutions to identify user friction, improve website performance, and optimize conversion pathways. Smaller businesses often lack large UX research teams, making replay tools critical for diagnosing issues quickly without relying on extensive technical resources. SMEs use replay insights to refine product funnels, reduce customer churn, and enhance onboarding flows. Growing adoption of SaaS-based pricing models also makes these tools more accessible to smaller organizations. As competition intensifies across digital-first industries, SMEs continue to prioritize UX intelligence, securing the segment’s leading position throughout the forecast period.
A session replay is the exact repetition of a user's interactions on a web application or website to obtain as close to the user's experience as possible.
The demand for session replay software grew as it enabled companies to record swiping, clicking, tapping, scrolling, typing, mouse movements, and other actions taken by visitors. It's similar to seeing a movie of a user's actions on a website or in an app.
Small and large enterprises increasingly use session replay and recording software, propelling the session replay software market growth. Furthermore, the rising adoption of session replay software and technological improvements are expected to boost session replay software market statistics during the forecast period.
The session replay software market is anticipated to witness growth as these tools offer the quickest way to check whether the app's UI/UX serves the purpose or not. These insights guide companies to improve user experience and provide better functionalities.
The sales of session replay software are projected to rise as it provides faster issue resolution and app debugging. As a result, key players in the session replay software market can conduct user experience research without user feedback.
However, the session replay software market may get hampered as some session replay tools may affect user device performance. Furthermore, the session replay software market restraints include the time spent replaying each session without adequate filters and segments.
The sales of session replay software are anticipated to rise as it enables digital teams to see videos of real, anonymous consumers interacting with their websites or apps.
As a result, teams gain a first-hand look into the genuine issues that cause user dissatisfaction and derail user journeys with an 'over the shoulder' view. Due to these factors, the session replay software market share is anticipated to grow throughout the forecast period.
According to FMI analysts, over 90% of practitioners consider session replay to be effective to extremely successful for evaluating online experiences, which further boosts the adoption of session replay software.
The demand for session replay software is likely to grow as data-driven businesses are 23 times more likely to gain customers, 6 times more likely to keep customers, and 19 times more likely to be profitable.
Every insight is significant, whether quantitative user data from analytics platforms or qualitative user data from session replay. Key players across regions utilize this data to boost their session replay software market share.
With a CAGR of 13.9%, the cloud-based category is expected to dominate the session replay software market. With cloud-based software, data security has always been a concern that has yet to be resolved.
Cloud-based session replay software is used to analyze the customer experience, from visiting the website through conversion, and provide high-value and qualified insights into the UX of the website or app.
The sales of session replay software are anticipated to rise as it provides heatmaps that display aggregated information on user activity. Insights such as points where the user is clicking, which elements the user is concentrating on, and where the user is becoming annoyed.
Heatmaps paired with session replay software provide a thorough knowledge of user behavior, providing answers to all of the whys behind the user's activities within the app.
Heatmaps, for example, display the user's quit touches. Companies can view the user's actions before leaving the app with session recordings, which helps companies understand why they left and optimize the annoying portion of the screen. Due to these functionalities, the demand for session replay software is rising rapidly.
With a CAGR of 13.6%, the large enterprise segment is expected to dominate the session replay software market. Large enterprises are progressively embracing session replay software as a result of greater competition and rising demand for website and content optimization.
Session replay software can help firms eliminate data inaccuracies and maintain a competitive advantage. Furthermore, as large firms' technological capabilities develop, they are more driven to use session replay software to improve customer experience and resolve website difficulties.
| Regions | CAGR (2025 to 2035) |
|---|---|
| United States Market | 13.8% |
| United Kingdom Market | 13.0% |
| China Market | 13.4% |
| Japan Market | 12.6% |
| South Korea Market | 11.5% |
The USA is projected to dominate the session replay software market. The USA session replay software market size is estimated to reach USD 1719.1 Million by 2035 and increase at a CAGR of 13.8% percent during the forecast period.
Growing usage of session replay software, as well as the presence of a large number of major players in the region, are expected to fuel the USA session replay software market at a significant CAGR rate throughout the evaluation period.
China is estimated to register a CAGR of 13.4% and is expected to reach USD 80.2 Million by 2035. Furthermore, the UK session replay software market is expected to reach USD 48.9 Million by 2035, growing at a CAGR of 13.0 percent.
Other key markets in APAC (Japan and South Korea) are expected to increase at a rate of 12.6% and 11.5% during the forecast period, respectively.

Product launches, product approvals, and other organic growth tactics, such as patents and events, are being prioritized by several companies in the session replay software market. Acquisitions and partnerships & collaborations were two inorganic growth tactics seen in the session replay software market.
These initiatives have paved the road for session replay software market players to expand their business and client base. With the increased demand for session replay software, key players in the session replay software market may expect attractive growth prospects in the future.
Recent Developments in the Session Replay Software Market
The global session replay software market is estimated to be valued at USD 463.7 million in 2025.
The market size for the session replay software market is projected to reach USD 1,719.1 million by 2035.
The session replay software market is expected to grow at a 14.0% CAGR between 2025 and 2035.
The key product types in session replay software market are cloud based and on-premise.
In terms of application, smes segment to command 57.4% share in the session replay software market in 2025.


Our Research Products

The "Full Research Suite" delivers actionable market intel, deep dives on markets or technologies, so clients act faster, cut risk, and unlock growth.

The Leaderboard benchmarks and ranks top vendors, classifying them as Established Leaders, Leading Challengers, or Disruptors & Challengers.

Locates where complements amplify value and substitutes erode it, forecasting net impact by horizon

We deliver granular, decision-grade intel: market sizing, 5-year forecasts, pricing, adoption, usage, revenue, and operational KPIs—plus competitor tracking, regulation, and value chains—across 60 countries broadly.

Spot the shifts before they hit your P&L. We track inflection points, adoption curves, pricing moves, and ecosystem plays to show where demand is heading, why it is changing, and what to do next across high-growth markets and disruptive tech

Real-time reads of user behavior. We track shifting priorities, perceptions of today’s and next-gen services, and provider experience, then pace how fast tech moves from trial to adoption, blending buyer, consumer, and channel inputs with social signals (#WhySwitch, #UX).

Partner with our analyst team to build a custom report designed around your business priorities. From analysing market trends to assessing competitors or crafting bespoke datasets, we tailor insights to your needs.
Supplier Intelligence
Discovery & Profiling
Capacity & Footprint
Performance & Risk
Compliance & Governance
Commercial Readiness
Who Supplies Whom
Scorecards & Shortlists
Playbooks & Docs
Category Intelligence
Definition & Scope
Demand & Use Cases
Cost Drivers
Market Structure
Supply Chain Map
Trade & Policy
Operating Norms
Deliverables
Buyer Intelligence
Account Basics
Spend & Scope
Procurement Model
Vendor Requirements
Terms & Policies
Entry Strategy
Pain Points & Triggers
Outputs
Pricing Analysis
Benchmarks
Trends
Should-Cost
Indexation
Landed Cost
Commercial Terms
Deliverables
Brand Analysis
Positioning & Value Prop
Share & Presence
Customer Evidence
Go-to-Market
Digital & Reputation
Compliance & Trust
KPIs & Gaps
Outputs
Full Research Suite comprises of:
Market outlook & trends analysis
Interviews & case studies
Strategic recommendations
Vendor profiles & capabilities analysis
5-year forecasts
8 regions and 60+ country-level data splits
Market segment data splits
12 months of continuous data updates
DELIVERED AS:
PDF EXCEL ONLINE
SBCs – Securing IoT & VoIP Networks Globally
Session Initiation Protocol (SIP) Trunk Market
Software-Defined Wide Area Network Market Size and Share Forecast Outlook 2025 to 2035
Software Defined Vehicle Market Size and Share Forecast Outlook 2025 to 2035
Software Defined Networking (SDN) And Network Function Virtualization (NFV) Market Size and Share Forecast Outlook 2025 to 2035
Software Defined Perimeter (SDP) Market Size and Share Forecast Outlook 2025 to 2035
Software-Defined Wide Area Network SD-WAN Market Size and Share Forecast Outlook 2025 to 2035
Software Defined Radio (SDR) Market Size and Share Forecast Outlook 2025 to 2035
Software License Management (SLM) Market Size and Share Forecast Outlook 2025 to 2035
Software-Defined Networking SDN Market Size and Share Forecast Outlook 2025 to 2035
Software-Defined Anything (SDx) Market Size and Share Forecast Outlook 2025 to 2035
Software-Defined Data Center Market Size and Share Forecast Outlook 2025 to 2035
Software Containers Market Size and Share Forecast Outlook 2025 to 2035
Software Defined Application And Infrastructure Market Size and Share Forecast Outlook 2025 to 2035
Software Defined Networking Market Size and Share Forecast Outlook 2025 to 2035
Software-Defined Camera (SDC) Market Size and Share Forecast Outlook 2025 to 2035
Examining Market Share Trends in the Software Distribution Industry
Software Distribution Market Analysis by Deployment Type, by Organization Size and by Industry Vertical Through 2035
Software Defined Video Networking Market
UK Software Distribution Market Analysis – Size & Industry Trends 2025-2035

Thank you!
You will receive an email from our Business Development Manager. Please be sure to check your SPAM/JUNK folder too.
Chat With
MaRIA