Smart Stadium Market Size and Share Forecast Outlook 2025 to 2035

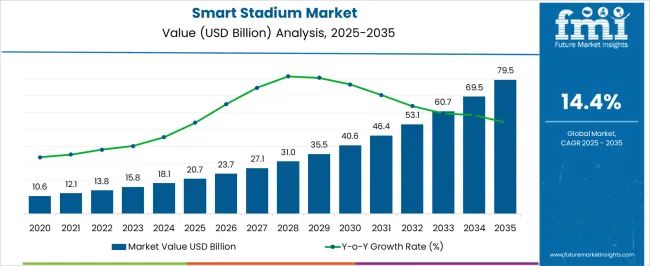
The Smart Stadium Market is estimated to be valued at USD 20.7 billion in 2025 and is projected to reach USD 79.5 billion by 2035, registering a compound annual growth rate (CAGR) of 14.4% over the forecast period.
Quick Stats for Smart Stadium Market

  • Smart Stadium Market Value (2025): USD 20.7 billion
  • Smart Stadium Market Forecast Value (2035): USD 79.5 billion
  • Smart Stadium Market Forecast CAGR: 14.4%
  • Leading Segment in Smart Stadium Market in 2025: Software (18.5%)
  • Key Growth Regions in Smart Stadium Market: North America, Asia-Pacific, Europe
  • Top Key Players in Smart Stadium Market: Cisco Systems, Inc., Fujitsu, GP Smart Stadium, Huawei Technologies Co., Ltd., IBM Corporation, Intel Corporation, Mapsted Corp., NEC Corporation, Johnson Controls, NXP Semiconductors, Schneider Electric, Telefonaktiebolaget LM Ericsson, CommScope Holding Company, Inc

Smart Stadium Market Market Value Analysis

Smart Stadium Market Key Takeaways

Metric Value
Smart Stadium Market Estimated Value in (2025 E) USD 20.7 billion
Smart Stadium Market Forecast Value in (2035 F) USD 79.5 billion
Forecast CAGR (2025 to 2035) 14.4%

Why is the Smart Stadium Market Growing?

The Smart Stadium market is experiencing notable growth, driven by increasing investments in technology-enabled sports and entertainment facilities that enhance fan engagement, safety, and operational efficiency. Rising adoption of digital solutions such as IoT sensors, AI-powered analytics, and real-time monitoring platforms is enabling stadium operators to improve crowd management, optimize resource allocation, and deliver personalized fan experiences. The integration of smart lighting, connected seating, and mobile applications is further enhancing the overall stadium experience.

Growing demand for enhanced security measures, operational efficiency, and energy management is motivating stadium owners to implement intelligent solutions. Cloud-based and on-premises deployment options allow organizations to select systems that align with operational requirements and budget constraints.

Additionally, the rise of sports tourism, international events, and multi-purpose stadium use is accelerating market adoption As stadium operators prioritize scalable, data-driven solutions to improve revenue streams, fan engagement, and operational management, the Smart Stadium market is expected to witness sustained growth over the coming decade.

Segmental Analysis

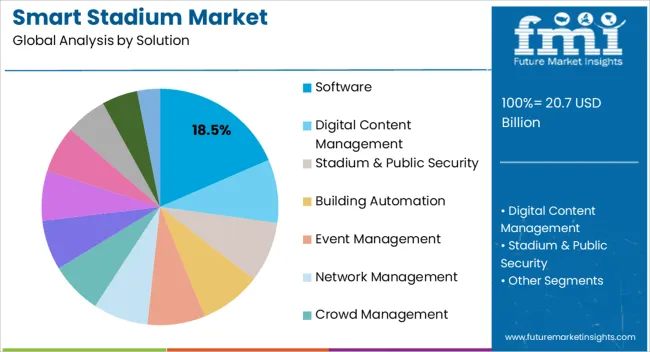
The smart stadium market is segmented by solution, deployment, and geographic regions. By solution, smart stadium market is divided into Software, Digital Content Management, Stadium & Public Security, Building Automation, Event Management, Network Management, Crowd Management, Services, Professional Services, Consulting, Deployment & Integration, Support & Maintenance, and Managed Services. In terms of deployment, smart stadium market is classified into On-Premises and On-Cloud. Regionally, the smart stadium industry is classified into North America, Latin America, Western Europe, Eastern Europe, Balkan & Baltic Countries, Russia & Belarus, Central Asia, East Asia, South Asia & Pacific, and the Middle East & Africa.
Insights into the Software Solution Segment

Smart Stadium Market Analysis By Solution

The software solution segment is projected to hold 18.5% of the Smart Stadium market revenue in 2025, establishing it as a leading component type. Growth is being driven by the increasing adoption of intelligent platforms that enable real-time monitoring, analytics, and integration with stadium infrastructure. Software solutions facilitate operational management, fan engagement, and security monitoring without requiring extensive hardware upgrades.

These platforms allow stadium operators to implement AI-powered crowd control, ticketing analytics, and predictive maintenance, improving efficiency and minimizing operational risks. Integration with mobile applications and IoT devices enhances the delivery of personalized experiences to spectators while ensuring safety and compliance with regulatory standards.

The ability to scale software solutions across multiple facilities and upgrade functionalities through updates without major capital expenditure further supports adoption As stadium operators seek enhanced operational efficiency, improved fan experiences, and actionable insights from large volumes of data, the software solution segment is expected to maintain a strong position in the market, supported by innovation and digital transformation initiatives.
Insights into the On-Premises Deployment Segment

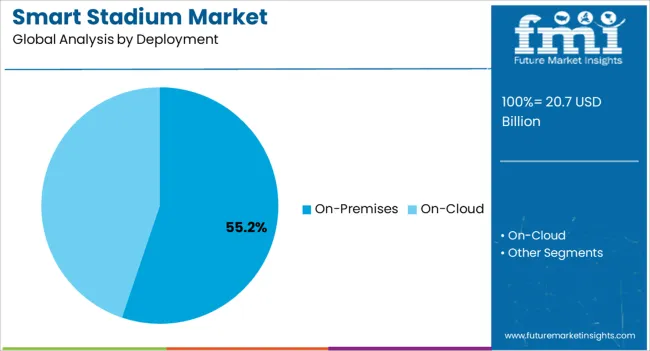
Smart Stadium Market Analysis By Deployment

The on-premises deployment segment is anticipated to account for 55.2% of the Smart Stadium market revenue in 2025, making it the leading deployment model. Its growth is driven by the need for greater control over sensitive operational data, network security, and compliance with regulations governing large venues.

On-premises deployment enables organizations to integrate existing IT infrastructure, reduce latency for real-time analytics, and ensure uninterrupted operations during high-demand events. The ability to customize software and hardware solutions according to the unique layout, capacity, and operational requirements of stadiums enhances the adoption of on-premises systems.

Additionally, this deployment approach allows seamless integration with security monitoring, ticketing, and facility management platforms, providing operators with centralized control and real-time decision-making capabilities As demand for high-performance, reliable, and secure smart stadium solutions increases, on-premises deployment is expected to remain the preferred choice for operators who prioritize data sovereignty, operational efficiency, and customization, reinforcing its leading revenue share in the market.

Market Overview

Smart Stadium Market Overview

From last couple of decades, stadiums have seen increasing demand from sports and entertainment sector. The increasing demand, in turn, increases the number of viewers in the stadium.

Crowd management is the major factor of concern for the stadium managers. The introduction of a smart stadium, curtail many of these problems.

Generally, a smart stadium comprises of a large number of sensors, cameras, and digital signs, which are being connected to wired and wireless networks and servers.These sensors provide real-time information about empty parking spots, waiting lines, a number of vacant seats and other useful information.

Additionally, with the help of advanced technology, the smart stadium now can predict the uncertain whether condition and provide early planning of entry and exit point in case of any chaos.Moreover, viewers now can order their meals by seating on their seats, with the help of their smartphones by connecting it to stadium server.

The number of advantages coupled with safety and security provided by smart stadium has led increasing demand for smart stadium and is expected to show significant growth over the forecast period.

Advanced technologies and increasingly digital world is forcing the sports industry and sport stadiums to adapt Internet of Things (IoT) and this adoption can bridge gap between digital space and the physical world.

Teams are focusing on few main areas to utilize IoT in today’s world to address specific needs or challenges. Integration of IoT in smart stadiums increases the revenue streams, enhance fan experience, provide real-time personalization and increase venue efficiency.
Analysis of Smart Stadium Market By Key Countries

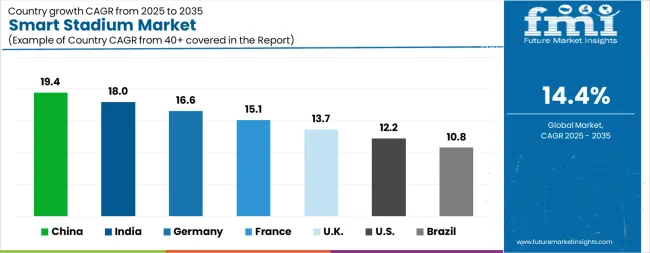
Smart Stadium Market Cagr Analysis By Country

Country CAGR
China 19.4%
India 18.0%
Germany 16.6%
France 15.1%
UK 13.7%
USA 12.2%
Brazil 10.8%

Country-wise Analysis

The Smart Stadium Market is expected to register a CAGR of 14.4% during the forecast period, exhibiting varied country level momentum. China leads with the highest CAGR of 19.4%, followed by India at 18.0%. Developed markets such as Germany, France, and the UK continue to expand steadily, while the USA is likely to grow at consistent rates. Brazil posts the lowest CAGR at 10.8%, yet still underscores a broadly positive trajectory for the global Smart Stadium Market. In 2024, Germany held a dominant revenue in the Western Europe market and is expected to grow with a CAGR of 16.6%. The USA Smart Stadium Market is estimated to be valued at USD 7.6 billion in 2025 and is anticipated to reach a valuation of USD 24.2 billion by 2035. Sales are projected to rise at a CAGR of 12.2% over the forecast period between 2025 and 2035. While Japan and South Korea markets are estimated to be valued at USD 1.0 billion and USD 718.6 million respectively in 2025.
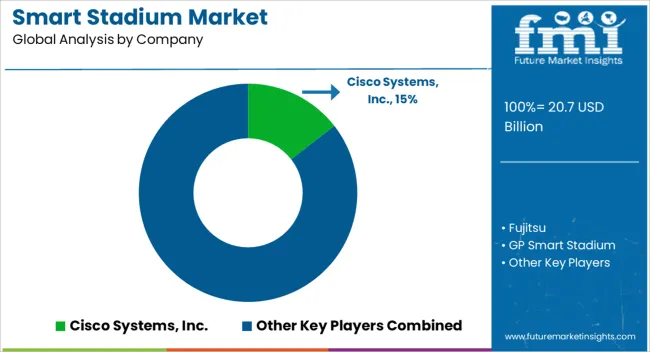
Key Players in the Smart Stadium Market

Smart Stadium Market Analysis By Company

  • Cisco Systems, Inc.
  • Fujitsu
  • GP Smart Stadium
  • Huawei Technologies Co., Ltd.
  • IBM Corporation
  • Intel Corporation
  • Mapsted Corp.
  • NEC Corporation
  • Johnson Controls
  • NXP Semiconductors
  • Schneider Electric
  • Telefonaktiebolaget LM Ericsson
  • CommScope Holding Company, Inc

Scope of the Report

Item Value
Quantitative Units USD 20.7 Billion
Solution Software, Digital Content Management, Stadium & Public Security, Building Automation, Event Management, Network Management, Crowd Management, Services, Professional Services, Consulting, Deployment & Integration, Support & Maintenance, and Managed Services
Deployment On-Premises and On-Cloud
Regions Covered North America, Europe, Asia-Pacific, Latin America, Middle East & Africa
Country Covered United States, Canada, Germany, France, United Kingdom, China, Japan, India, Brazil, South Africa
Key Companies Profiled Cisco Systems, Inc., Fujitsu, GP Smart Stadium, Huawei Technologies Co., Ltd., IBM Corporation, Intel Corporation, Mapsted Corp., NEC Corporation, Johnson Controls, NXP Semiconductors, Schneider Electric, Telefonaktiebolaget LM Ericsson, and CommScope Holding Company, Inc

Smart Stadium Market by Segments

Solution:

  • Software
  • Digital Content Management
  • Stadium & Public Security
  • Building Automation
  • Event Management
  • Network Management
  • Crowd Management
  • Services
  • Professional Services
  • Consulting
  • Deployment & Integration
  • Support & Maintenance
  • Managed Services

Deployment:

  • On-Premises
  • On-Cloud

Region:

  • North America
    • USA
    • Canada
    • Mexico
  • Latin America
    • Brazil
    • Chile
    • Rest of Latin America
  • Western Europe
    • Germany
    • UK
    • Italy
    • Spain
    • France
    • Nordic
    • BENELUX
    • Rest of Western Europe
  • Eastern Europe
    • Russia
    • Poland
    • Hungary
    • Balkan & Baltic
    • Rest of Eastern Europe
  • East Asia
    • China
    • Japan
    • South Korea
  • South Asia and Pacific
    • India
    • ASEAN
    • Australia & New Zealand
    • Rest of South Asia and Pacific
  • Middle East & Africa
    • Kingdom of Saudi Arabia
    • Other GCC Countries
    • Turkiye
    • South Africa
    • Other African Union
    • Rest of Middle East & Africa

Frequently Asked Questions

How big is the smart stadium market in 2025?

The global smart stadium market is estimated to be valued at USD 20.7 billion in 2025.

What will be the size of smart stadium market in 2035?

The market size for the smart stadium market is projected to reach USD 79.5 billion by 2035.

How much will be the smart stadium market growth between 2025 and 2035?

The smart stadium market is expected to grow at a 14.4% CAGR between 2025 and 2035.

What are the key product types in the smart stadium market?

The key product types in smart stadium market are software, digital content management, stadium & public security, building automation, event management, network management, crowd management, services, professional services, consulting, deployment & integration, support & maintenance and managed services.

Which deployment segment to contribute significant share in the smart stadium market in 2025?

In terms of deployment, on-premises segment to command 55.2% share in the smart stadium market in 2025.

Table of Content

  1. Executive Summary
    • Global Market Outlook
    • Demand-side Trends
    • Supply-side Trends
    • Technology Roadmap Analysis
    • Analysis and Recommendations
  2. Market Overview
    • Market Coverage / Taxonomy
    • Market Definition / Scope / Limitations
  3. Market Background
    • Market Dynamics
      • Drivers
      • Restraints
      • Opportunity
      • Trends
    • Scenario Forecast
      • Demand in Optimistic Scenario
      • Demand in Likely Scenario
      • Demand in Conservative Scenario
    • Opportunity Map Analysis
    • Product Life Cycle Analysis
    • Supply Chain Analysis
    • Investment Feasibility Matrix
    • Value Chain Analysis
    • PESTLE and Porter’s Analysis
    • Regulatory Landscape
    • Regional Parent Market Outlook
    • Production and Consumption Statistics
    • Import and Export Statistics
  4. Global Market Analysis 2020 to 2024 and Forecast, 2025 to 2035
    • Historical Market Size Value (USD Million) Analysis, 2020 to 2024
    • Current and Future Market Size Value (USD Million) Projections, 2025 to 2035
      • Y-o-Y Growth Trend Analysis
      • Absolute $ Opportunity Analysis
  5. Global Market Pricing Analysis 2020 to 2024 and Forecast 2025 to 2035
  6. Global Market Analysis 2020 to 2024 and Forecast 2025 to 2035, By Solution
    • Introduction / Key Findings
    • Historical Market Size Value (USD Million) Analysis By Solution , 2020 to 2024
    • Current and Future Market Size Value (USD Million) Analysis and Forecast By Solution , 2025 to 2035
      • Software
      • Digital Content Management
      • Stadium & Public Security
      • Building Automation
      • Event Management
      • Network Management
      • Crowd Management
      • Services
      • Professional Services
      • Consulting
      • Deployment & Integration
    • Y-o-Y Growth Trend Analysis By Solution , 2020 to 2024
    • Absolute $ Opportunity Analysis By Solution , 2025 to 2035
  7. Global Market Analysis 2020 to 2024 and Forecast 2025 to 2035, By Deployment
    • Introduction / Key Findings
    • Historical Market Size Value (USD Million) Analysis By Deployment, 2020 to 2024
    • Current and Future Market Size Value (USD Million) Analysis and Forecast By Deployment, 2025 to 2035
      • On-Premises
      • On-Cloud
    • Y-o-Y Growth Trend Analysis By Deployment, 2020 to 2024
    • Absolute $ Opportunity Analysis By Deployment, 2025 to 2035
  8. Global Market Analysis 2020 to 2024 and Forecast 2025 to 2035, By Region
    • Introduction
    • Historical Market Size Value (USD Million) Analysis By Region, 2020 to 2024
    • Current Market Size Value (USD Million) Analysis and Forecast By Region, 2025 to 2035
      • North America
      • Latin America
      • Western Europe
      • Eastern Europe
      • East Asia
      • South Asia and Pacific
      • Middle East & Africa
    • Market Attractiveness Analysis By Region
  9. North America Market Analysis 2020 to 2024 and Forecast 2025 to 2035, By Country
    • Historical Market Size Value (USD Million) Trend Analysis By Market Taxonomy, 2020 to 2024
    • Market Size Value (USD Million) Forecast By Market Taxonomy, 2025 to 2035
      • By Country
        • USA
        • Canada
        • Mexico
      • By Solution
      • By Deployment
    • Market Attractiveness Analysis
      • By Country
      • By Solution
      • By Deployment
    • Key Takeaways
  10. Latin America Market Analysis 2020 to 2024 and Forecast 2025 to 2035, By Country
    • Historical Market Size Value (USD Million) Trend Analysis By Market Taxonomy, 2020 to 2024
    • Market Size Value (USD Million) Forecast By Market Taxonomy, 2025 to 2035
      • By Country
        • Brazil
        • Chile
        • Rest of Latin America
      • By Solution
      • By Deployment
    • Market Attractiveness Analysis
      • By Country
      • By Solution
      • By Deployment
    • Key Takeaways
  11. Western Europe Market Analysis 2020 to 2024 and Forecast 2025 to 2035, By Country
    • Historical Market Size Value (USD Million) Trend Analysis By Market Taxonomy, 2020 to 2024
    • Market Size Value (USD Million) Forecast By Market Taxonomy, 2025 to 2035
      • By Country
        • Germany
        • UK
        • Italy
        • Spain
        • France
        • Nordic
        • BENELUX
        • Rest of Western Europe
      • By Solution
      • By Deployment
    • Market Attractiveness Analysis
      • By Country
      • By Solution
      • By Deployment
    • Key Takeaways
  12. Eastern Europe Market Analysis 2020 to 2024 and Forecast 2025 to 2035, By Country
    • Historical Market Size Value (USD Million) Trend Analysis By Market Taxonomy, 2020 to 2024
    • Market Size Value (USD Million) Forecast By Market Taxonomy, 2025 to 2035
      • By Country
        • Russia
        • Poland
        • Hungary
        • Balkan & Baltic
        • Rest of Eastern Europe
      • By Solution
      • By Deployment
    • Market Attractiveness Analysis
      • By Country
      • By Solution
      • By Deployment
    • Key Takeaways
  13. East Asia Market Analysis 2020 to 2024 and Forecast 2025 to 2035, By Country
    • Historical Market Size Value (USD Million) Trend Analysis By Market Taxonomy, 2020 to 2024
    • Market Size Value (USD Million) Forecast By Market Taxonomy, 2025 to 2035
      • By Country
        • China
        • Japan
        • South Korea
      • By Solution
      • By Deployment
    • Market Attractiveness Analysis
      • By Country
      • By Solution
      • By Deployment
    • Key Takeaways
  14. South Asia and Pacific Market Analysis 2020 to 2024 and Forecast 2025 to 2035, By Country
    • Historical Market Size Value (USD Million) Trend Analysis By Market Taxonomy, 2020 to 2024
    • Market Size Value (USD Million) Forecast By Market Taxonomy, 2025 to 2035
      • By Country
        • India
        • ASEAN
        • Australia & New Zealand
        • Rest of South Asia and Pacific
      • By Solution
      • By Deployment
    • Market Attractiveness Analysis
      • By Country
      • By Solution
      • By Deployment
    • Key Takeaways
  15. Middle East & Africa Market Analysis 2020 to 2024 and Forecast 2025 to 2035, By Country
    • Historical Market Size Value (USD Million) Trend Analysis By Market Taxonomy, 2020 to 2024
    • Market Size Value (USD Million) Forecast By Market Taxonomy, 2025 to 2035
      • By Country
        • Kingdom of Saudi Arabia
        • Other GCC Countries
        • Turkiye
        • South Africa
        • Other African Union
        • Rest of Middle East & Africa
      • By Solution
      • By Deployment
    • Market Attractiveness Analysis
      • By Country
      • By Solution
      • By Deployment
    • Key Takeaways
  16. Key Countries Market Analysis
    • USA
      • Pricing Analysis
      • Market Share Analysis, 2024
        • By Solution
        • By Deployment
    • Canada
      • Pricing Analysis
      • Market Share Analysis, 2024
        • By Solution
        • By Deployment
    • Mexico
      • Pricing Analysis
      • Market Share Analysis, 2024
        • By Solution
        • By Deployment
    • Brazil
      • Pricing Analysis
      • Market Share Analysis, 2024
        • By Solution
        • By Deployment
    • Chile
      • Pricing Analysis
      • Market Share Analysis, 2024
        • By Solution
        • By Deployment
    • Germany
      • Pricing Analysis
      • Market Share Analysis, 2024
        • By Solution
        • By Deployment
    • UK
      • Pricing Analysis
      • Market Share Analysis, 2024
        • By Solution
        • By Deployment
    • Italy
      • Pricing Analysis
      • Market Share Analysis, 2024
        • By Solution
        • By Deployment
    • Spain
      • Pricing Analysis
      • Market Share Analysis, 2024
        • By Solution
        • By Deployment
    • France
      • Pricing Analysis
      • Market Share Analysis, 2024
        • By Solution
        • By Deployment
    • India
      • Pricing Analysis
      • Market Share Analysis, 2024
        • By Solution
        • By Deployment
    • ASEAN
      • Pricing Analysis
      • Market Share Analysis, 2024
        • By Solution
        • By Deployment
    • Australia & New Zealand
      • Pricing Analysis
      • Market Share Analysis, 2024
        • By Solution
        • By Deployment
    • China
      • Pricing Analysis
      • Market Share Analysis, 2024
        • By Solution
        • By Deployment
    • Japan
      • Pricing Analysis
      • Market Share Analysis, 2024
        • By Solution
        • By Deployment
    • South Korea
      • Pricing Analysis
      • Market Share Analysis, 2024
        • By Solution
        • By Deployment
    • Russia
      • Pricing Analysis
      • Market Share Analysis, 2024
        • By Solution
        • By Deployment
    • Poland
      • Pricing Analysis
      • Market Share Analysis, 2024
        • By Solution
        • By Deployment
    • Hungary
      • Pricing Analysis
      • Market Share Analysis, 2024
        • By Solution
        • By Deployment
    • Kingdom of Saudi Arabia
      • Pricing Analysis
      • Market Share Analysis, 2024
        • By Solution
        • By Deployment
    • Turkiye
      • Pricing Analysis
      • Market Share Analysis, 2024
        • By Solution
        • By Deployment
    • South Africa
      • Pricing Analysis
      • Market Share Analysis, 2024
        • By Solution
        • By Deployment
  17. Market Structure Analysis
    • Competition Dashboard
    • Competition Benchmarking
    • Market Share Analysis of Top Players
      • By Regional
      • By Solution
      • By Deployment
  18. Competition Analysis
    • Competition Deep Dive
      • Cisco Systems, Inc.
        • Overview
        • Product Portfolio
        • Profitability by Market Segments (Product/Age /Sales Channel/Region)
        • Sales Footprint
        • Strategy Overview
          • Marketing Strategy
          • Product Strategy
          • Channel Strategy
      • Fujitsu
      • GP Smart Stadium
      • Huawei Technologies Co., Ltd.
      • IBM Corporation
      • Intel Corporation
      • Mapsted Corp.
      • NEC Corporation
      • Johnson Controls
      • NXP Semiconductors
      • Schneider Electric
      • Telefonaktiebolaget LM Ericsson
      • CommScope Holding Company, Inc
  19. Assumptions & Acronyms Used
  20. Research Methodology

List of Tables

  • Table 1: Global Market Value (USD Million) Forecast by Region, 2020 to 2035
  • Table 2: Global Market Value (USD Million) Forecast by Solution , 2020 to 2035
  • Table 3: Global Market Value (USD Million) Forecast by Deployment, 2020 to 2035
  • Table 4: North America Market Value (USD Million) Forecast by Country, 2020 to 2035
  • Table 5: North America Market Value (USD Million) Forecast by Solution , 2020 to 2035
  • Table 6: North America Market Value (USD Million) Forecast by Deployment, 2020 to 2035
  • Table 7: Latin America Market Value (USD Million) Forecast by Country, 2020 to 2035
  • Table 8: Latin America Market Value (USD Million) Forecast by Solution , 2020 to 2035
  • Table 9: Latin America Market Value (USD Million) Forecast by Deployment, 2020 to 2035
  • Table 10: Western Europe Market Value (USD Million) Forecast by Country, 2020 to 2035
  • Table 11: Western Europe Market Value (USD Million) Forecast by Solution , 2020 to 2035
  • Table 12: Western Europe Market Value (USD Million) Forecast by Deployment, 2020 to 2035
  • Table 13: Eastern Europe Market Value (USD Million) Forecast by Country, 2020 to 2035
  • Table 14: Eastern Europe Market Value (USD Million) Forecast by Solution , 2020 to 2035
  • Table 15: Eastern Europe Market Value (USD Million) Forecast by Deployment, 2020 to 2035
  • Table 16: East Asia Market Value (USD Million) Forecast by Country, 2020 to 2035
  • Table 17: East Asia Market Value (USD Million) Forecast by Solution , 2020 to 2035
  • Table 18: East Asia Market Value (USD Million) Forecast by Deployment, 2020 to 2035
  • Table 19: South Asia and Pacific Market Value (USD Million) Forecast by Country, 2020 to 2035
  • Table 20: South Asia and Pacific Market Value (USD Million) Forecast by Solution , 2020 to 2035
  • Table 21: South Asia and Pacific Market Value (USD Million) Forecast by Deployment, 2020 to 2035
  • Table 22: Middle East & Africa Market Value (USD Million) Forecast by Country, 2020 to 2035
  • Table 23: Middle East & Africa Market Value (USD Million) Forecast by Solution , 2020 to 2035
  • Table 24: Middle East & Africa Market Value (USD Million) Forecast by Deployment, 2020 to 2035

List of Figures

  • Figure 1: Global Market Pricing Analysis
  • Figure 2: Global Market Value (USD Million) Forecast 2020 to 2035
  • Figure 3: Global Market Value Share and BPS Analysis by Solution , 2025 and 2035
  • Figure 4: Global Market Y-o-Y Growth Comparison by Solution , 2025 to 2035
  • Figure 5: Global Market Attractiveness Analysis by Solution
  • Figure 6: Global Market Value Share and BPS Analysis by Deployment, 2025 and 2035
  • Figure 7: Global Market Y-o-Y Growth Comparison by Deployment, 2025 to 2035
  • Figure 8: Global Market Attractiveness Analysis by Deployment
  • Figure 9: Global Market Value (USD Million) Share and BPS Analysis by Region, 2025 and 2035
  • Figure 10: Global Market Y-o-Y Growth Comparison by Region, 2025 to 2035
  • Figure 11: Global Market Attractiveness Analysis by Region
  • Figure 12: North America Market Incremental Dollar Opportunity, 2025 to 2035
  • Figure 13: Latin America Market Incremental Dollar Opportunity, 2025 to 2035
  • Figure 14: Western Europe Market Incremental Dollar Opportunity, 2025 to 2035
  • Figure 15: Eastern Europe Market Incremental Dollar Opportunity, 2025 to 2035
  • Figure 16: East Asia Market Incremental Dollar Opportunity, 2025 to 2035
  • Figure 17: South Asia and Pacific Market Incremental Dollar Opportunity, 2025 to 2035
  • Figure 18: Middle East & Africa Market Incremental Dollar Opportunity, 2025 to 2035
  • Figure 19: North America Market Value Share and BPS Analysis by Country, 2025 and 2035
  • Figure 20: North America Market Value Share and BPS Analysis by Solution , 2025 and 2035
  • Figure 21: North America Market Y-o-Y Growth Comparison by Solution , 2025 to 2035
  • Figure 22: North America Market Attractiveness Analysis by Solution
  • Figure 23: North America Market Value Share and BPS Analysis by Deployment, 2025 and 2035
  • Figure 24: North America Market Y-o-Y Growth Comparison by Deployment, 2025 to 2035
  • Figure 25: North America Market Attractiveness Analysis by Deployment
  • Figure 26: Latin America Market Value Share and BPS Analysis by Country, 2025 and 2035
  • Figure 27: Latin America Market Value Share and BPS Analysis by Solution , 2025 and 2035
  • Figure 28: Latin America Market Y-o-Y Growth Comparison by Solution , 2025 to 2035
  • Figure 29: Latin America Market Attractiveness Analysis by Solution
  • Figure 30: Latin America Market Value Share and BPS Analysis by Deployment, 2025 and 2035
  • Figure 31: Latin America Market Y-o-Y Growth Comparison by Deployment, 2025 to 2035
  • Figure 32: Latin America Market Attractiveness Analysis by Deployment
  • Figure 33: Western Europe Market Value Share and BPS Analysis by Country, 2025 and 2035
  • Figure 34: Western Europe Market Value Share and BPS Analysis by Solution , 2025 and 2035
  • Figure 35: Western Europe Market Y-o-Y Growth Comparison by Solution , 2025 to 2035
  • Figure 36: Western Europe Market Attractiveness Analysis by Solution
  • Figure 37: Western Europe Market Value Share and BPS Analysis by Deployment, 2025 and 2035
  • Figure 38: Western Europe Market Y-o-Y Growth Comparison by Deployment, 2025 to 2035
  • Figure 39: Western Europe Market Attractiveness Analysis by Deployment
  • Figure 40: Eastern Europe Market Value Share and BPS Analysis by Country, 2025 and 2035
  • Figure 41: Eastern Europe Market Value Share and BPS Analysis by Solution , 2025 and 2035
  • Figure 42: Eastern Europe Market Y-o-Y Growth Comparison by Solution , 2025 to 2035
  • Figure 43: Eastern Europe Market Attractiveness Analysis by Solution
  • Figure 44: Eastern Europe Market Value Share and BPS Analysis by Deployment, 2025 and 2035
  • Figure 45: Eastern Europe Market Y-o-Y Growth Comparison by Deployment, 2025 to 2035
  • Figure 46: Eastern Europe Market Attractiveness Analysis by Deployment
  • Figure 47: East Asia Market Value Share and BPS Analysis by Country, 2025 and 2035
  • Figure 48: East Asia Market Value Share and BPS Analysis by Solution , 2025 and 2035
  • Figure 49: East Asia Market Y-o-Y Growth Comparison by Solution , 2025 to 2035
  • Figure 50: East Asia Market Attractiveness Analysis by Solution
  • Figure 51: East Asia Market Value Share and BPS Analysis by Deployment, 2025 and 2035
  • Figure 52: East Asia Market Y-o-Y Growth Comparison by Deployment, 2025 to 2035
  • Figure 53: East Asia Market Attractiveness Analysis by Deployment
  • Figure 54: South Asia and Pacific Market Value Share and BPS Analysis by Country, 2025 and 2035
  • Figure 55: South Asia and Pacific Market Value Share and BPS Analysis by Solution , 2025 and 2035
  • Figure 56: South Asia and Pacific Market Y-o-Y Growth Comparison by Solution , 2025 to 2035
  • Figure 57: South Asia and Pacific Market Attractiveness Analysis by Solution
  • Figure 58: South Asia and Pacific Market Value Share and BPS Analysis by Deployment, 2025 and 2035
  • Figure 59: South Asia and Pacific Market Y-o-Y Growth Comparison by Deployment, 2025 to 2035
  • Figure 60: South Asia and Pacific Market Attractiveness Analysis by Deployment
  • Figure 61: Middle East & Africa Market Value Share and BPS Analysis by Country, 2025 and 2035
  • Figure 62: Middle East & Africa Market Value Share and BPS Analysis by Solution , 2025 and 2035
  • Figure 63: Middle East & Africa Market Y-o-Y Growth Comparison by Solution , 2025 to 2035
  • Figure 64: Middle East & Africa Market Attractiveness Analysis by Solution
  • Figure 65: Middle East & Africa Market Value Share and BPS Analysis by Deployment, 2025 and 2035
  • Figure 66: Middle East & Africa Market Y-o-Y Growth Comparison by Deployment, 2025 to 2035
  • Figure 67: Middle East & Africa Market Attractiveness Analysis by Deployment
  • Figure 68: Global Market – Tier Structure Analysis
  • Figure 69: Global Market – Company Share Analysis
Dashboard
Dashboard
Dashboard
Dashboard
Dashboard
Dashboard

Full Research Suite comprises of:

Market outlook & trends analysis

Market outlook & trends analysis

Interviews & case studies

Interviews & case studies

Strategic recommendations

Strategic recommendations

Vendor profiles & capabilities analysis

Vendor profiles & capabilities analysis

5-year forecasts

5-year forecasts

8 regions and 60+ country-level data splits

8 regions and 60+ country-level data splits

Market segment data splits

Market segment data splits

12 months of continuous data updates

12 months of continuous data updates

DELIVERED AS:

PDF EXCEL ONLINE

Full Research Suite


$5000

$7500

$10000

Buy Report Now
Similar Industry Reports

Similar Industry Reports

Smart Locks Market
Smart Locks Market

Smart Locks Market Size and Share Forecast Outlook 2025 to 2035

Smart Sprinkler Controller Market

Smart Sprinkler Controller Market Size and Share Forecast Outlook 2025 to 2035

Smart Indoor Gardening System Market

Smart Indoor Gardening System Market Size and Share Forecast Outlook 2025 to 2035

Smart Building Delivery Robot Market

Smart Building Delivery Robot Market Size and Share Forecast Outlook 2025 to 2035

Smart Watch Market
Smart Watch Market

Smart Watch Market Size and Share Forecast Outlook 2025 to 2035

Smart Label Market
Smart Label Market

Smart Label Market Size and Share Forecast Outlook 2025 to 2035

Smart Mat Market
Smart Mat Market

Smart Mat Market Size and Share Forecast Outlook 2025 to 2035

Smart Water Management Market

Smart Water Management Market Size and Share Forecast Outlook 2025 to 2035

Smart Built-In Kitchen Appliance Market

Smart Built-In Kitchen Appliance Market Size and Share Forecast Outlook 2025 to 2035

Smart Cold Therapy Machine Market

Smart Cold Therapy Machine Market Size and Share Forecast Outlook 2025 to 2035

Smart Personal Assistance Devices Market

Smart Personal Assistance Devices Market Size and Share Forecast Outlook 2025 to 2035

Smart Speaker Market

Smart Speaker Market Size and Share Forecast Outlook 2025 to 2035

Smart Vehicle Architecture Market

Smart Vehicle Architecture Market Size and Share Forecast Outlook 2025 to 2035

Smart City Platforms Market

Smart City Platforms Market Size and Share Forecast Outlook 2025 to 2035

Smart Doorbell Market

Smart Doorbell Market Size and Share Forecast Outlook 2025 to 2035

Smart Water Monitoring Market

Smart Water Monitoring Market Size and Share Forecast Outlook 2025 to 2035

Smart Welding Monitoring Solution Market

Smart Welding Monitoring Solution Market Analysis - Size, Share, and Forecast Outlook 2025 to 2035

Smart Behind-The-Ear Hearing Aid Market

Smart Behind-The-Ear Hearing Aid Market Size and Share Forecast Outlook 2025 to 2035

Smart Pill Box Market

Smart Pill Box Market Size and Share Forecast Outlook 2025 to 2035

Smart Medical Mattress Market

Smart Medical Mattress Market Size and Share Forecast Outlook 2025 to 2035

Future Market Insights

Smart Stadium Market

Chat With MaRIA

Chat With

MaRIA

Hi There, I am MaRIA, Your Market Research Intelligence Assistant. How may I help you?